

NurPhoto/NurPhoto via Getty Images![]()
Valuations Are Simply Too High
Microsoft Corporation (NASDAQ:MSFT) has had an epic run from the 2009 lows. The stock currently trades at 20.8x EV/FCF compared to 34.5x at the end of 2021 and 28.5x based on TTM the September quarter. Its transition from PC-driven licenses to cloud-driven subscriptions has transformed the business model from a volatile cyclical earnings engine, subject to quarter-end sales pushes and FX fueled upside/downside surprises at the end of each quarter, to a predictable, reliable performer over the last decade.
This virtuous, self-reinforcing process is now reversing into a downward spiral that could take on much of the same leveraged growth that powered the stock more than 20x above its early March 2009 sub-$15 lows (when we pounded the table to buy it for a plethora of good reasons). Those virtuous qualities, such as high leverage to cloud subscription revenues, are now reversing and becoming negative attributes that will drive the stock valuation lower with the cruel certainty of simple math: when rates surge higher, valuations of long duration assets must fall! (Duration Definition and Its Use in Fixed Income Investing.)
Daily Price Chart (TradingView.com)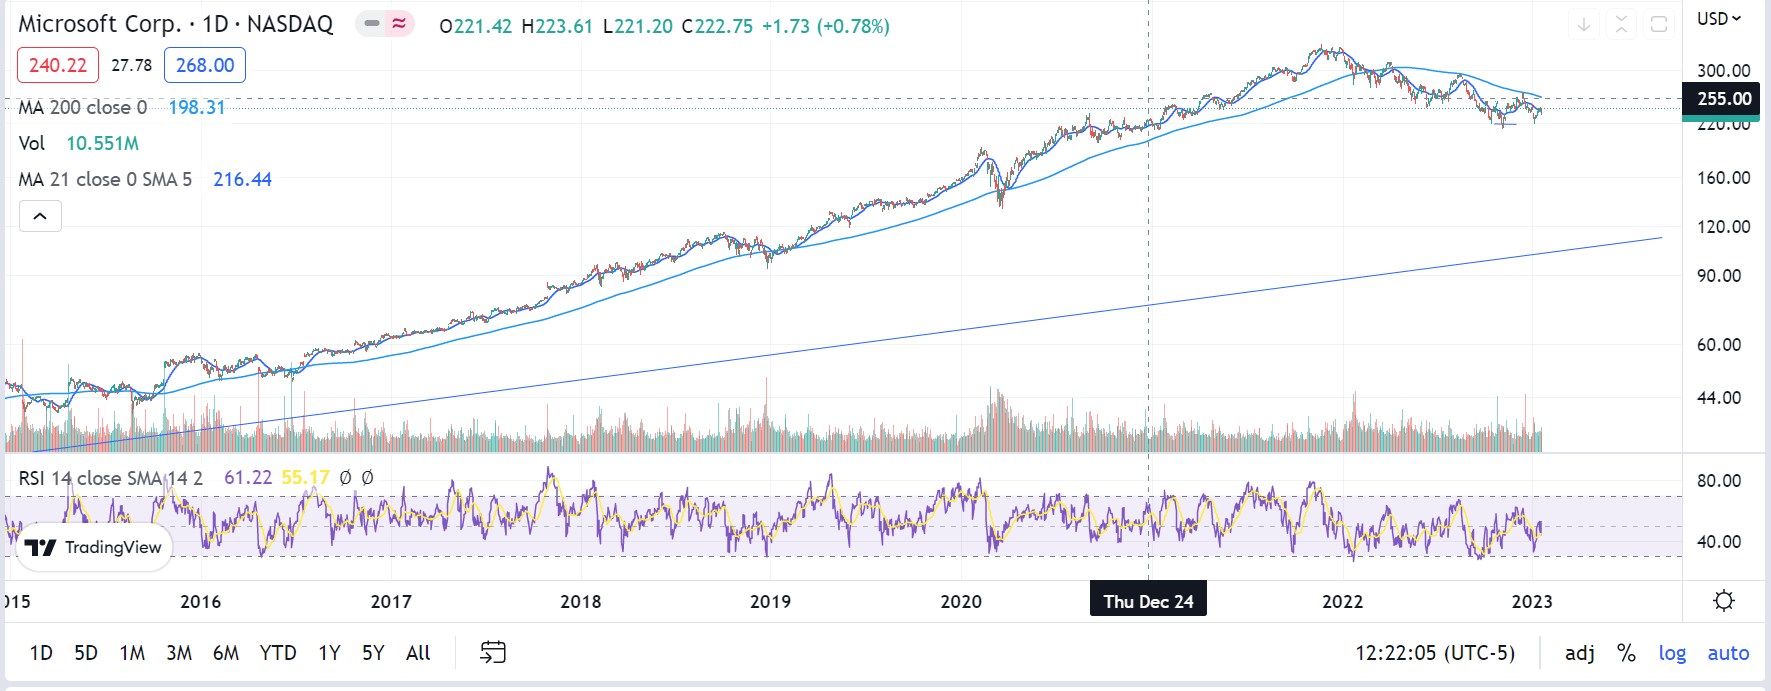
Duration Is A Demanding Master
Simply put, duration is the amount of leverage that drives valuation up (or down) due to market interest rates making significant moves in a relatively short period of time. For stocks, companies with high eps growth rates act exactly like bonds with low coupons and long maturities. That is to say, when interest rates rise from 0.5% July 2021 to 4.3% Oct 2022, every long duration asset must decline in value in a direct proportion to the length of its weighted-average cash flows, which for growth stocks means most is coming in the future. That means MSFT has a high duration due to most of its cash earnings coming in the future vs the present. So, when rates jump 300 basis points in under a year, the stock has to be revalued significantly lower, baring rapidly accelerating eps. We see clear evidence (Microsoft Corporation Earnings Revisions) that the opposite is happening as the Street revises estimates (36 times according to Seeking Alpha data) sharply lower due to heightened recession risks.
Inflation Is Pushing Rates Up (TradingView.com)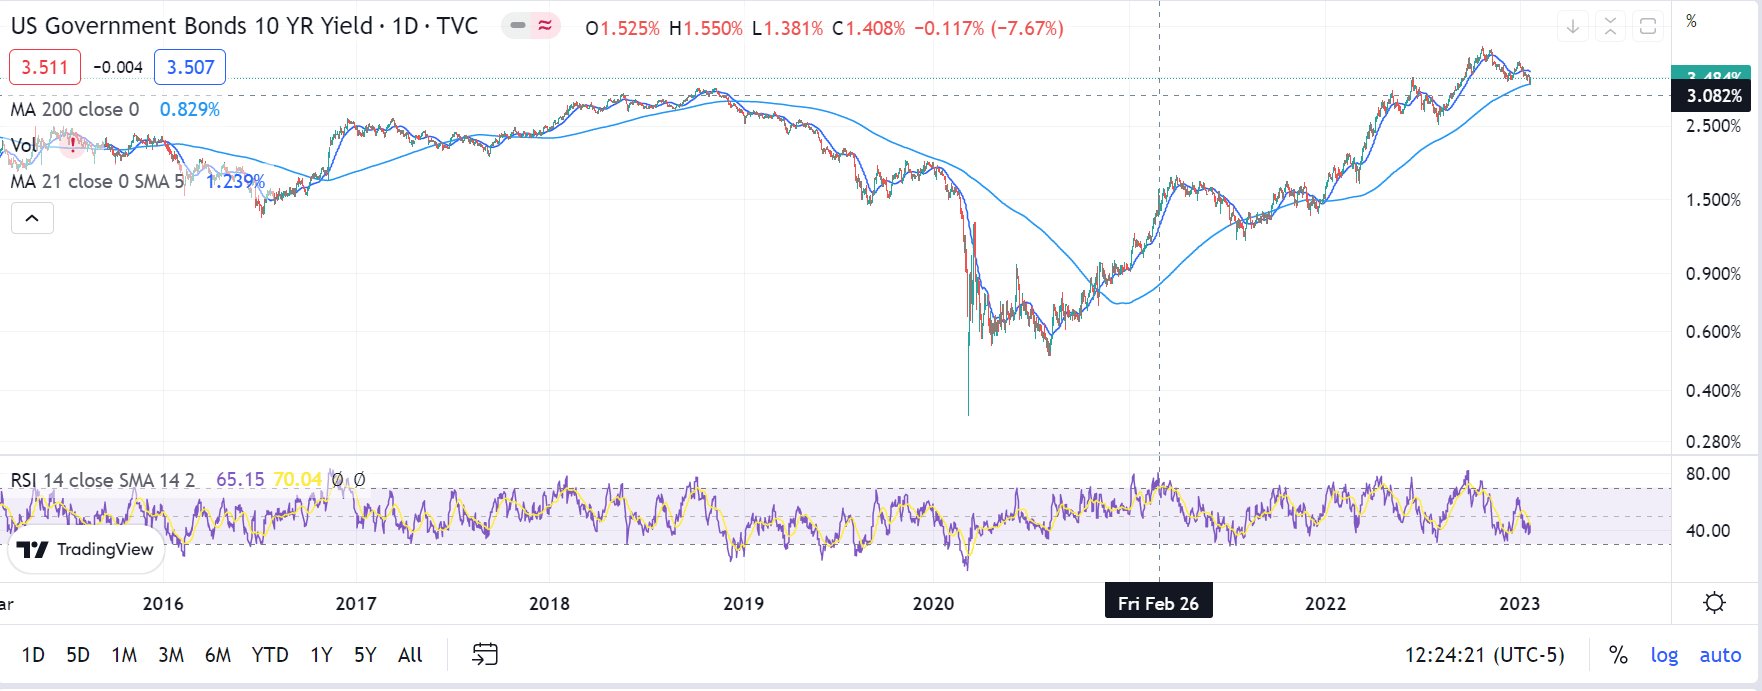
Yes, This Is A Wonky Argument
For those who didn’t soldier through the 250 hours of prep for 3 years in a row in order to earn a CFA, our duration argument probably seems like Greek to the average investor. We sympathize. The realities of the market, however, make clear a few things in times like these where rates have surged higher in a short period of time. First, long-term bonds, particularly with low coupons, get crushed when rates spiral 300bps higher inside of a year. Bond investors have endured the worst bear market since the Great Depression.
Tech stock investors have had a similar experience. The reason is that tech stocks, like low coupon long bonds, accumulate the grand majority of their cash flows in the distant future. That is what makes them long-duration assets. The rule of thumb from the CFA readings is that a 30-year zero coupon bond will fall by 30% for each 100 basis point rise in rates. That means our example long bond has fallen 90% this year! Tech stocks like MSFT have been routinely valued by the Street as long duration assets, hence the 20x rally in the stock over 14 years since the Great Financial Crisis (the “GFC”). That means MSFT’s bear market decline of 30% from its November 2021 highs at $350 to Friday’s close at $245 may have a lot further to run.
Trend History of MSFT’s Valuation
SA data shows earnings revisions of 6.4% over the last 3 months and 10.7% over the last 6 months. The Street has a longstanding pattern of plugging outyear eps growth at 10% for most tech stocks. Ahead of earnings, the Street forecasts a top line of 2% and eps down double digits. As the calendar progresses into the 4th quarter, most analysts make adjustments to their earnings models to better reflect the reality of moment. That means most outyear estimates come down as the current year moves along. This year is no exception, albeit perhaps to be more so than in the past 14 years.
The MSFT estimates have fallen 7.4%, according to SA revisions history. Investor enthusiasm has driven the stock to remarkable highs in valuation, cash flow multiples and price. As the margin debt chart shows below, pure bubble psychology has ruled the meteoric rise of the top tech names. Microsoft has been a major beneficiary of investor largess, but now macro conditions have decidedly shifted to the bear side of the sentiment spectrum. We believe that MSFT will be forced to a significantly lower valuation so long as inflation remains a growing threat to financial markets and to economic conditions as the Federal Reserve has been highlighting in its commentary ahead of Wednesday’s rate hike decision.
Leverage Is At Historic Highs (Finra.com)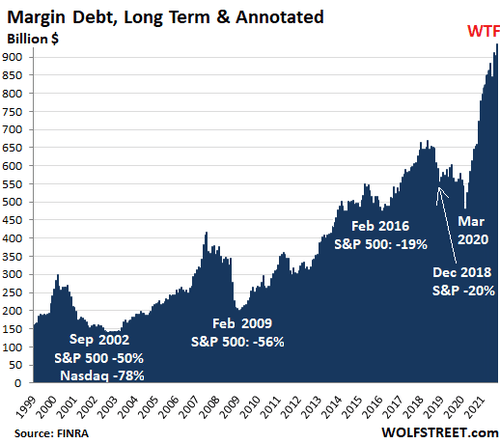
Fundamentals
Microsoft earnings are driven by recurring revenues such as subscriptions for Office and enterprise license agreements for Azure Cloud. On the way up, these reliable revenue streams drove record high valuation multiples for the stock compared to the years before when recurring revenue was a much lower proportion of total sales. Azure grew above 50% several years ago but reported 29% growth in the December quarter. Now we believe that the surging layoffs, initially at large tech companies, but increasingly everywhere, will result in a reverse effect. During the long post-GFC recovery, Microsoft benefitted from leveraged operating results powered by recurring revenues. In the current environment, the leverage reverses to the downside with equal power: it’s just the math!
Risks
Microsoft is investing heavily in AI, which will power all aspects of its offerings (AI tools will be built into all Microsoft products, says CEO Satya Nadella). Recent news suggested that Microsoft will follow its 2019 $1 billion investment into GPT-3 with another $10 billion to commercialize the rapidly developing technology into every aspect of its applications. We hear from industry professionals that GPT-3 is not ready yet to replace the many professionals at the company who code for a living, but that the time is rapidly approaching when AI will drive much of app development efforts. The resulting reduction in operating costs and potential new revenue streams could represent a risk to our relatively near term outlook, but we think another year or more will be required to integrate the full potential of AI into Microsoft operations and thus don’t see significant cost savings occurring in our time frame.
Another risk is that Microsoft’s enormous profitability over the last 14 years could have provided enough “rainy day” savings to cover for slower growth. One example we found during our deep dive into company financials was that Microsoft front loaded the depreciation and expensing of its assets. We were looking for examples of software companies under reserving for asset depreciation as a means to temporarily enhance results, but discovered that a few software players were doing the opposite: by expensing longer term assets as short term, fully expensed items, we believe they reducing reported profits. This process could then be reversed during more challenging times, effectively passing profits from one period to others as needed. Given the flexibility of accounting standards, we don’t think there is anything wrong with doing this, but it does give companies more tools to manage reported results.
A third risk to our outlook is that inflation, and therefore long term rates, continue to decline rapidly following the June CPI peak. We hear from industry sources that supply chains are still transitioning higher costs through value chains, likely resulting in a rebound in inflationary cost increases over the coming months. Energy appears to be in a lull (we see an emerging buy signal on our Supply/Demand models for natural gas prices for example) that could end soon, especially if winter reasserts itself across North America and Europe. Higher salary expectations appear to be a major source of supply-push inflationary pressure going forward as well (Millennials Survey: 70% Say They May Change Jobs When Economy Improves – TLNT).
The Trade
We believe that MSFT is at risk of further declines in price over the next several weeks to months. Our primary research into the effects of layoffs on its leveraged operating model suggest that Street eps estimates could be too high. The stock shows a bearish RSI divergence on weekly charts. Our Elliot Wave count for MSFT is for a corrective ABC (wave 2 of a 5 wave pattern lower) pattern that appears to be in its 3rd and final stage into earnings season. The .618 projection is at $195. Our proprietary Supply/Demand models show an emerging sell signal that is close to becoming operative, probably after its earnings report this week. Money flow also shows a what could be institutional selling. Further information about our technical call is available upon request.
Conclusion
We believe that Microsoft Corporation stock is vulnerable to another down-leg, most likely following its earnings report this week. We would use any strength following the report to short the stock for a window lasting several weeks to months. News about corporate layoffs is likely to continue to build as 4Q results are released, providing further impetus for margin and multiple compression. Street consensus remains fairly sanguine, in part out of respect for the earnings powerhouse that is Microsoft Corporation. The stock shows risk in our technical studies, indicating the potential for downside in the next several weeks.
Supply/Demand Weekly Chart
Weekly Supply/Demand Model Approaching A New Sell Signal (Summit Analytic Partners)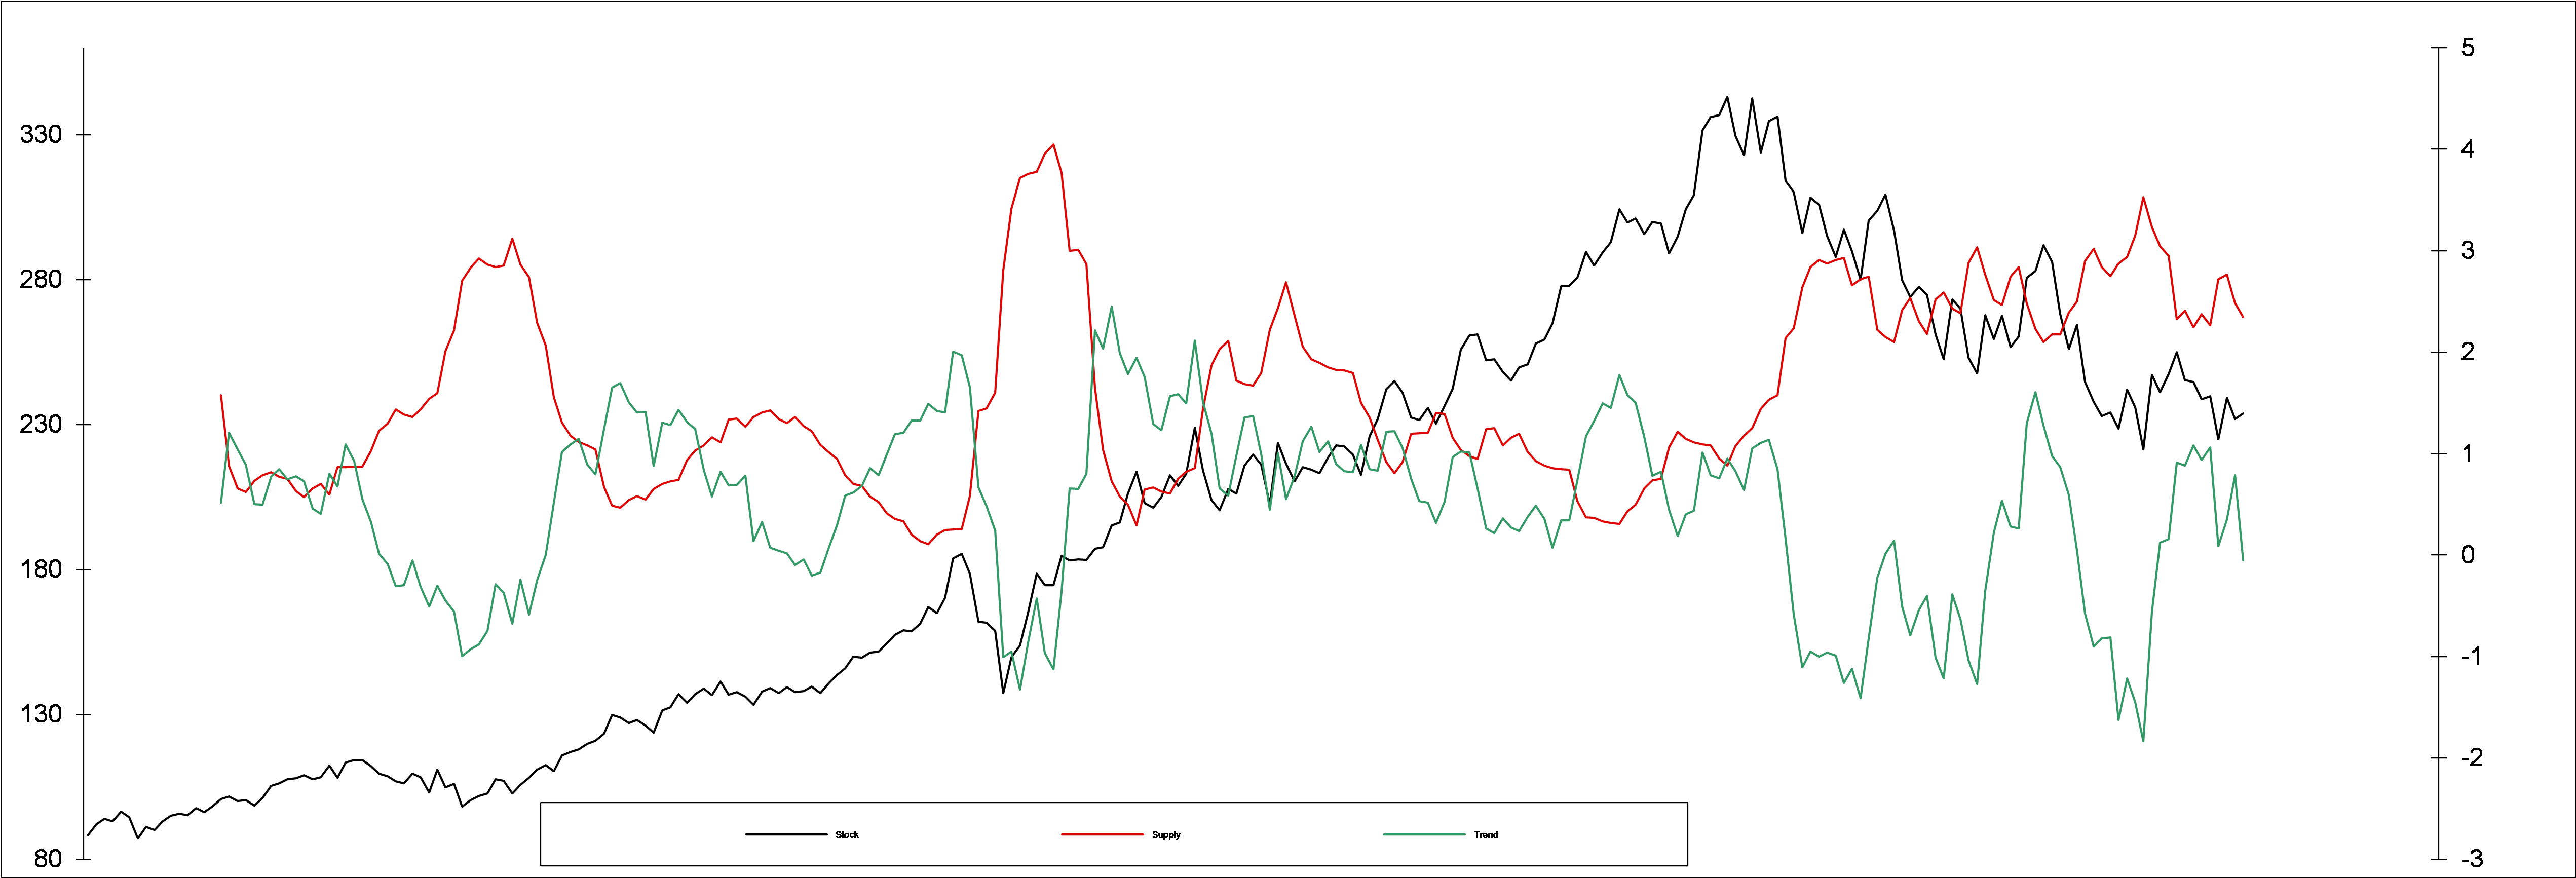
Sell pattern is close at hand as Supply (red) and Demand (green) diverge
Volume-Adjusted Price Weekly Chart Showing Selling Pressure (Summit Analytic Partners)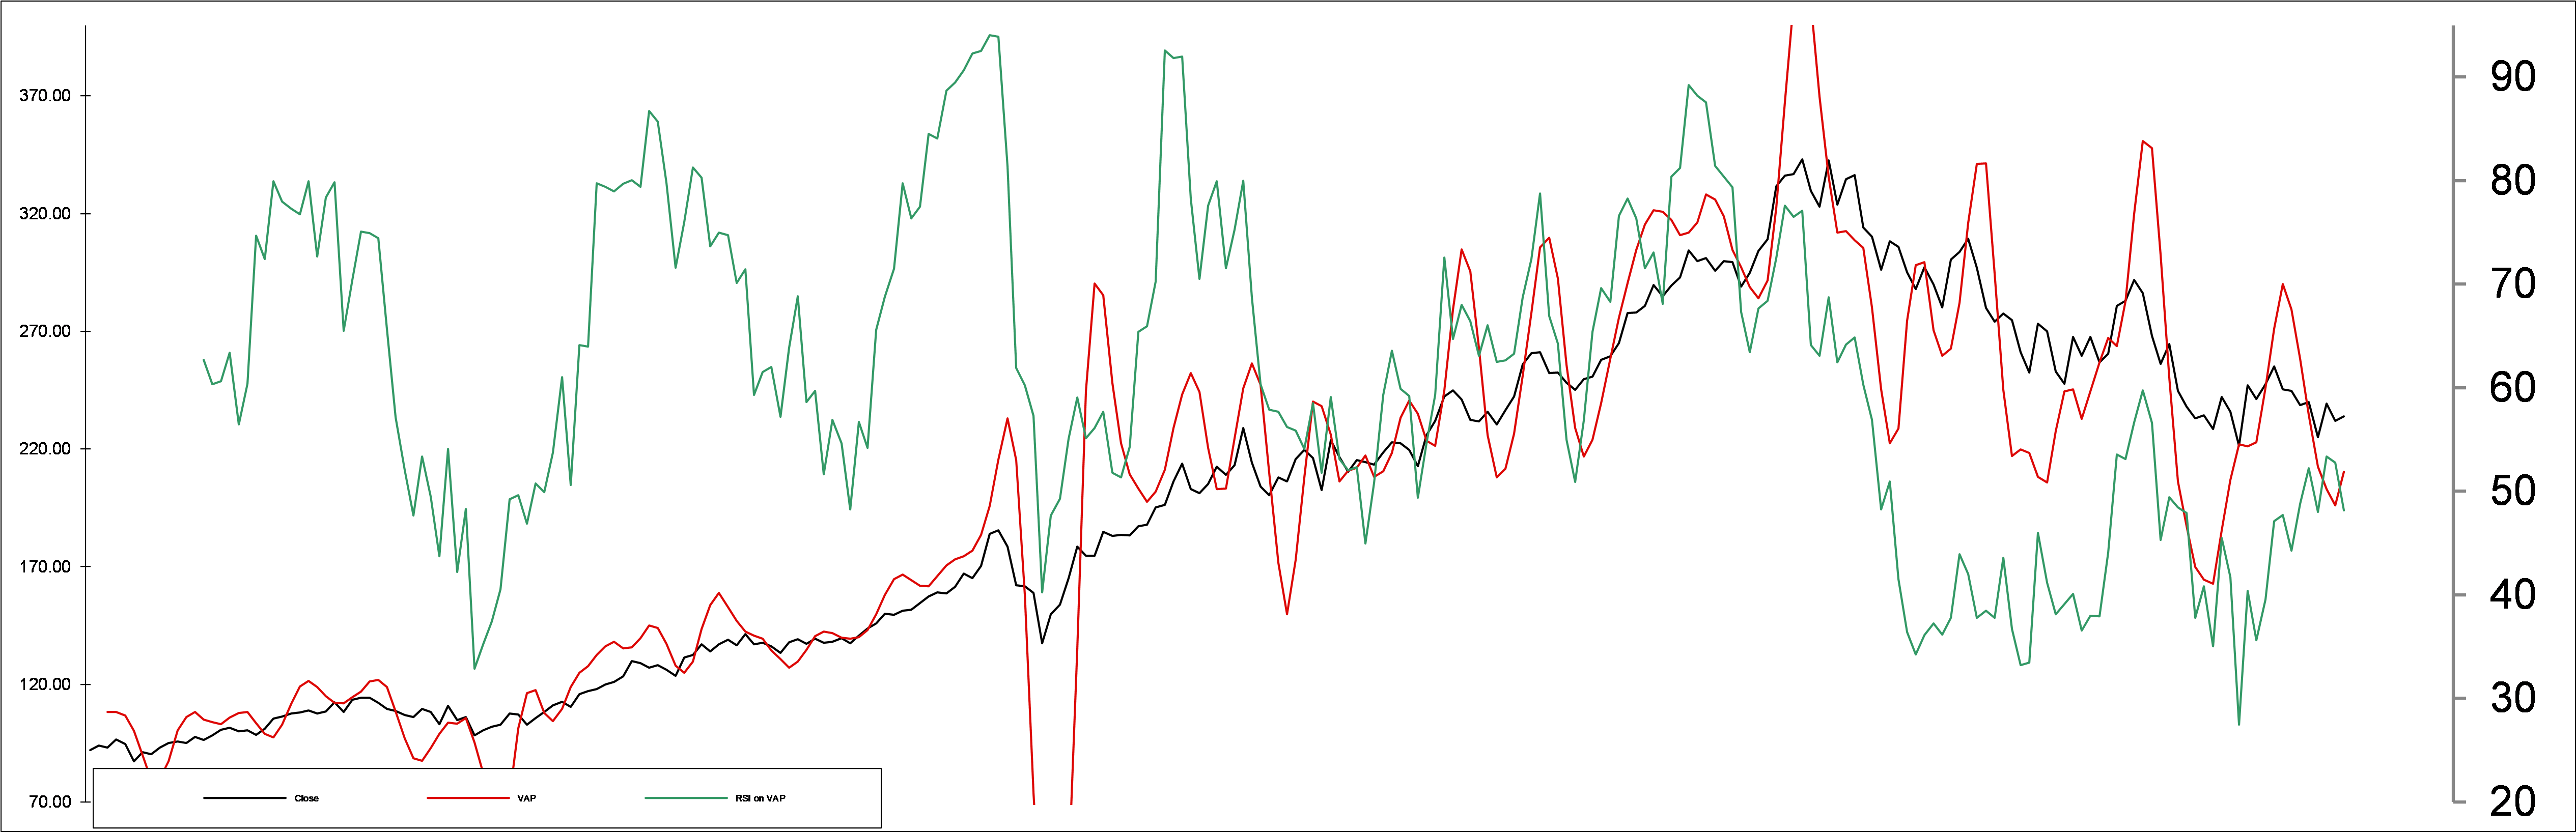
Momentum (green) has turned negative – Buying power (red) indicates the end of a weak rally
Additional Information Available Upon Request
Be the first to comment