

Dow Jones, S&P 500, Nasdaq 100 Price Analysis & News
- Oil Price War May Tip US into a Technical Recession
- Coronavirus Spread in the US on the Horizon
- Global Equities Tumble
If the spread of the coronavirus crippling global demand enough to topple for equity markets, they now have to contend with an all out oil price war. In reaction to the weekend events, global equities gapped significantly lower at the open with E-Mini S&P 500 futures hitting limit down. As it stands, US indices are trading with heavy losses (Dow Jones -5%, Nasdaq 100 -5.1%, S&P 500 -5.1%) much like their global counterparts. The worst hit being the FTSE MIB (-9%) as the spread of the coronavirus forces 16mln citizens into quarantine. The move lower across equity markets has also coincided with the distressed signals sent by the bond market as US yields drop below 1% across the entire curve. In turn, money markets are pricing in a 59% chance that the Federal Reserve will cut interest rates to 0% (0-0.25% target range) with risks significantly rising that the US could dip into a technical recession. (Credit stress in high yield debt likely to signal large concerns for shale producers).
Federal Reserve to Cut Interest Rates to Zero
How to Invest During a Recession: Investments & Strategy
Circuit-breakersS&P 500 guidelines:
- 7% Decline, (208 points), trading will pause for 15 min
- 13% Decline, (386 pts) trading will again pause for 15 mins
- 20% Decline, (594 pts) the markets would close for the day.

Recommended by Justin McQueen
Download our fresh Q1Equities Forecast
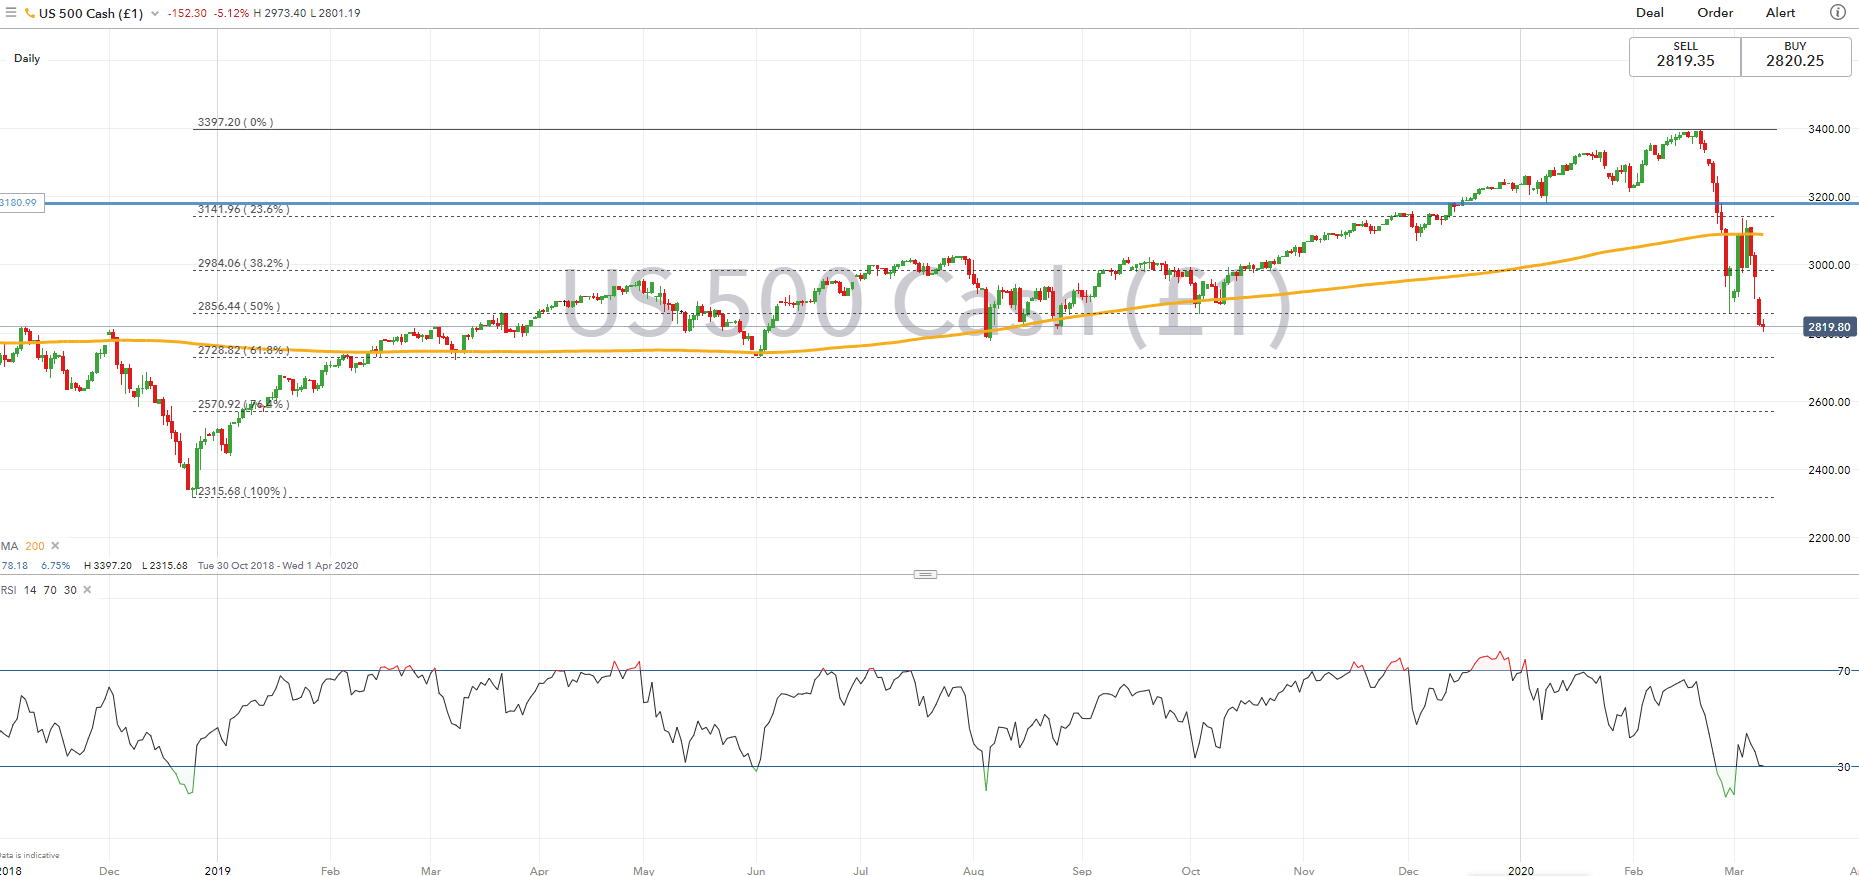
S&P 500 | Little Support Ahead
Little in the way of notable support for the S&P 500 after crashing through the 50% Fibonacci retracement situated at 2856. Risks remain heavily tilted to the downside with the doors open towards a possible drop to 2728 (61.8% Fibonacci retracement).
| Change in | Longs | Shorts | OI |
| Daily | 3% | 0% | 1% |
| Weekly | 8% | 55% | 29% |
S&P 500 Price Chart: Daily Time Frame
Dow Jones | Shallow Bounce, Outlook Bearish
Declines in the Dow Jones have been briefly halted with support situated at 24554, however, any bounces are likely to be short-lived and shallow in the absence of notable positive news. Coronavirus cases in the US remain relatively low given the lack of testing and thus the situation is likely to get worse before it gets better. A firm break of current support leaves the index vulnerable to a deeper retracement towards 24000.
| Change in | Longs | Shorts | OI |
| Daily | -13% | 24% | 3% |
| Weekly | 14% | 78% | 40% |
Dow Jones Price Chart: Daily Time Frame
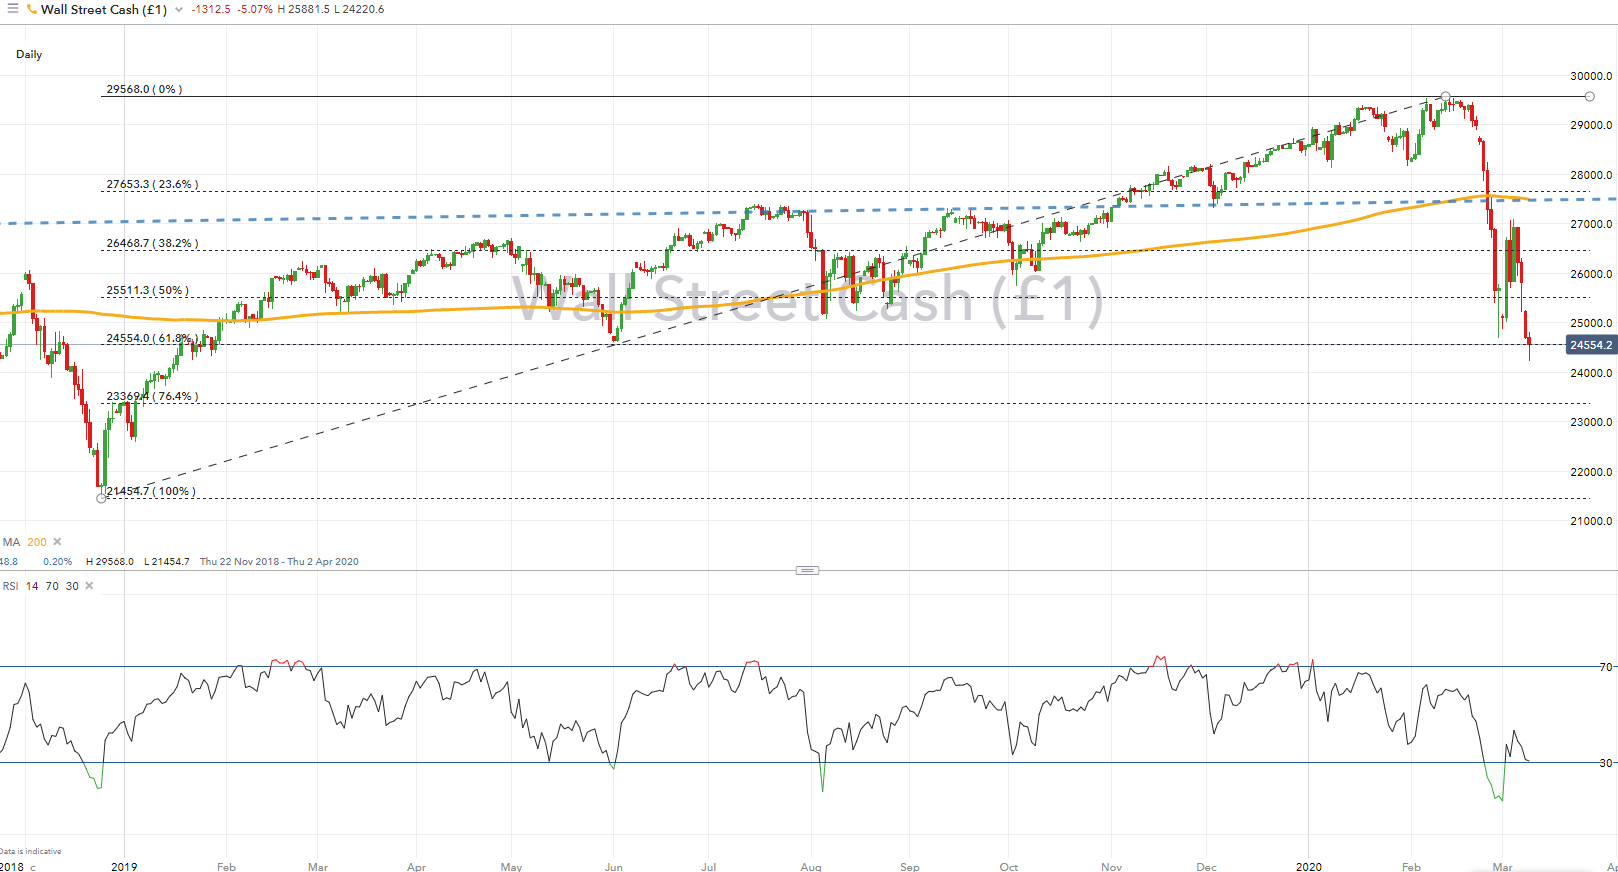
Source: IG Charts
Nasdaq 100 | Sub 8000 Pending?
The Nasdaq 100 gapped below its 200DMA and much like the Dow Jones and S&P 500, the index remains weak. The index appears on course for a break below the 8000 level as uncertainty remains rife. Notable support is situated at 7768, which marks the 50% fib, however, failure to hold raises the likelihood of a 7500 test.
Nasdaq 100 Price Chart: Daily Time Frame
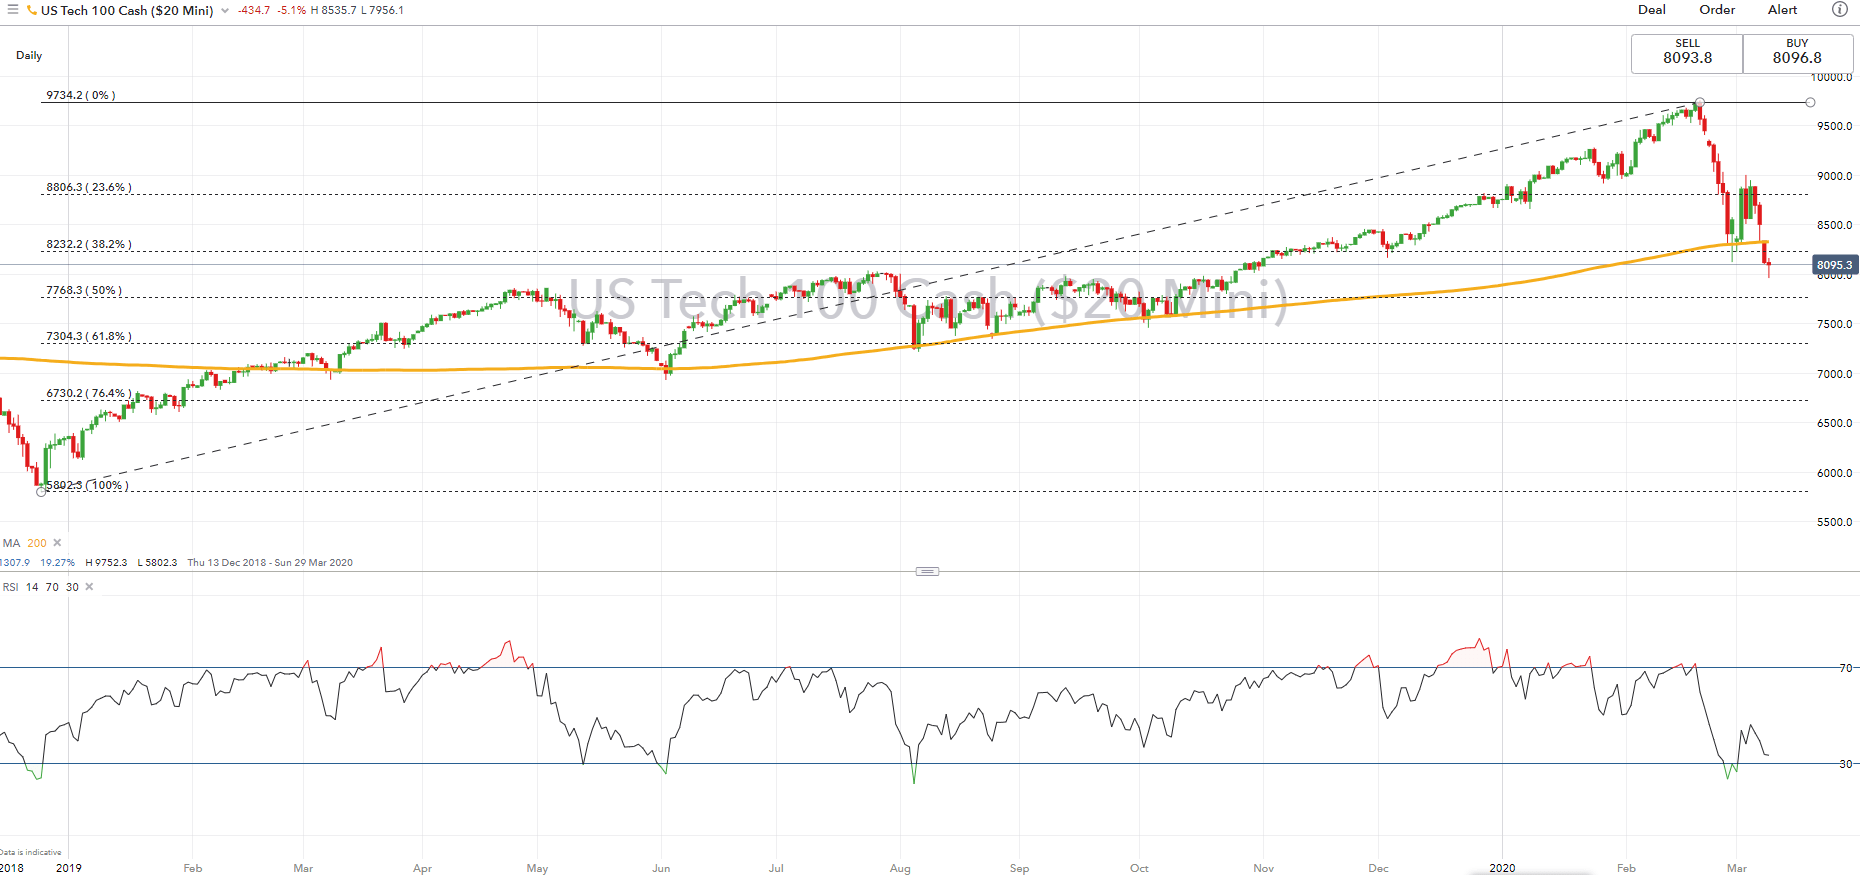
IG Charts
— Written by Justin McQueen, Market Analyst
Follow Justin on Twitter @JMcQueenFX
Be the first to comment