

Dow Jones, S&P 500, DAX 30, Trader Positioning – Talking Points
- Global stock markets have bounced, can this trend last ahead?
- Sentiment hints Dow Jones and S&P 500 may rise as DAX falls
- Technical analysis however seems to be favoring the downside
What Does Trader Positioning Say About Global Stock Market Trends?
Global stocks have bounced after appearing to find a bottom towards the end of March. The Dow Jones, S&P 500 and DAX 30 are attempting to recover lost ground as they struggle to push above key resistance. Can upside momentum last? These topics are discussed in this week’s session on IG Client Sentiment (IGCS) where I discussed trader positioning, fundamental and technical analysis to uncover the prevailing trends.
Starts in:
Live now:
Apr 08
( 00:04 GMT )
Recommended by Daniel Dubrovsky
What Do Other Traders Buy/Sell Bets Say About Price Trends?
Dow Jones Sentiment Outlook
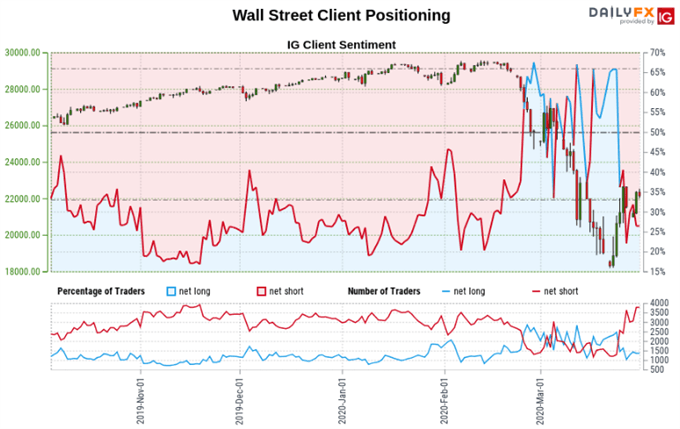
According to IGCS, 30.88% of traders are net long the Dow Jones Industrial Average at the time of this writing. Those net short have increased by 2.06% and 51.64% over a daily and weekly basis respectively. The combination of current sentiment and recent changes gives us a stronger bullish contrarian trading bias. That may speak to an increasing share of traders attempting to pick the top in the Dow Jones.

Recommended by Daniel Dubrovsky
Improve your trading with IG Client Sentiment Data
Dow Jones Technical Analysis
Meanwhile the Dow Jones (futures) appears to be struggling around falling resistance from February. The index is on the verge of confirming a downside breakout through near-term rising support from late March – green line on the 4-hour chart below. This also follows the presence of negative RSI divergence, showing fading upside momentum. A push through 23022 may spark upside capitulation.
Dow Jones Futures 4-Hour Chart

Dow Jones Futures Chart Created in Trading View
S&P 500 Sentiment Outlook
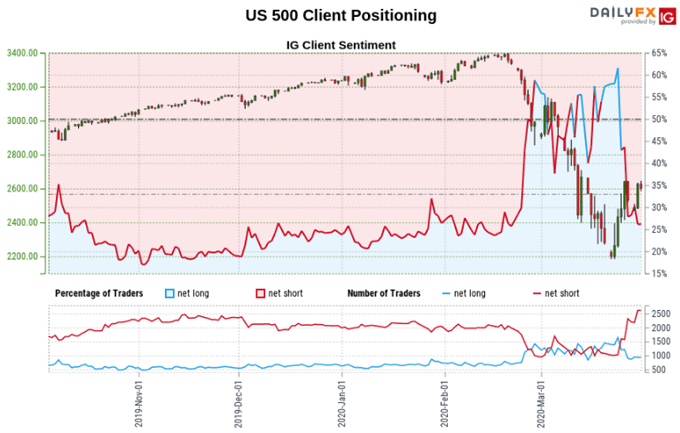
IGCS shows that 28.18% of retail traders are net long the S&P 500. Those betting on the short side have increased by 6.86% and 73.32% over a daily and weekly basis respectively. With that in mind,the combination of current sentiment and recent changes gives us a stronger S&P 500 bullish contrarian trading bias. From a psychological standpoint, that may speak to more investors trying to pick the top should prices rise.
S&P 500 Technical Analysis
S&P 500 futures struggled to push above “outer” resistance on the 4-hour chart below. While the IGCS outlook appears bullish, keep in mind that the index is attempting to confirm a downside breakout through rising support from March’s bottom. This also follows the emergence of negative RSI divergence. With that in mind, a push through 2634 with confirmation could refocus the trajectory to the upside.
S&P 500 Futures 4-Hour Chart

S&P 500 Futures Chart Created in Trading View
DAX 30 Sentiment Outlook
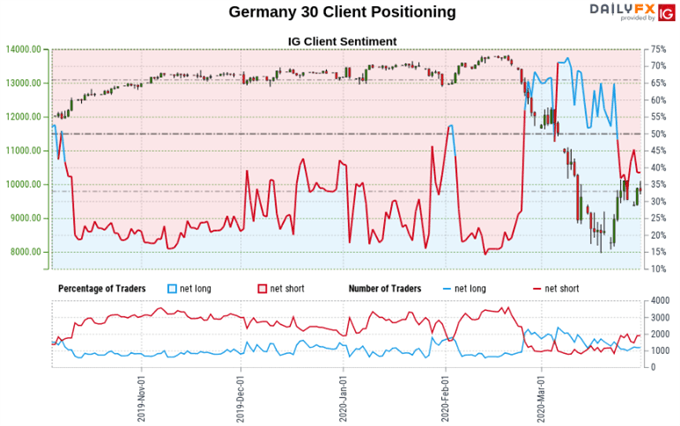
Readings from IGCS at the time of publishing show that 39.65% of DAX 30 traders are net long. Those biased to the downside have decreased by 3.60% and 12.53% over a daily and weekly period respectively. Recent changes in sentiment warn that the current price trend may soon reverse lower despite the fact traders remain netshort.
DAX 30 Technical Analysis
DAX futures appear to be trading within an Ascending Triangle using the 4-hour chart below. This is a continuation pattern where the price trajectory could be determined by the direction of the breakout. A descent through the floor of the triangle may see the aggressive downtrend resume course to revisit lows from March. Otherwise a push through 10205 may shift the focus to the upside.
DAX 30 Futures 4-Hour Chart
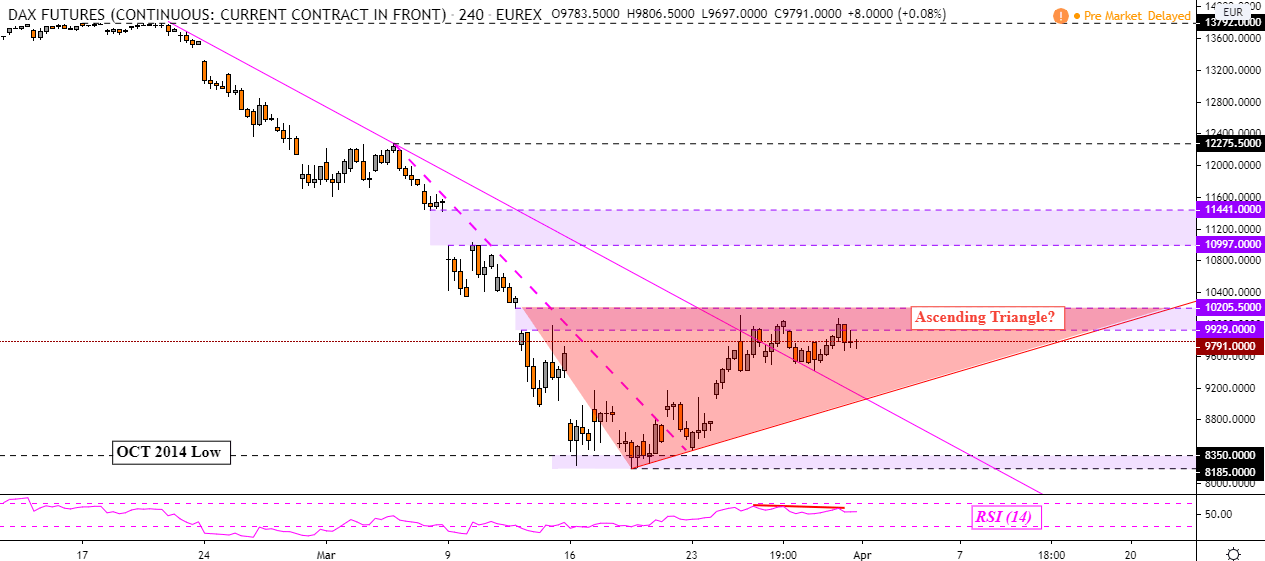
DAX 30 Futures Chart Created in Trading View
*IG Client Sentiment Charts and Positioning Data Used from March 31 Report
— Written by Daniel Dubrovsky, Currency Analyst for DailyFX.com
To contact Daniel, use the comments section below or @ddubrovskyFX on Twitter
Be the first to comment