

Dow Jones Forecast:
Dow Jones Price Forecast for the Week Ahead
The Dow Jones trades within reach of record levels to start the week despite a reversal lower following last week’s Fed meeting. The Industrial Average continues to outperform the Nasdaq 100 as Treasury yields tick higher and investors ponder capital allocation strategies amid the shifting fundamental environment. While yields might continue to rise and pressure the Nasdaq further, the Dow Jones has benefitted from the changing landscape making it an ideal candidate for potential bullish exposure.
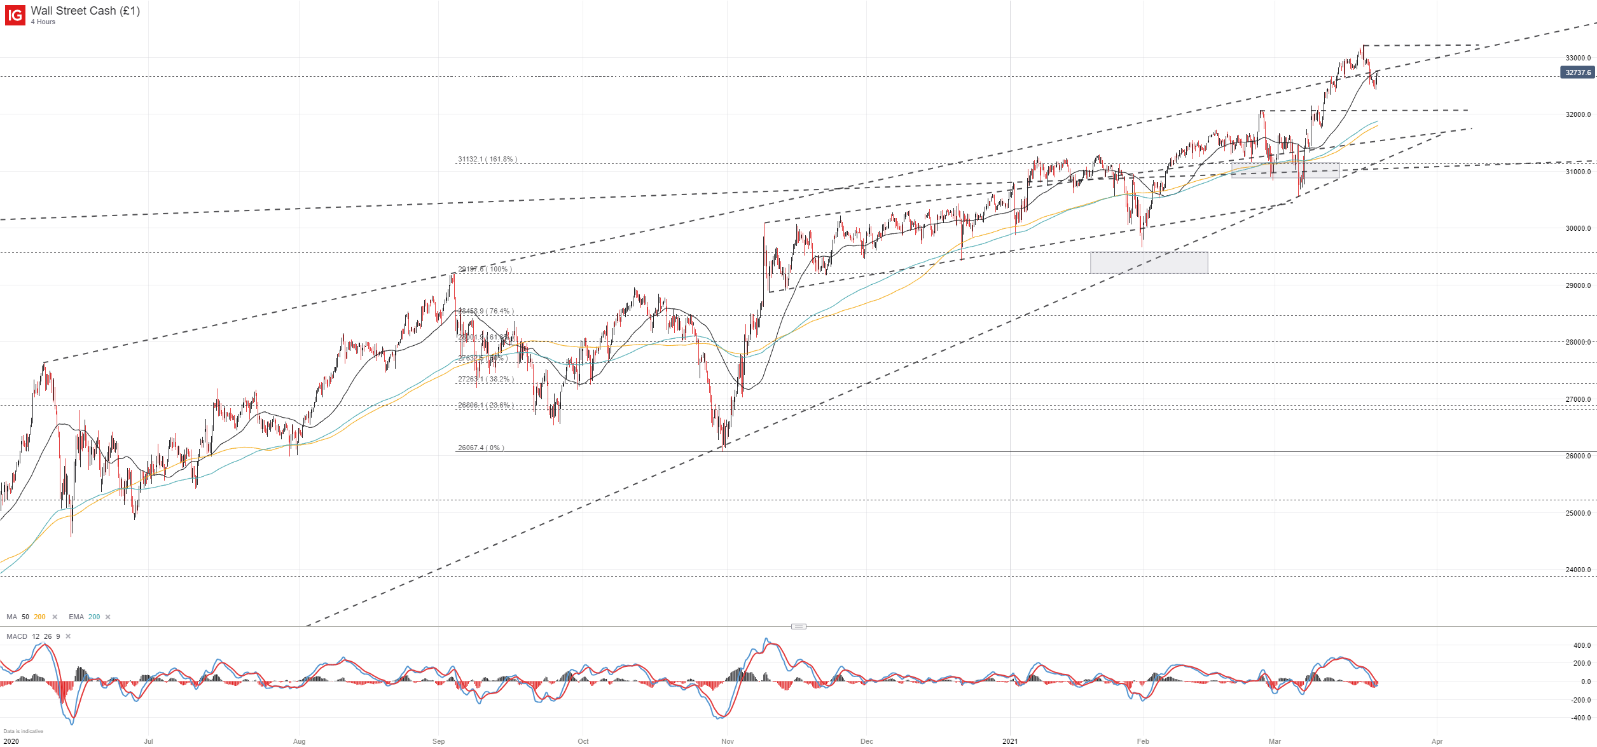
Dow Jones Price Chart: 4 – Hour Time Frame (June 2020 – March 2021)
Further still, few things are more encouraging from a technical standpoint than trading within reach of all-time highs. Regardless of potential headwinds and cited concerns, a continued grind higher in price suggests demand exists for the index despite the risks. With that in mind, recent declines – likely due to the coming end of the Fed’s SLR– might be short lived in the bigger picture.
In the technical picture, an imminent MACD crossover on the 4-hour chart might signal further gains are ahead as long as the signal line is overtaken while price remains above the 200-period exponential moving average and the two lines remain beneath 0. As it stands, resistance is rather sparse with only the index’s prior highs and an ascending trendline from June standing in the way of further gains. The two barriers trade around 33,215 and 32,790 respectively.

Recommended by Peter Hanks
How to Trade FX with Your Stock Trading Strategy
Should bearishness reignite and drive the Dow Jones lower, initial support might exist at the index’s February swing high near 32,000. Secondary support might be offered by the collection of technical levels slightly lower around 31,620 and 31,150. IG client sentiment data reveals retail traders remain overwhelmingly net-short the Industrial Average which might suggest price will continue to rise since we typically take a contrarian stance to crowd sentiment.
| Change in | Longs | Shorts | OI |
| Daily | 27% | 6% | 12% |
| Weekly | 21% | -18% | -8% |
–Written by Peter Hanks, Strategist for DailyFX.com
Contact and follow Peter on Twitter @PeterHanksFX
Be the first to comment