

Patricia Elaine Thomas/iStock via Getty Images
Douglas Emmett, Inc (NYSE:DEI) is an office-focused real estate investment trust (“REIT”) that not only owns a portfolio of Class-A office space, but also a sizeable portfolio of multifamily apartment units, which provides a contribution of nearly 20% to total annualized rental income.
In addition to the defensive hedge afforded to them by their multifamily exposure, their properties benefit from being located in the key markets of Los Angeles County and Honolulu, two severely supply-constrained markets with favorable economic fundamentals.
Coming off their recent Q3FY22 earnings release, shares still trade at the back-end of their 52-week range and have yet to catch on with most investors.
Additionally, Seeking Alpha’s (“SA”) Quant ratings now assigns a “strong sell” rating on the stock, with poor grading on all categories, except valuation.
Seeking Alpha – Quant Rating History Of DEI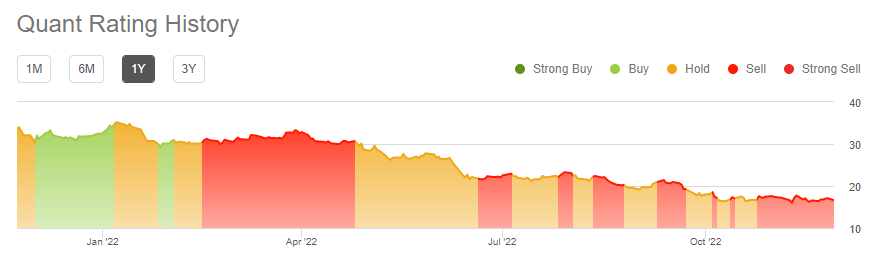
Despite the overall pessimism, DEI continues to remain significantly undervalued with material upside potential. In addition, shares offer prospective investors a well-covered dividend that is currently yielding over 6.5%. While their earnings release did little to persuade skeptical investors, their underlying fundamentals remain intact and are capable of supporting a higher assessed earnings multiple.
Current Occupancy Levels
Quarter end occupancy within the office portfolio remained virtually unchanged from the second quarter, with consolidated leased rates at 87.6%, up just 10 basis points (“bps”) from Q2. In addition, there continues to be a sizeable spread in physical occupancy levels of 370bps.
While this does present opportunity for earnings growth, the spread remains more than twice their historical average and has continued to defy expectations of narrowing. This, however, is mostly due to positive factors, such as their high amounts of new leasing activity, which naturally creates gaps due to the timing of new move-ins.
In addition, more tenants are either relocating within the portfolio or expanding from their current space, which, again, results in timing differences of when cash receipts are ultimately received.
But regardless of these factors, little movement in physical occupancy levels ultimately translates to lower earnings growth in the present. And this was reflected on the earnings release, as lower average occupancy combined with higher than projected inflation resulted in a narrowing in full-year same property cash net operating income (“NOI”) and funds from operations (“FFO”).
Leasing Statistics
DEI signed over 1M square feet (“SF”) of space during the quarter, approximately 35% of which was attributable to new signings. Furthermore, the company noted gains in larger tenant demand, with the average deal size now up to 5K SF.
And together with renewals, the weighted average lease term (“WALT”) of these signings was just under 5.5 years, which is slightly better than Q2 overall, driven by gains in renewals but offset in part by shortened terms on new signings.
In addition to strong leasing volumes during the quarter, the company also reported positive net absorption, though this metric continues to be weighed down by the lag in physical occupancy gains.
Cash spreads also remain negative, despite positive growth on a straight-line basis. This is a continuing trend that should realign through future physical occupancy gains.
In addition, the weaker cash spreads is not reflective of the 3-5% annual escalators embedded in nearly all of the company’s leases. With this in mind, the company could still theoretically realize a 10% increase in lease value even if they started rent 3% below prior levels.
Q3FY22 Investor Presentation – Illustration To Show Value Of Leases With Embedded Escalators That Are Not Reflected In Cash Spreads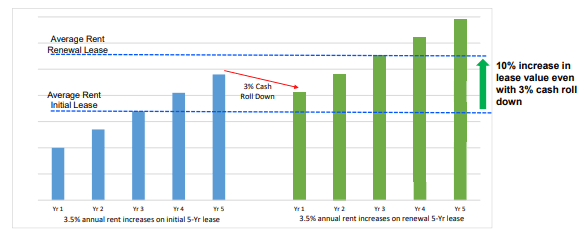
Liquidity And Debt Profile
At the end of September 30, 2022, DEI had +$281M in cash on hand and full availability on their +$400M revolving credit facility. In addition, they are on pace to generate over +$500M in operating cash during the year.
As a percentage of total capitalization, their debt load stood at 52% at quarter end. This is up from 47% at the end of Q2 due to the decline in their share price from $22.38/share then to $17.38/share at the end of Q3.
As a multiple of EBITDA, net debt is on the higher end, at 7.85x, which compares unfavorably to others within the sector. Cousins properties (CUZ), for example, which is one office sector peer, has a net debt multiple below 5x.
One offset is their high percentage of fixed rate debt holdings. At period end, 89% of their consolidated borrowings were fixed or swap-fixed with interest rate swaps. In addition, they benefit from a low weighted average interest rate on debt of 2.82% and no maturities until the end of 2024.
They do, however, have a number of swaps expiring in 2023, which will likely result in unfavorable rolls on any new swaps issued. This will ultimately translate to higher interest expense. But at present, it doesn’t appear the company will be weighed down by the additional expense.
As a case in point, management is expecting total interest to land at +$150M. That compares to estimated FFO of +$420M, which is nearly 3x over total interest incurred. While the higher expense will certainly weigh on earnings, it won’t be enough to create a liquidity concern.
Dividend Safety
DEI currently pays a quarterly dividend of $0.28/share, which represents an annualized yield of about 6.7% at current pricing. By comparison, at the end of 2019, which was the last time the company increased the quarterly payout to its current level, the payout yielded less than 3%.
Seeking Alpha – DEI Dividend Growth History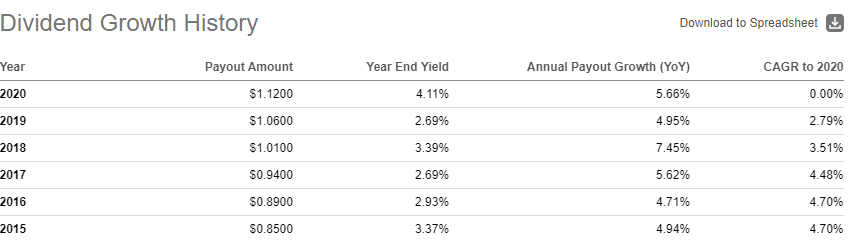
As a percentage of FFO, the current payout stands at 55%. On an adjusted basis, however, the payout ratio is 64%. This is better than the sector averages for both FFO and AFFO, which stand at 65% and 73%, respectively.
In addition, the company has generated +$382M in operating cash through the first nine months of the year. This is +$234M more than the total distributions paid out over the same time frame. And even when considering distributions to noncontrolling interests, cash flows are still nearly 2x greater than their total payouts.
While current coverage levels are adequate to preserve the payout in its current form, future hikes are unlikely. Interest expenses are expected to track higher next year, and despite solid leasing volumes, the overall sector still faces secular risks stemming from a “new normal” in occupancy levels due to the rise of hybrid working arrangements. For management, this warrants extra caution on the use of cash until there is a more marked improvement in the general operating environment.
Material Upside Exists, Despite Uneventful Earnings
DEI continues to trade at a depressed valuation and at the lower end of their 52-week range. And in some respects, the current earnings release did little to persuade skeptical investors. Overall occupancy remained essentially unchanged despite leasing volumes that, again, totaled over 1M SF. This then resulted in pared full year guidance in an otherwise uneventful conference call.
But despite stagnant surface level results, the outlook appears promising for the company. Yes, physical occupancy still lags, but this is primarily due to new signings and space expansions/relocations of existing tenants, which inherently produces a timing difference between leased and physical occupancy rates.
And at a leased rate of 87.6% in the office portfolio, occupancy is down just 570bps from the level reported at the end of 2019. Yet the share price trades at a fraction of what it did back then at a forward multiple of just 8.4x versus a 20x multiple previously. In addition, their current valuation implies a cap rate of approximately 6.9%. That is a far cry from the 4.8% commanded at the end of 2019.
While a return to previous trading levels is unlikely, at least in the near-medium term, a rebound appears overdue. Consistent with a prior analysis, a 13x multiple would not be unreasonable, considering the company’s strong leasing momentum and their defensive hedge in their multifamily portfolio, which provides a contribution of nearly 20% to total annualized rents. At this multiple, shares would have implied upside of nearly 60%. For any investor, this presents a meaningful risk/reward proposition.
Be the first to comment