

Thinkhubstudio/iStock via Getty Images
When History Rhymes
We believe this is a special and valuable edition of the ROE Reporter. This has been a difficult year in both the stock and bond market. Difficult for our investors and frustrating for us. The saving grace is that our companies continue to perform exceptionally well on an operational level.
We didn’t invest in the growth at all costs type companies, the unprofitable speculative companies, or any cyclical companies. That is where the froth in the market was. We invest in compounders. Companies that consistently increase their intrinsic value. This is where the frustration stems from because all of our top investments are on pace to have record years!1 Both record revenues and record profits.2 Their stock prices tell a different story, and this is where the opportunity lies. The market sell-off has been indiscriminate. A shoot first and ask questions later environment.
We have had many meetings, calls, and webinars with our investors. What became evident is that we could do a better job not just explaining what is happening in the market and with our investment companies, but that we also need to clearly illustrate the magnitude of the current dichotomy. In other words, we need to use numbers, analysis and examples to support our outlook. This newsletter will focus on putting this investment landscape into context, and hopefully leave the reader with a clear and concise understanding of what future stock returns could look like.
Quick Macro Points
Investor sentiment can be described as the aggregated public opinions, views, feelings, mood, or outlook that make up the market psychology at any point in time. In the short term the market is controlled by emotion and emotions are volatile. On any given day a stock may be up or down based on the collective decisions of individuals. Selling a stock to buy a different stock. Selling a stock to put a down payment on a house. Selling or buying stocks because of something they read in the paper.
In the long term however, a stock’s return is based on its fundamentals and to be simplistic, can be boiled down to future growth in earnings per share and the multiple you pay for those earnings (plus dividends). We focus our day-to-day on analyzing company fundamentals, and we care about investor sentiment because that impacts the price you pay for a stock and in turn, your future returns from that investment.
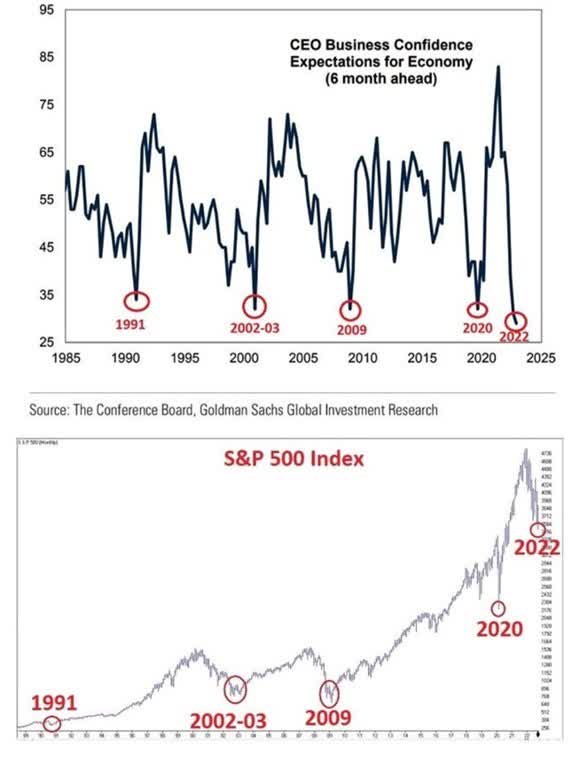
Currently, the emotional pendulum has swung to extreme pessimism, offering the opportunity to buy earnings at very cheap multiples. In recent newsletters and podcasts, we offered a few good examples of ways to track sentiment, like a historic amount of investor cash on the sidelines or extremely negative investment advisor sentiment surveys, or aggregate stock multiples for future earnings. With many of these sentiment indicators being at all-time extremes. To keep it brief and to the point, we include the chart of CEO confidence and the respective positive reaction in the stock market when people get too negative.
On this topic, we will leave you with our thoughts from our January 2009 newsletter:
Looking back at 2008, it is now clear that a financial crisis that began in the US ultimately spread to a global crisis which included a massive and sudden deleveraging that affected virtually all investment asset classes. This deleveraging process is analogous to an individual margin call. When one suffers a margin call, one generally needs to raise capital quickly and thus the margin call results in the investor selling those investments that are most liquid. When a margin call occurs on the scale that occurred in 2008 these “forced sellers” literally overwhelm potential buyers and markets fall sharply. At the same time, falling share prices have a psychological effect on the rest of the market because we tend to equate a falling share price with a pending problem with our investment. Thus, if a stock falls sharply in a short period of time, it is rational for us to assume that this drop in share price means the market knows something we don’t, and that negative news is imminent. Thus, massive margin calls have a compounding effect on market psychology and at a certain point selling begets selling. Market sell-offs do not just affect investor behaviour in isolation of all other participants in the economy. Corporate executives, analysts and consumers are all affected in different ways by rapidly falling asset values. In a market where asset prices are falling sharply, company executives preserve cash and postpone major capital expenditure programs. Analysts are also attune to the signals from the market and when stock prices fall they typically do two things – they cut earnings forecasts for BOTH the short-term (which is rational) and long-term (which is not so rational), and second, they begin to adopt extremely conservative valuation methodologies. Finally, consumers are also affected by falling asset prices as the combined effect of smaller portfolios and gloomy headlines creates a bunker mentality amongst private individuals with the result being sharp curtailment of consumption. All of these effects come into play in a bear market and become hugely exaggerated in the face of a massive, global wide margin call. The good news for investors is that once the margin call selling has been exhausted, the reverse psychology will at some point kick in and this is what we expect to occur as 2009 moves forward. Under such a scenario, sellers eventually become exhausted, companies begin to slowly invest in the future, analysts become more bullish and individual consumption patterns begin to normalise. This is what we expect will happen sometime in 2009.
It has been almost 14 years since we wrote that newsletter. 2009 would go on to be our best year for investor returns and the 5-year return would prove to be spectacular. We expect our comments from this newsletter to get a similar amount of reproach, but as our analysis below implies, we truly believe we’re in an extremely similar environment.
History Doesn’t Repeat Itself, but it Rhymes
We are using the great financial crisis of 2008/2009 as our reference point for this analysis. Hindsight is 20/20, so travelling back in time to that environment, now knowing how great of a time it was to invest in high quality companies that sold off during the investor panic, is extremely insightful.
To start, we went back to our models and saved research from 2008/2009. We compiled a list of the stocks we owned at the time or were soon to own when the market turned. We calculated the company’s market capitalizations using their individual lowest stock price during the financial crisis.
2008/2009 Company Market Caps
Next, we took our models, published research and with help from Bloomberg, included Price to Cash Earnings Multiple, Future Revenue Growth and Future Cash Margins3.
2008/2009 Company Fundamentals
|
Company |
2008/2009 Low Market Cap |
2009 Cash PE |
2009 Revenue Growth |
2009 Margins |
|
Boyd Group |
$ 25 |
2.5 |
7% |
4% |
|
Colliers |
$ 179 |
3.2 |
8% |
3% |
|
Direct Cash |
$ 81 |
3.2 |
10% |
26% |
|
Paladin Labs |
$ 167 |
5.0 |
32% |
30% |
|
Enghouse |
$ 89 |
6.3 |
48% |
18% |
|
Constellation |
$ 474 |
6.7 |
33% |
16% |
|
Alimentation Couche-Tard |
$ 1,744 |
6.9 |
3% |
2% |
|
MTY Food |
$ 117 |
7.7 |
51% |
29% |
|
TMX Group |
$ 1,659 |
7.8 |
5% |
38% |
|
Open Text |
$ 1,449 |
10.5 |
8% |
18% |
|
Average |
$ 598 |
6.0 |
20% |
18% |
In order to come to a relative score, something we can compare across the entire stock universe, we add revenue growth and cash earnings margin to get a “growth” metric3. We then divide this growth metric against the stock’s cash earnings multiple to get a Price to Growth Score3. In essence, this refers to how much growth you are getting per unit of cost. The higher the score the better.
2008/2009 Company Price to Growth
|
Company |
2008/2009 Low Market Cap |
2009 Cash PE |
2009 Revenue Growth |
2009 Margins |
Price to Growth 2009 |
|
Paladin Labs |
$ 167 |
5.0 |
32% |
30% |
12.4 |
|
Direct Cash |
$ 81 |
3.2 |
10% |
26% |
11.1 |
|
Enghouse |
$ 89 |
6.3 |
48% |
18% |
10.4 |
|
MTY Food |
$ 117 |
7.7 |
51% |
29% |
10.3 |
|
Constellation |
$ 474 |
6.7 |
33% |
16% |
7.3 |
|
TMX Group |
$ 1,659 |
7.8 |
5% |
38% |
5.5 |
|
Boyd Group |
$ 25 |
2.5 |
7% |
4% |
4.4 |
|
Colliers |
$ 179 |
3.2 |
8% |
3% |
3.6 |
|
Open Text |
$ 1,449 |
10.5 |
8% |
18% |
2.5 |
|
Alimentation Couche-Tard |
$ 1,744 |
6.9 |
3% |
2% |
0.6 |
|
Average |
$ 598 |
6.0 |
20% |
18% |
6.8 |
The final step is where the hindsight comes in and we look into the future returns of these stocks. We calculate the 1-year, 2-year, and 5-year returns for each stock starting from when they bottomed in 2008/2009. As you can see, when you combine extremely cheap valuations with sustained growth and profitability, the returns can be staggering.
|
2008/2009 Financial Crisis Case Study |
||||||||
|
Company |
2008/2009 Low Market Cap |
2009 Cash PE |
2009 Revenue |
2009 Margins |
Price to Growth 2009 |
Return 1 Year |
Return 2 |
Return 5 |
|
Boyd Group |
$ 25 |
2.5 |
7% |
4% |
4.4 |
108% |
222% |
1344% |
|
Enghouse |
$ 89 |
6.3 |
48% |
18% |
10.4 |
108% |
150% |
749% |
|
Paladin Labs |
$ 167 |
5.0 |
32% |
30% |
12.4 |
100% |
208% |
606% |
|
Alimentation Couche-Tard |
$ 1,744 |
6.9 |
3% |
2% |
0.6 |
53% |
97% |
515% |
|
Constellation |
$ 474 |
6.7 |
33% |
16% |
7.3 |
31% |
85% |
434% |
|
Colliers |
$ 179 |
3.2 |
8% |
3% |
3.6 |
110% |
226% |
433% |
|
MTY Food |
$ 117 |
7.7 |
51% |
29% |
10.3 |
52% |
110% |
412% |
|
Direct Cash |
$ 81 |
3.2 |
10% |
26% |
11.1 |
125% |
254% |
194% |
|
TMX Group |
$ 1,659 |
7.8 |
5% |
38% |
5.5 |
32% |
56% |
136% |
|
Open Text |
$ 1,449 |
10.5 |
8% |
18% |
2.5 |
38% |
51% |
111% |
|
Average |
$ 598 |
6.0 |
20% |
18% |
6.8 |
76% |
146% |
493% |
Where this becomes interesting is when we do all of the above analysis for the environment we’re currently in. In the table below we combine steps 1, 2, & 3 to show how the stocks we’re currently focused on compare to the investment landscape from the great financial crisis.
|
Current DKAM Company Fundamentals |
|||||
|
Company |
2022 Low Market Cap |
2023 Cash PE |
2023 Revenue Growth |
2023 Margins |
Alimentation Couche-Tard |
|
Sangoma* (SANG) |
$ 184 |
2.3 |
23% |
18% |
17.6 |
|
VerticalScope (FORA:CA) |
$ 127 |
2.5 |
27% |
34% |
24.8 |
|
Dye & Durham* (OTCPK:DYNDF) |
$ 814 |
3.4 |
14% |
41% |
16.1 |
|
Converge Technology (OTCQX:CTSDF) |
$ 877 |
4.0 |
24% |
7% |
7.7 |
|
Propel (OTC:PROM) |
$ 213 |
5.3 |
53% |
11% |
12.2 |
|
GoEasy (GSY:CA) |
$ 1,524 |
6.0 |
19% |
21% |
6.7 |
|
RediShred (KUT:CA) |
$ 60 |
6.5 |
15% |
15% |
4.6 |
|
Givex (GIVX:CA) |
$ 47 |
6.5 |
20% |
9% |
4.5 |
| Nuvei (NVEI:CA) |
$ 5,070 |
9.8 |
32% |
34% |
6.7 |
|
VitalHub ( |
$ 97 |
10.2 |
24% |
19% |
4.2 |
|
Average |
$ 901 |
5.6 |
25% |
21% |
10.5 |
| *Adjusted for fiscal year-end |
Using the lows for the stocks above, you can see why we believe we’re in an even more attractive investment situation now then back then. Stocks look cheaper, have slightly higher growth rates, and slightly higher cash earnings margins. This equates to an average Price to Growth Score of 10.5 now versus 6.8 in 2008/20093.
2008/2009 Financial Crisis Case Study
|
Company |
2008/2009 Low Market Cap |
2009 Cash PE |
2009 Revenue Growth |
2009 Margins |
Price to Growth 2009 |
Return 1 Year |
Return 2 Years |
Return 5 Years |
|
Average |
$ 598 |
6.0 |
20% |
18% |
6.8 |
76% |
146% |
493% |
Current Example DKAM Company Fundamentals
|
Company |
2022 Low Market Cap |
2023 Cash PE |
2023 Revenue Growth |
2023 Margins |
Price to Growth |
|
Average |
$ 901 |
5.6 |
25% |
21% |
10.5 |
We think it is fairly logical to assume even greater returns than what was seen after the 2008/2009 bottom because the fundamentals are that much more attractive. Even if growth rates or margins end up being slightly lower in 2023 than what is projected, there is such a large margin of error that future returns should be extremely strong.
To reinforce the point, we provide some of the one-year analyst targets on these companies. As mentioned in the 2009 excerpt, Analysts are also attune to the signals from the market and when stock prices fall they typically do two things – they cut earnings forecasts for BOTH the short-term (which is rational) and long-term (which is not so rational), and second, they begin to adopt extremely conservative valuation methodologies.
Keeping this in mind, using Bloomberg one year analyst consensus ratings, Converge has 98% upside, VitalHub has 98% upside, Vertical Scope has 145% upside, Sangoma has 176% upside, and analyst upside for Givex is 553%. Even more to the point of how negative sentiment is but how fundamentals are intact, BMO analysts usually provide a downside scenario and upside scenario for a stock. For Converge specifically, they have a -6% downside and a +135% upside. We would take that trade-off any day and we think the 5-year forward returns are even greater and one-sided.
SSC Security (OTC:SECU)
We travelled to Regina, Saskatchewan in October to meet with the management team of SSC Security at their head office. SSC provides in-person security personnel for places like airports and shopping malls plus cross-sells higher margin cyber security solutions. They recently completed the purchase of a competitor that now gives them national coverage and the ability to win much larger contracts.
The company is run by a proven management team with significant insider ownership who have started, grown, and sold a previous security business. This company is a great example of the current environment we’re in because within a few quarters, once SSC winds down an unrelated agricultural segment, we believe they will have more cash on the balance sheet than the entire market cap of the company. They are currently buying back stock and paying a dividend that now yields 4%.
The fund now has a small starter position in the stock
Final Thoughts
“While we cannot state with any certainty that 2009 will be a better year for equity investors (although our instincts and most of the data we track tells us that this is so), we can say that we have never before in our investment careers been able to buy growth stocks as inexpensively as we can today.” – DKAM’s ROE Reporter January 2009
In 2009, large US banks were going bankrupt, the unemployment rate was close to 10%, consumers had roughly two times more leverage versus their net worth then versus now and the stock market collapsed. In essence, the entire financial system needed saving. Why is this necessary to relive? People are more pessimistic now than back then. Stocks look more attractive now then back then. We truly think the upside is more now than back then. Feel free to reach out questions or comments,
J.P. Donville & Jesse Gamble
FootnotesAll estimates, projections, and calculations have been generated by DKAM. This does not constitute advice for personal investments but rather a breakdown of how Donville Kent approaches stock analysis.
|
DISCLAIMERReaders are advised that the material herein should be used solely for informational purposes. Donville Kent Asset Management Inc. (DKAM) does not purport to tell or suggest which investment securities members or readers should buy or sell for themselves. Readers should always conduct their own research and due diligence and obtain professional advice before making any investment decision. DKAM will not be liable for any loss or damage caused by a reader’s reliance on information obtained in any of our newsletters, presentations, special reports, email correspondence, or on our website. Our readers are solely responsible for their own investment decisions. The information contained herein does not constitute a representation by the publisher or a solicitation for the purchase or sale of securities. Our opinions and analyses are based on sources believed to be reliable and are written in good faith, but no representation or warranty, expressed or implied, is made as to their accuracy or completeness. All information contained in our newsletters, presentations or on our website should be independently verified with the companies mentioned. The editor and publisher are not responsible for errors or omissions. Past performance does not guarantee future results. Unit value and investment returns will fluctuate and there is no assurance that a fund can maintain a specific net asset value. The fund is available to investors eligible to invest under a prospectus exemption, such as accredited investors. Prospective investors should rely solely on the Fund’s offering documentation, which outlines the risk factors in making a decision to invest. The S&P/TSX Composite Total Return Index, the S&P 500 Total Return Index, and the Russell 2000 Total Return Index (“the indexes”) are similar to the DKAM Capital Ideas Fund LP (“the fund”) in that all include publicly traded North American equities of various market capitalizations across several industries, and reflect both movements in the stock prices as well as reinvestment of dividend income. However, there are several differences between the fund and the indexes, as the fund can invest both long and short, can utilize leverage, can take concentrated positions in single equities, and may invest in companies that have smaller market capitalizations than those that are included in the indexes. In addition, the indexes do not include any fees or expenses whereas the fund data presented is net of all fees and expenses. The source of the indexes’ data is Bloomberg. DKAM receives no compensation of any kind from any companies that are mentioned in our newsletters or on our website. Any opinions expressed are subject to change without notice. The DKAM Capital Ideas Fund, employees, writers, and other related parties may hold positions in the securities that are discussed in our newsletters, presentations or on our website. |
Editor’s Note: The summary bullets for this article were chosen by Seeking Alpha editors.
Be the first to comment