

Brett_Hondow
Introduction
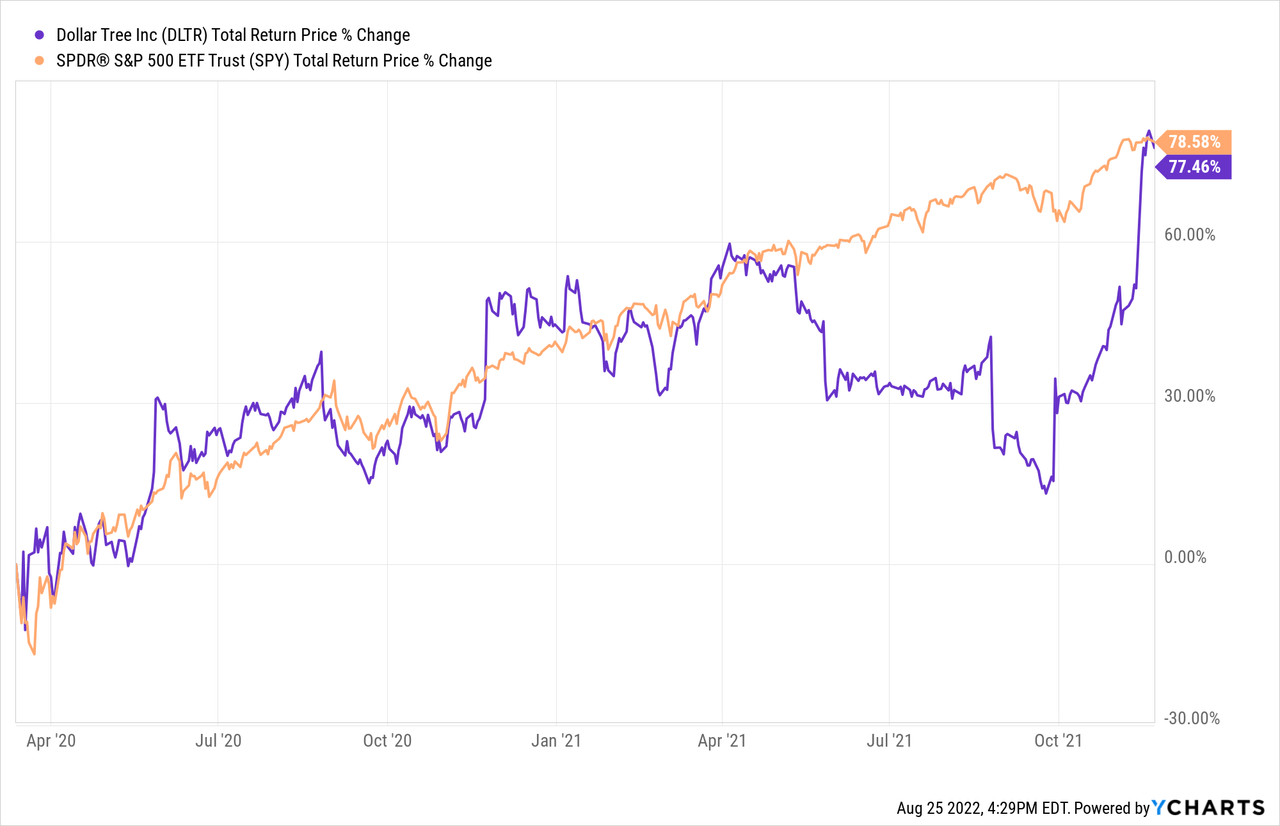
I always like to start my articles by reviewing any previous coverage I’ve had on a stock. In Dollar Tree’s (NASDAQ:DLTR) case, I have written two previous articles on the stock. The first article was written in July of 2020, a couple of months after I bought the stock on 3/13/20 titled “Stocks I Bought On The Dip: Dollar Tree“. The second article was written in January of 2022, a couple of months after I sold the stock on 11/22/21, titled “Dollar Tree: A Valuation Case Study“. In absolute terms this investment performed well for me, but in relative terms the returns were about the same as the S&P 500.
Back on January 16th of this year when my second article came out I performed a valuation analysis for the stock and ultimately rated it a “Hold”, but I think the details of the commentary I shared are worth taking a look at.
Let’s start by reviewing an old FAST Graph I shared in that article so we can see what analysts were expecting at the time.
FAST Graphs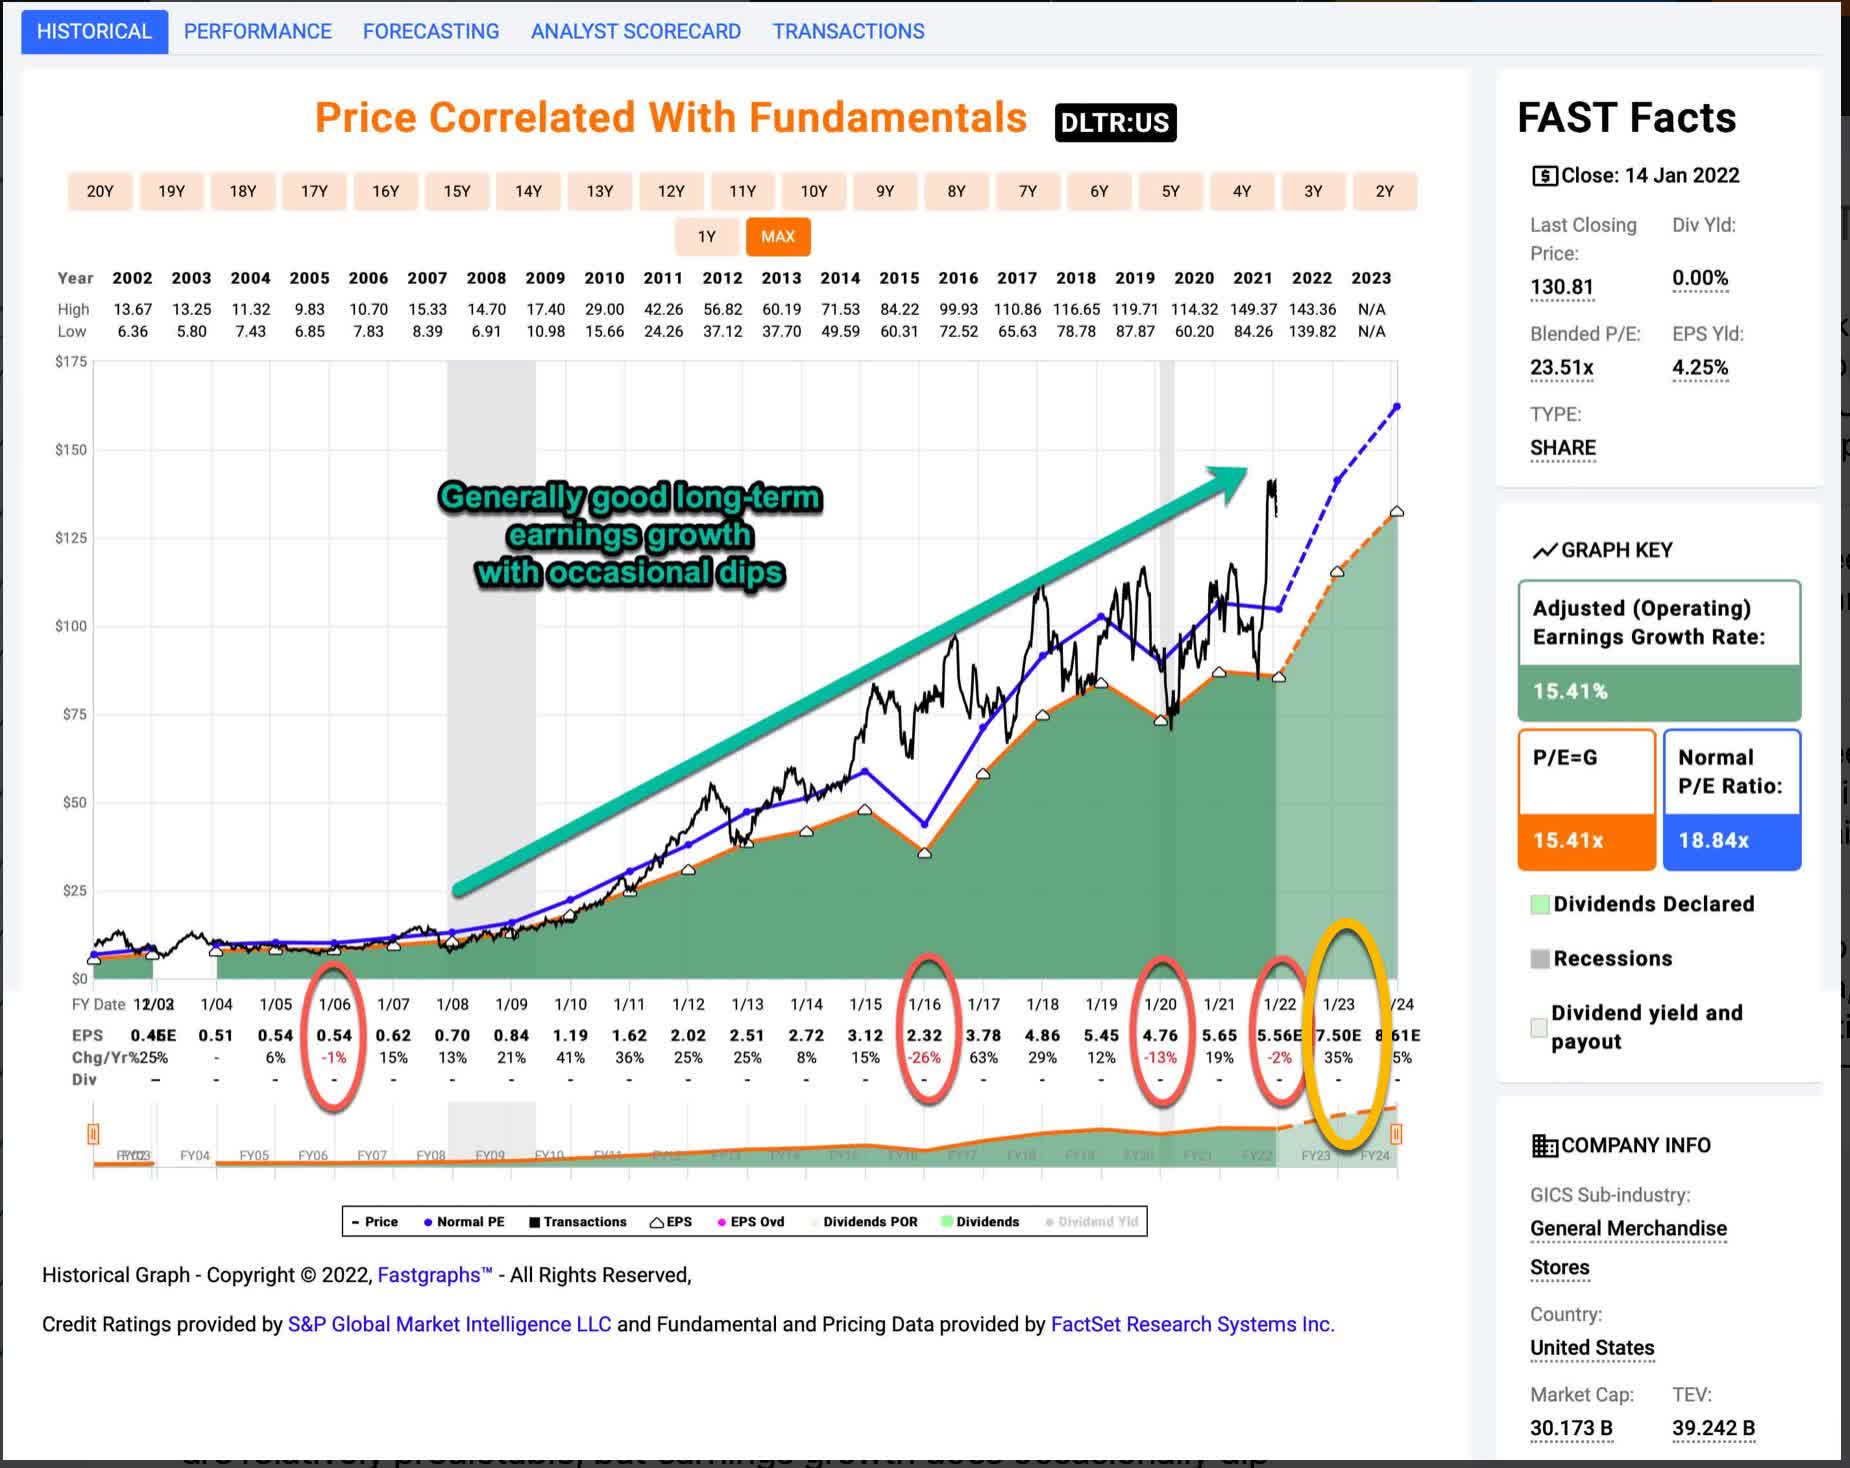
The only additional annotation I made to it was the gold circle I used to highlight what EPS analysts were expecting for 2023, which was about $7.50 per share. Here is what I had to say in my conclusion:
There are three additional considerations or thoughts of mine worth highlighting. The first consideration is that because Dollar Tree recently announced that they would be raising prices and that customers seemed willing to pay those higher prices, analysts have significantly raised their expectations for earnings growth next year to a whopping 35% year-over-year. While I never doubted Dollar Tree’s ability to be able to raise prices, I think that expectation is now priced into the stock. This means that if Dollar Tree meets those expectations the price is unlikely to rise much higher based on that, but if they disappoint, then the price could fall significantly. So, I don’t really like the risk/reward profile now that the price has spiked. The bigger risk is likely that they will disappoint expectations somehow.
Dollar Tree recently reported earnings that were roughly in line with expectations (which had risen up to $8.15 for 2023), but “The Chesapeake, Virginia-based company lowered earnings per share outlook to $7.10 – $7.40 from $7.80 to $8.20 previously.” This news caused the share price of the stock to drop more than 10%. This is exactly the type of risk I highlighted in my January article, and it was part of the reason I took profits in the stock when I did.
In this article, now that expectations have come down along with the price, I will share an updated valuation of the stock using the midpoint of their guidance for this year’s EPS of $7.25, and we’ll find out if the market has overreacted to the disappointing news or not.
My Valuation Method For Dollar Tree
The valuation method I use for Dollar Tree first checks to see how cyclical earnings have been historically. Once it is determined that earnings aren’t too cyclical, then I use a combination of earnings, earnings growth, and P/E mean reversion to estimate future returns based on previous earnings growth and sentiment patterns. I take those expectations and apply them 10 years into the future, and then convert the results into an expected CAGR percentage. If the expected return is really good, I will buy the stock, and if it’s really low, I will often sell the stock. In this article, I will take readers through each step of this process.
Importantly, once it is established that a business has a long history of relatively stable and predictable earnings growth, it doesn’t really matter to me what the business does. If it consistently makes more money over the course of each economic cycle, that’s what I care about — numbers over stories.
FAST Graphs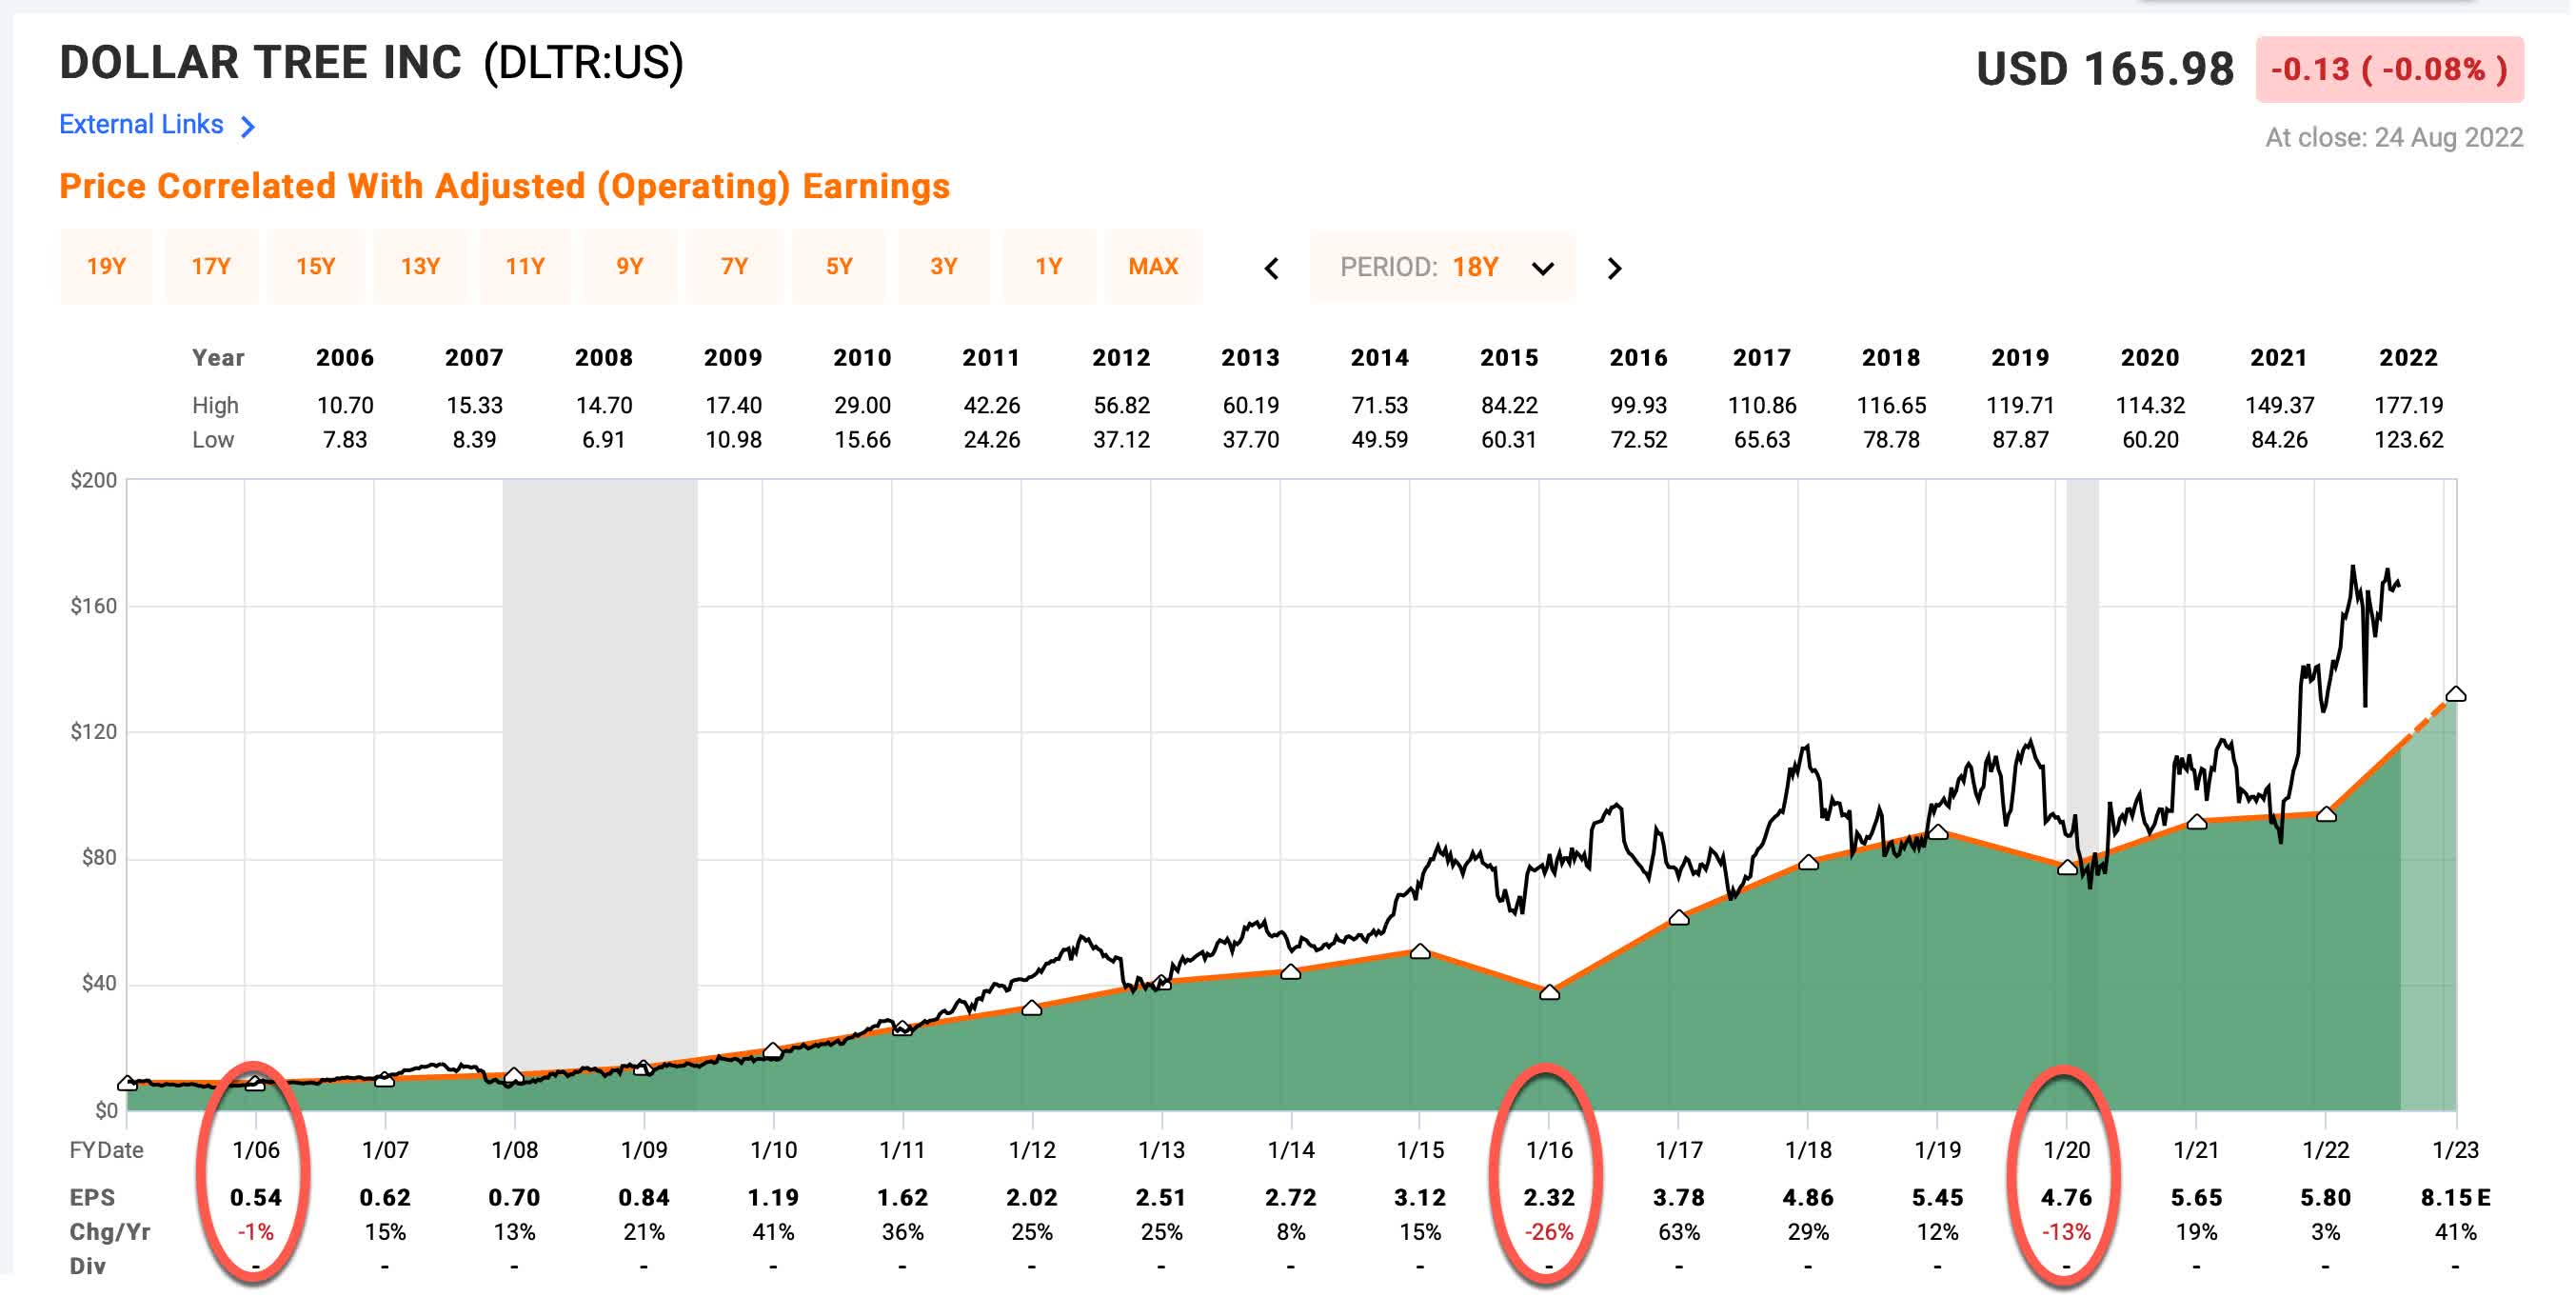
Since 2005, Dollar Tree has experienced three years when earnings growth was negative, the deepest being 2016 when EPS growth fell 26%. This is representative of a moderately cyclical stock and the declines aren’t so deep that I can’t perform an earnings based analysis for the stock, so I will proceed with my standard “Full-Cycle Earnings” analysis.
DLTR Stock – Market Sentiment Return Expectations
In order to estimate what sort of returns we might expect over the next 10 years, let’s begin by examining what return we could expect 10 years from now if the P/E multiple were to revert to its mean from the previous economic cycle. For this, I’m using a period that runs from 2014-2023.
FAST Graphs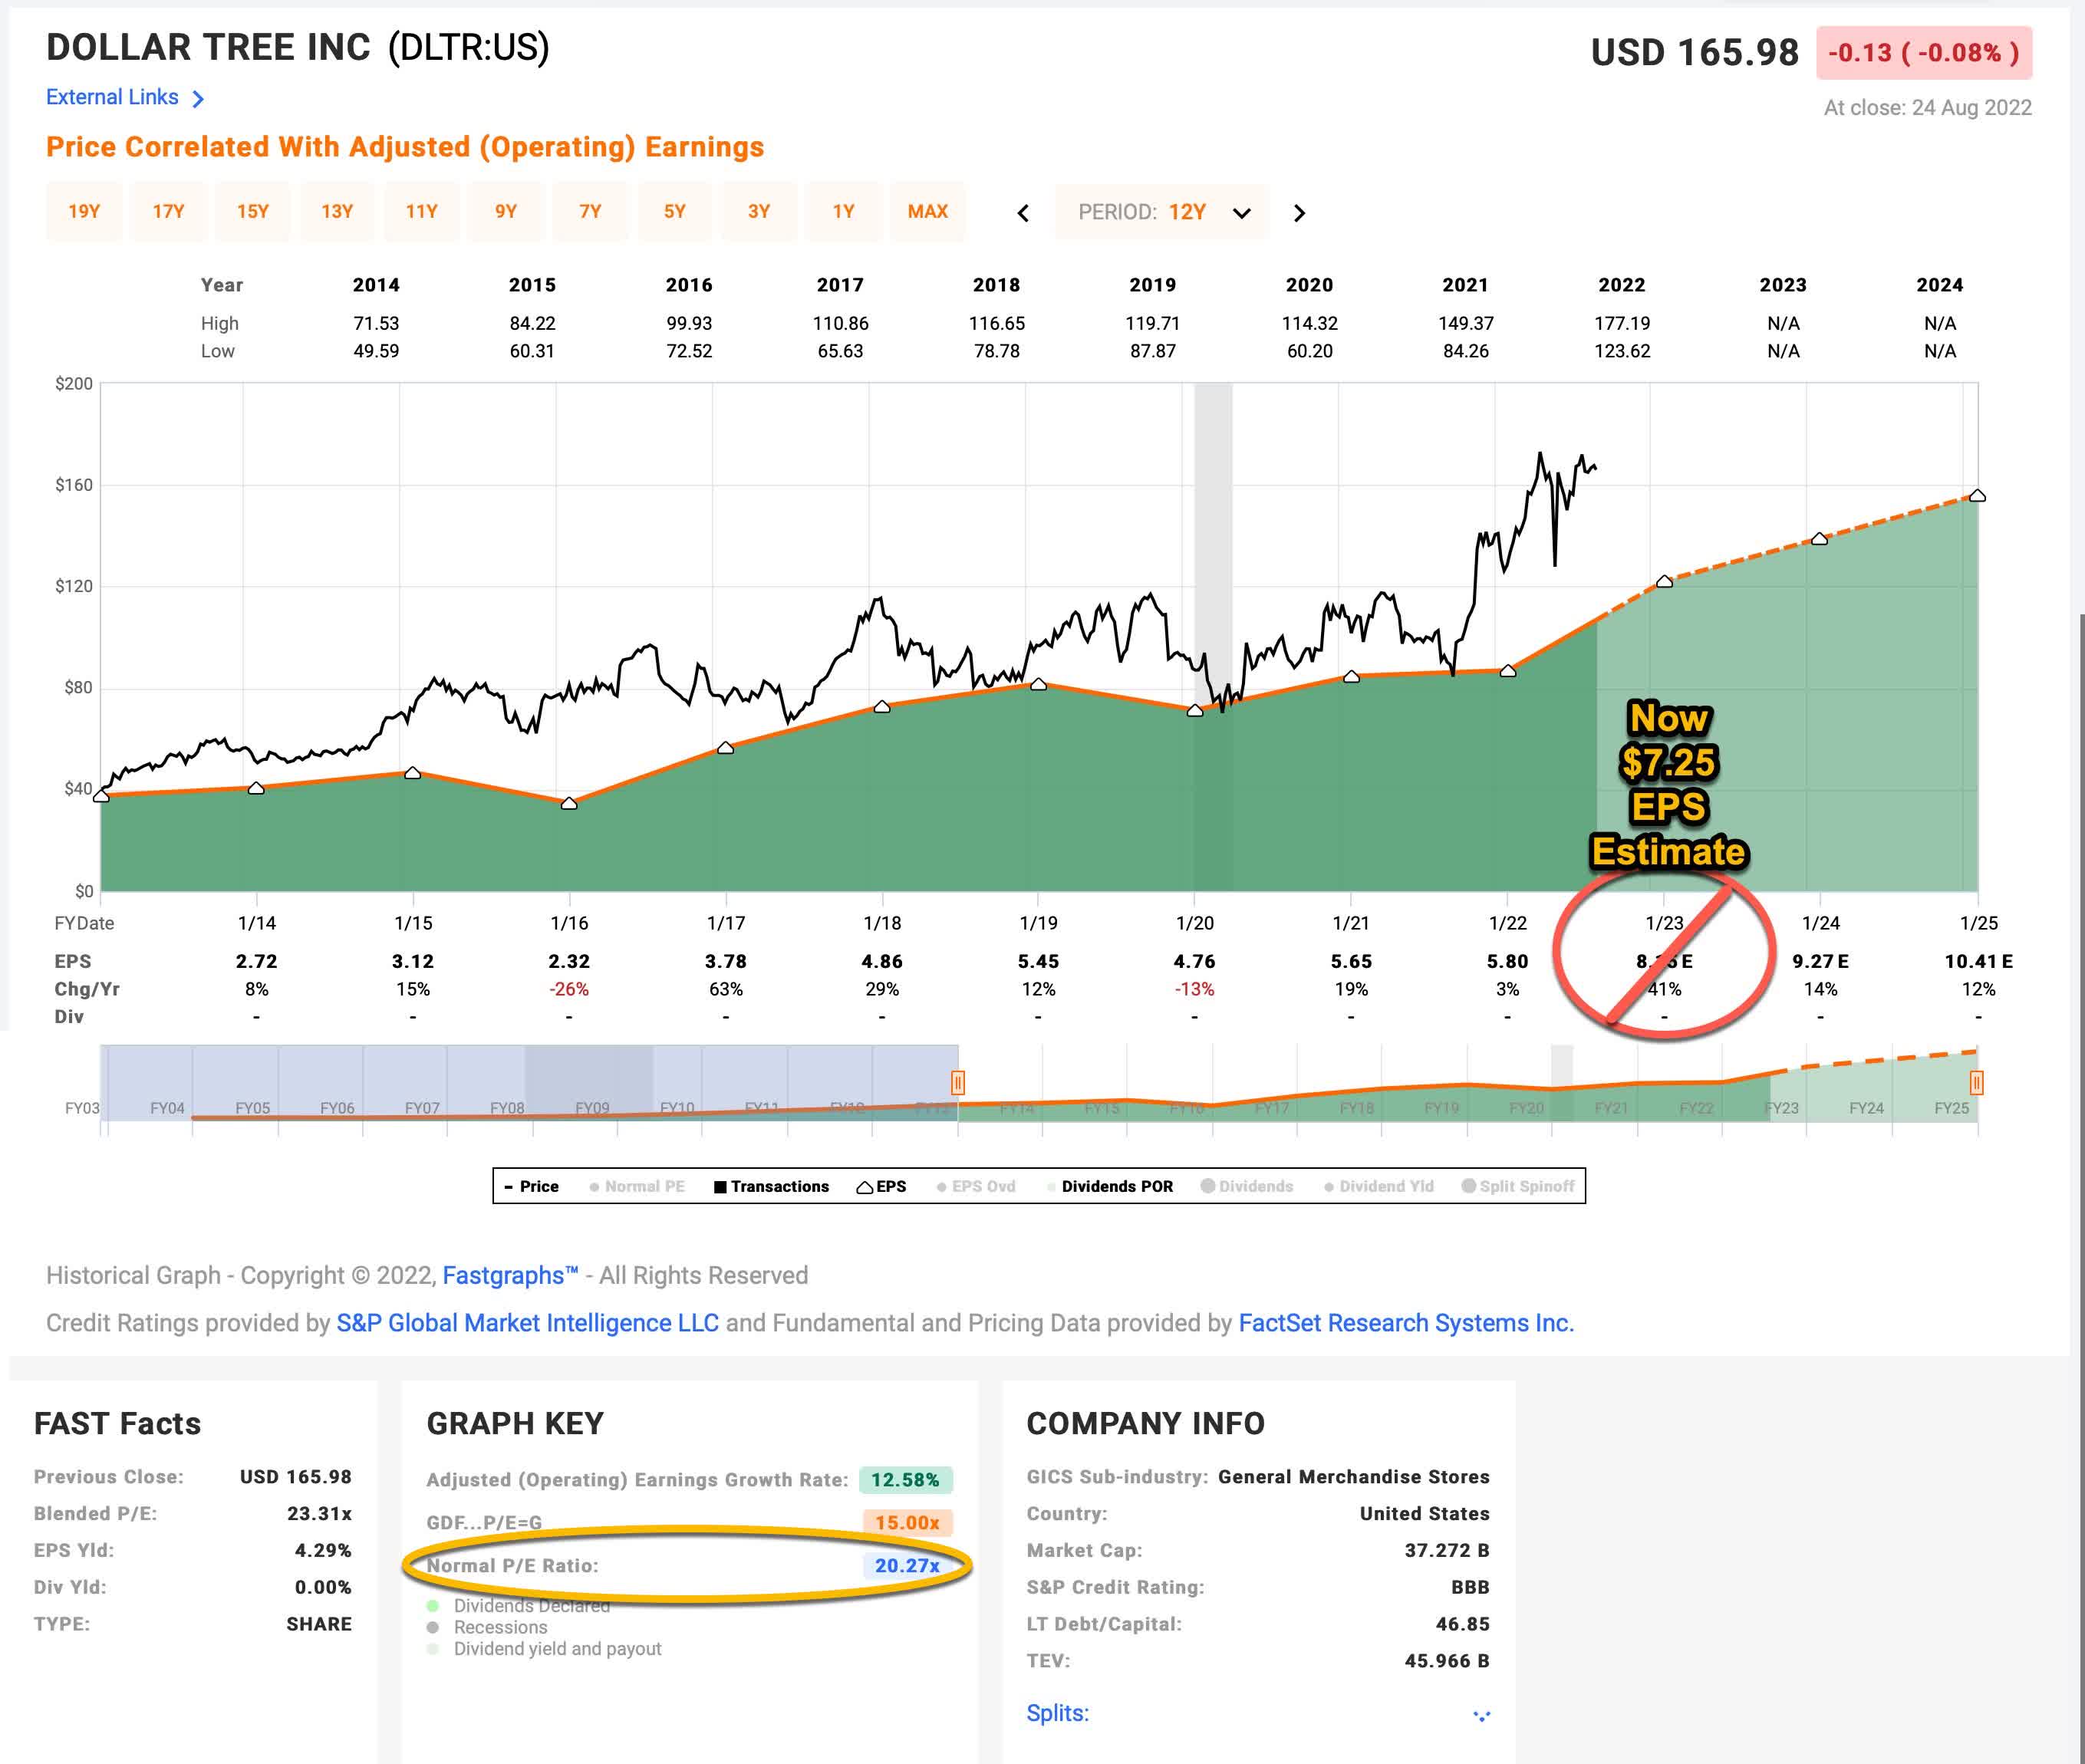
Dollar Tree’s average P/E from 2014 to the present has been about 20.27 (the blue number circled in gold near the bottom of the FAST Graph). Using 2023’s forward earnings estimates, which have been adjusted down to $7.25, DLTR has a current P/E of 20.55. If that 20.55 P/E were to revert to the average P/E of 20.27 over the course of the next 10 years and everything else was held the same, DLTR’s price would fall and it would produce a 10-Year CAGR of -0.14%. That’s the annual return we can expect from sentiment mean reversion if it takes 10 years to revert. If it takes less time to revert, the return would be lower.
Business Earnings Expectations
We previously examined what would happen if market sentiment reverted to the mean. This is entirely determined by the mood of the market and is quite often disconnected, or only loosely connected, to the performance of the actual business. In this section, we will examine the actual earnings of the business. The goal here is simple: We want to know how much money we would earn (expressed in the form of a CAGR %) over the course of 10 years if we bought the business at today’s prices and kept all of the earnings for ourselves.
There are two main components of this: the first is the earnings yield and the second is the rate at which the earnings can be expected to grow. Let’s start with the earnings yield (which is an inverted P/E ratio, so, the Earnings/Price ratio). The current earnings yield is about +4.87%. The way I like to think about this is, if I bought the company’s whole business right now for $100, I would earn $4.87 per year on my investment if earnings remained the same for the next 10 years.
The next step is to estimate the company’s earnings growth during this time period. I do that by figuring out at what rate earnings grew during the last cycle and applying that rate to the next 10 years. This involves calculating the historical EPS growth rate, taking into account each year’s EPS growth or decline, and then backing out any share buybacks that occurred over that time period (because reducing shares will increase the EPS due to fewer shares).
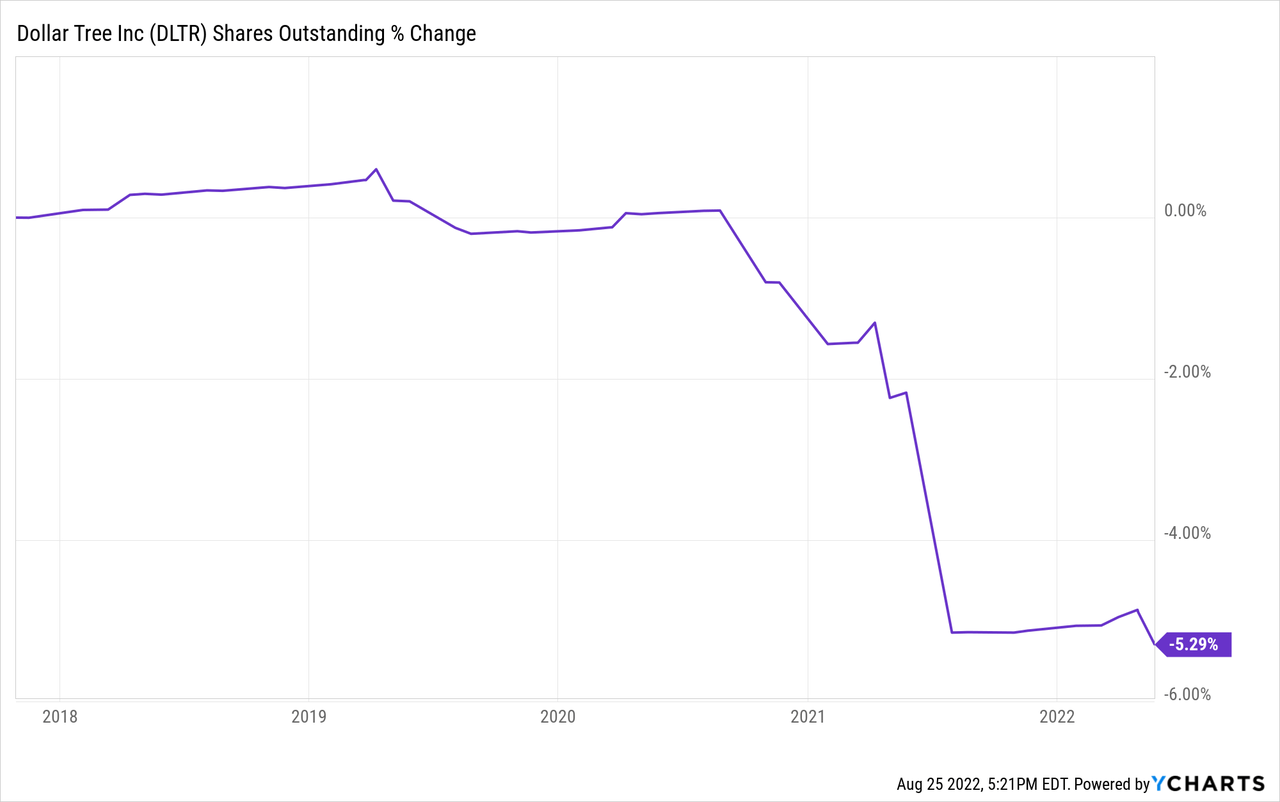
In Dollar Tree’s case, they had some M&A that distorted this number a little bit so I shortened my time frame to exclude the M&A. Recently they have bought back about 5% of the company via share repurchases. I will adjust for those buybacks and also make sure to include the two years during this time period where they had negative earnings growth. After doing that, I estimate an earnings growth rate for Dollar Tree of +10.61%, which is a respectable growth rate.
Next, I’ll apply that growth rate to current earnings, looking forward 10 years in order to get a final 10-year CAGR estimate. The way I think about this is, if I bought DLTR’s whole business for $100, it would pay me back $4.87 plus +10.61% growth the first year, and that amount would grow at +10.61% per year for 10 years after that. I want to know how much money I would have in total at the end of 10 years on my $100 investment, which I calculate to be about $188.32 (including the original $100). When I plug that growth into a CAGR calculator, that translates to a +6.53% 10-year CAGR estimate for the expected business earnings returns.
10-Year, Full-Cycle CAGR Estimate
Potential future returns can come from two main places: market sentiment returns or business earnings returns. If we assume that market sentiment reverts to the mean from the last cycle over the next 10 years for DLTR, it will produce a -0.14% CAGR. If the earnings yield and growth are similar to the last cycle, the company should produce somewhere around a +6.53% 10-year CAGR. If we put the two together, we get an expected 10-year, full-cycle CAGR of +6.39% at today’s price.
My Buy/Sell/Hold range for this category of stocks is: above a 12% CAGR is a Buy, below a 4% expected CAGR is a Sell, and in between 4% and 12% is a Hold. A +6.39% CAGR expectation makes Dollar Tree stock a “Hold” at today’s price. I would expect it to produce roughly similar returns as the S&P 500 index going forward.
Assuming today’s earnings trends stay intact, I would be a potential buyer of Dollar Tree stock if the price were to fall below $104.25 per share. And if I was a current owner of Dollar Tree stock (which I am not) I would be a seller if the price rose above $175 per share without a corresponding rise in earnings.
Conclusion
While the retail environment is ever-changing, the risk of disappointing the market’s fairly optimistic expectations was apparent at the beginning of this year. There are occasions when the market simply gets overly optimistic and overly pessimistic sometimes. Despite this, for all of 2022, Dollar Tree stock has traded within what I would consider a reasonable valuation range and has avoided getting crazily overvalued or undervalued. Now that at least some of the expectations for future earnings have come down for the stock, it will probably trade similarly to the S&P 500 index over the medium-term from here.
Be the first to comment