

U.S. DOLLAR ANALYSIS & TALKING POINTS
- PMI data surpasses estimates across the board.
- Will we see a complete descending triangle break?

Recommended by Warren Venketas
Get Your Free USD Forecast
USD FUNDAMENTAL BACKDROP
Trade Smarter – Sign up for the DailyFX Newsletter
Receive timely and compelling market commentary from the DailyFX team
Subscribe to Newsletter
The Dollar Index (DXY) reacted favorably to the latest bout of S&P Global PMI data for January. Although markets tend to prefer ISM data, the S&P report has managed to quell some of the recessionary talk that has been plaguing recent headlines. The services read (see economic calendar below) was of particular importance considering the U.S. economy is primarily services driven while the composite figure similarly slowed by the slowest rate since October 2022.
Inflation by way of input costs has extended its rise into 2023 (largely due to wage pressures) and may support the hawkish argument of the Federal Reserve to maintain a more aggressive stance than what we have seen thus far leading up to today’s economic release; even if they maintain the forecasted 25bps interest rate hike, guidance may change..
ECONOMIC CALENDAR
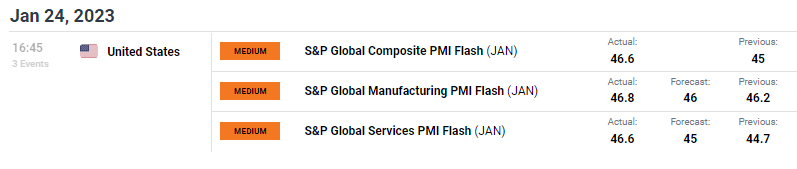
Source: DailyFX economic calendar
TECHNICAL ANALYSIS
Introduction to Technical Analysis
Candlestick Patterns
Recommended by Warren Venketas
U.S. DOLLAR INDEX DAILY CHART
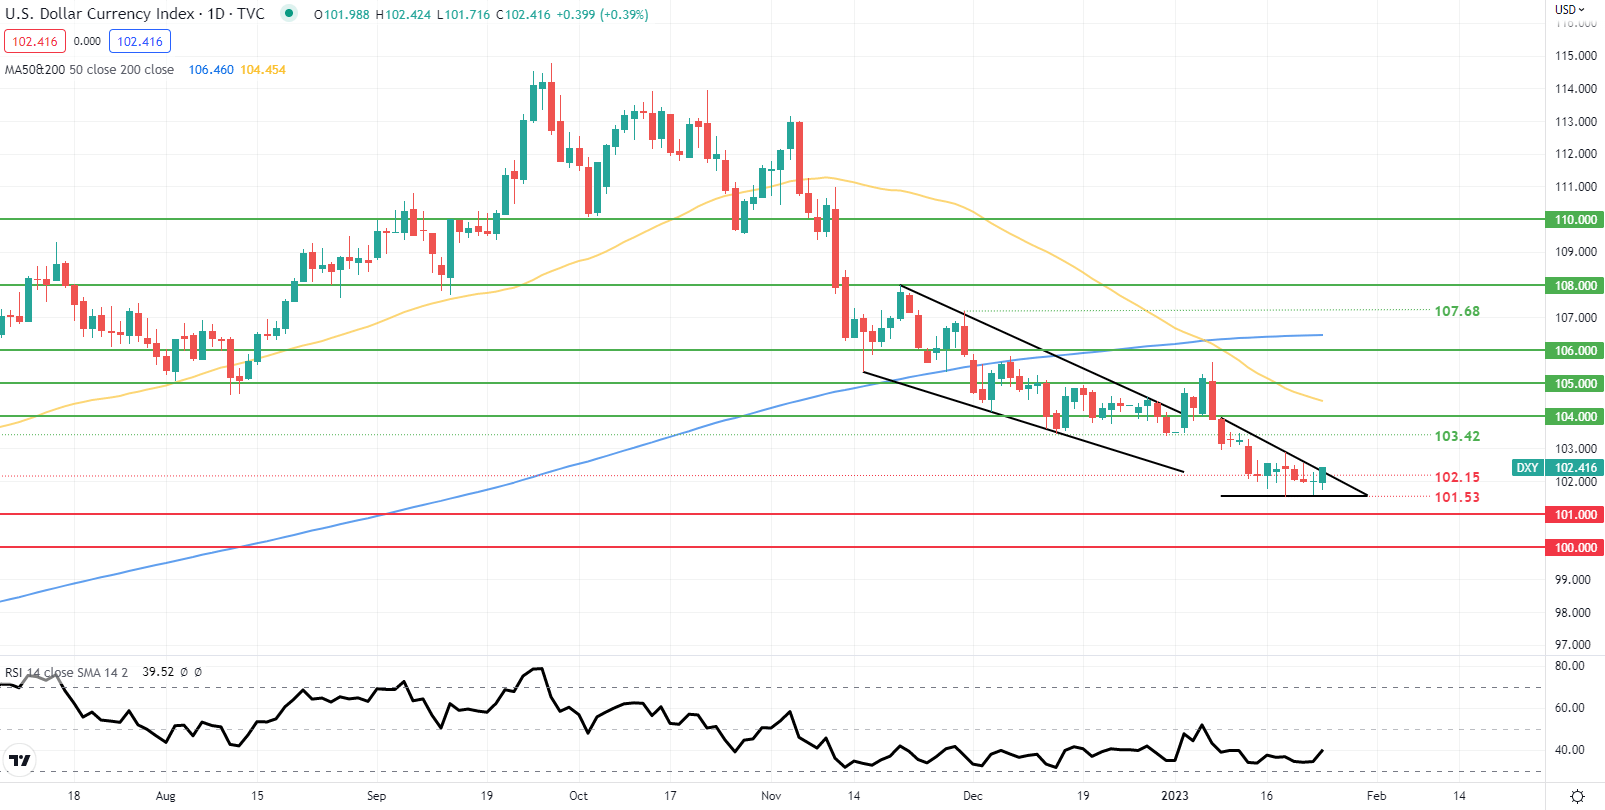
Chart prepared by Warren Venketas, IG
Daily DXY price action has now shown an upside break from the developing descending triangle pattern that generally points to impending downside but may be invalidated should today’s daily candle close above triangle resistance. The Relative Strength Index (RSI) may support such a dollar reprieve by hovering near oversold levels.
Resistance levels:
- 105.00
- 104.00
- 103.42
Support levels:
- 102.15
- 101.53
- 101.00
Contact and followWarrenon Twitter:@WVenketas
Be the first to comment