


Dzmitry Dzemidovich
Negative prognostications from the chorus of bears has grown louder and louder over the past three weeks, as the S&P 500 fell closer and closer to a meaningful support level. At the same time, Fed speak has carried a hawkish tone, but for the first time in a long time one Fed official offered a dovish ray of hope. While Fed Vice Chair Lael Brainard asserted yesterday that rates must increase from current levels and stay there for an extended period of time to tame inflation, she qualified the statement by adding that the rapidity of the tightening cycle could “create risks associated with overtightening.” Simply acknowledging that concern was enough to ignite a huge rally in stocks and bonds.
Finviz
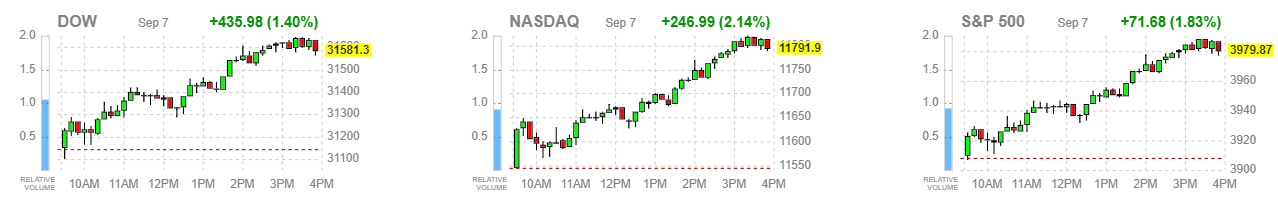
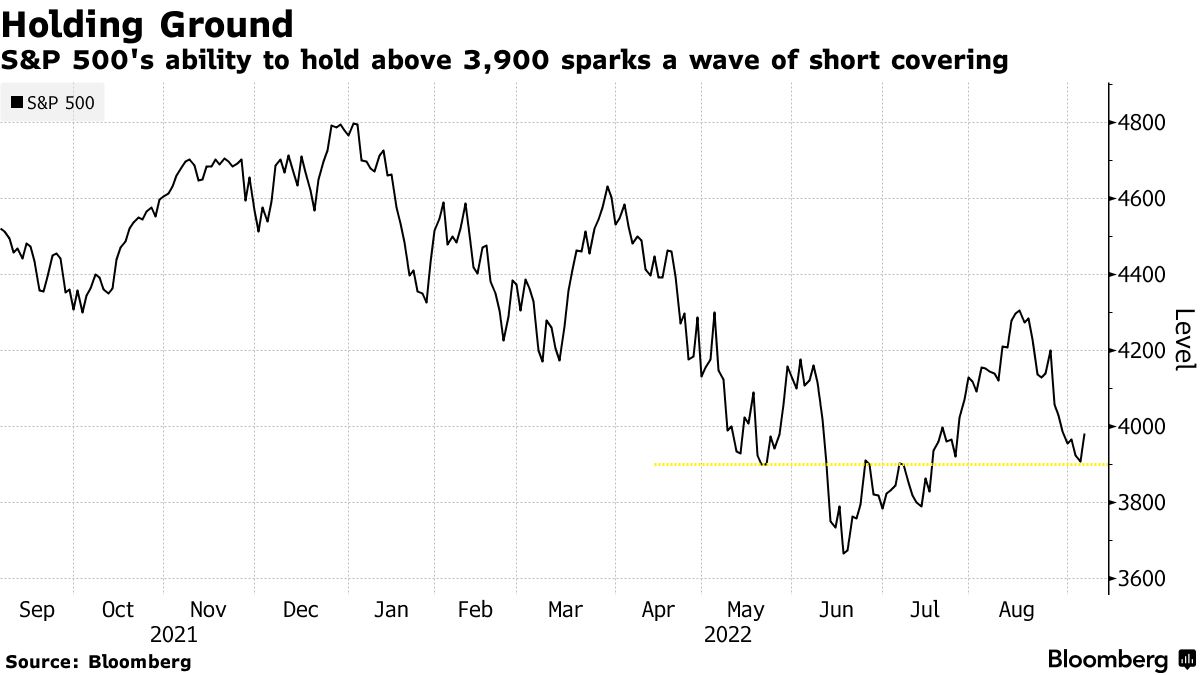
Contributing to yesterday’s rally was the release of the Federal Reserve’s Beige Book report on regional economic activity, which showed growth to be “unchanged” compared to the previous report in July, which described the economy as in a “modest expansion.” The slight downgrade in growth was interpreted as a positive, because a slower rate of growth should lower price increases and temper the size of future short-term rate hikes. Additionally, the report indicated a moderation of some price increases in nine of the 12 districts that cover the map. The outlook for growth from the businesses surveyed was weak overall, which means that tighter financial conditions are doing their job. The rally in the S&P 500 came at a key technical level of support at 3,900, which is the first step in successful development of a higher bottom.
Bloomberg
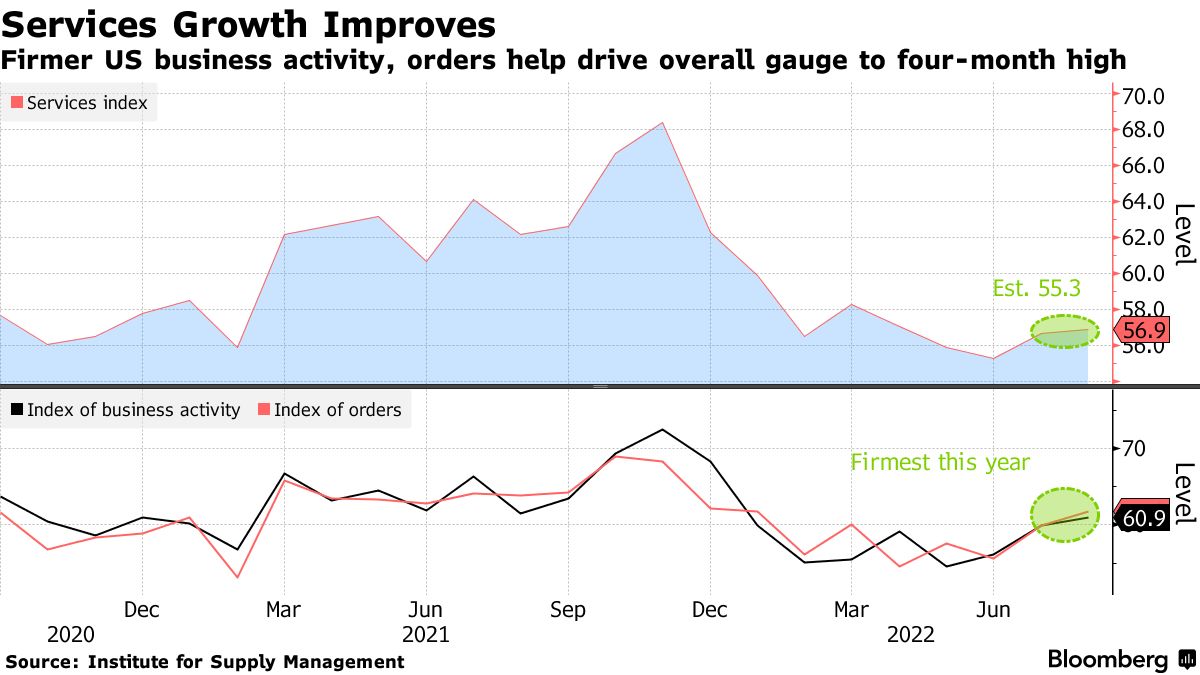
This report dovetailed nicely with the ISM Service index from the day before, as both show a below trend rate of economic growth combined with early indications that inflation is slowly rolling over. For those forecasting a soft landing, this is what we want to see.
Bloomberg
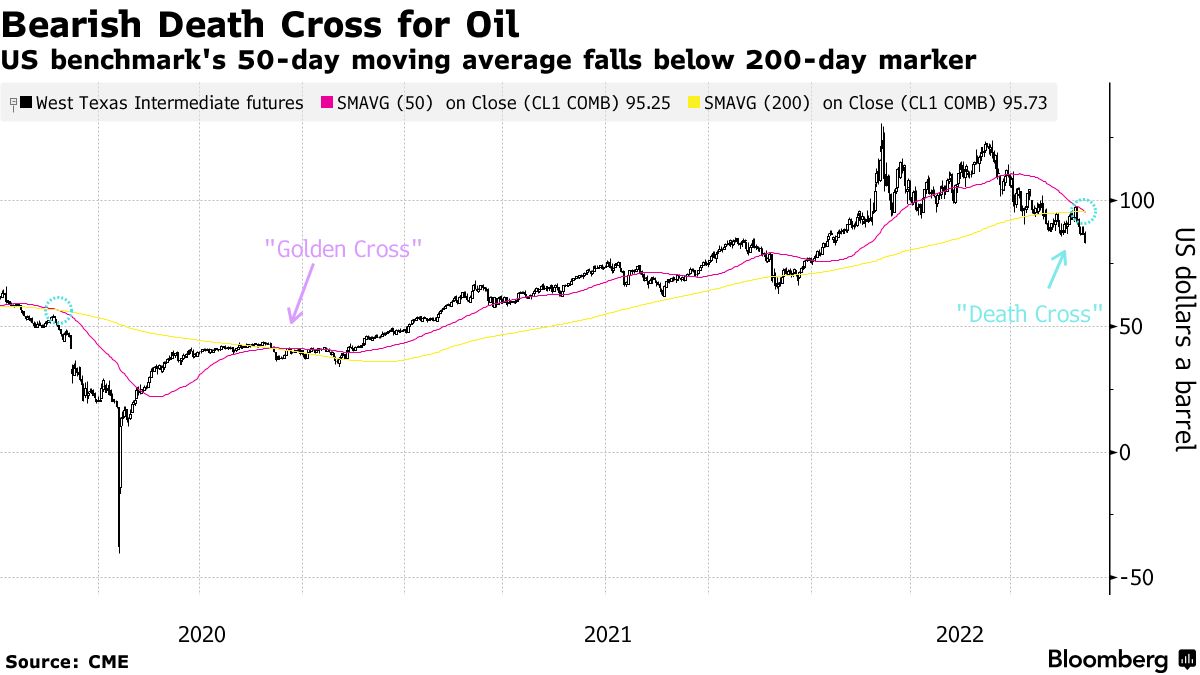
We also had the added bonus of a breakdown in the price of oil with WTI crude falling to its lowest level since January of this year at $81.95 on global growth concerns. This is a critical development in bringing down the rate of inflation over the coming 12 months.
Bloomberg
The combination of a slowing rate of economic growth with a lower rate of inflation should weigh on both short- and long-term interest rates, as it did yesterday. The 2-year Treasury yield, which reflects the market’s view of where the Fed’s policy rate will be in the year ahead, fell 5 basis points to 3.45%.
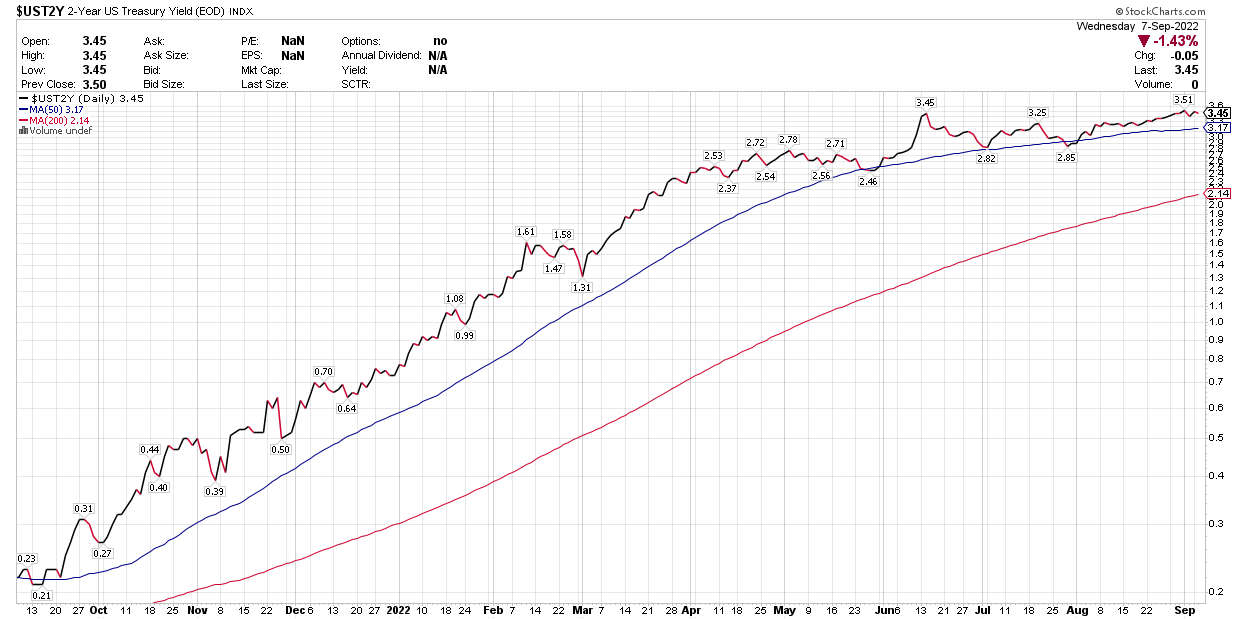
Stockcharts
The 10-year yield, which is more a reflection of the expected rate of economic growth and inflation, fell 6 basis points to 3.27%. The combination of lower yields across the curve is bullish for stock prices, as stocks are long-duration assets. Their market valuations are calculated based on profit expectations over the course of several years moving forward. If interest rates rise, future profits are discounted at a higher rate back to a present value. If interest rates fall, then profits are worth more. This relationship is the most pronounced for growth stocks with higher growth rate expectations.
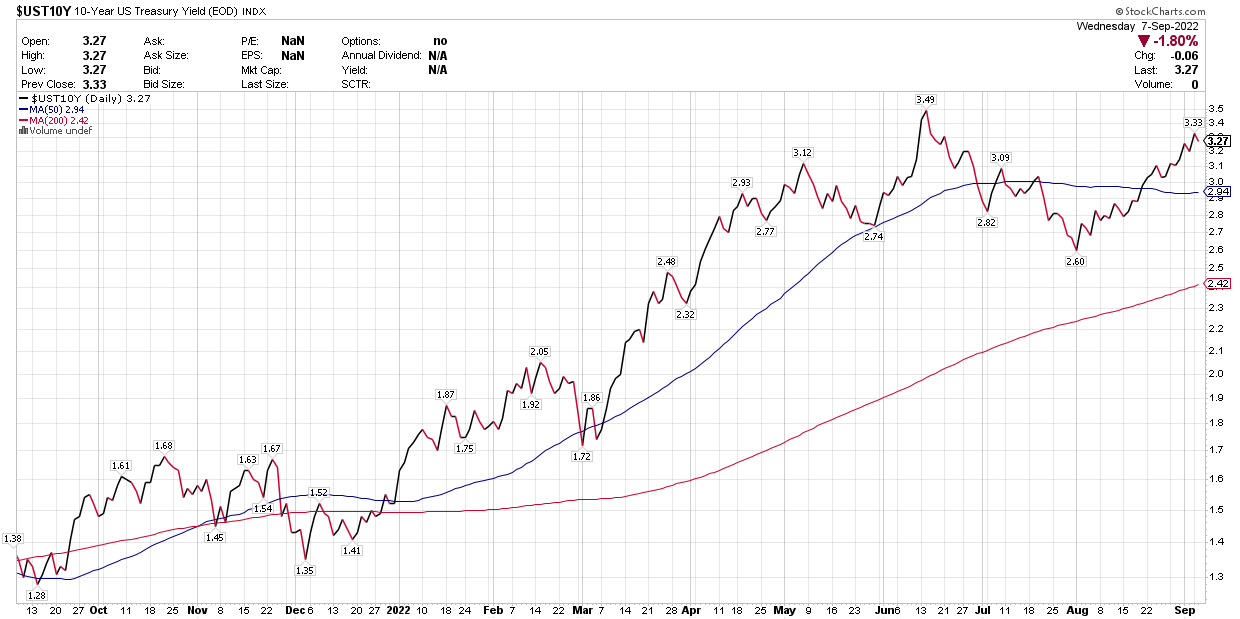
Stockcharts
When short-term rates rise above long-term rates, due to investors’ expectations for tighter monetary policy from the Fed, then the yield curve can invert, as it has today. This is the market’s way of saying that the Fed is expected to be overly restrictive in tightening financial conditions and runs the risk of causing a recession. The longer the current inversion lasts, the greater the chance that a recession occurs in the year ahead. The good news is that the curve has grown less inverted since early August, as the spread between 2- and 10-year yields has narrowed from 48 basis points to 18 basis points. If we can eliminate the inversion and see the curve steepen again, if will be a very bullish development.
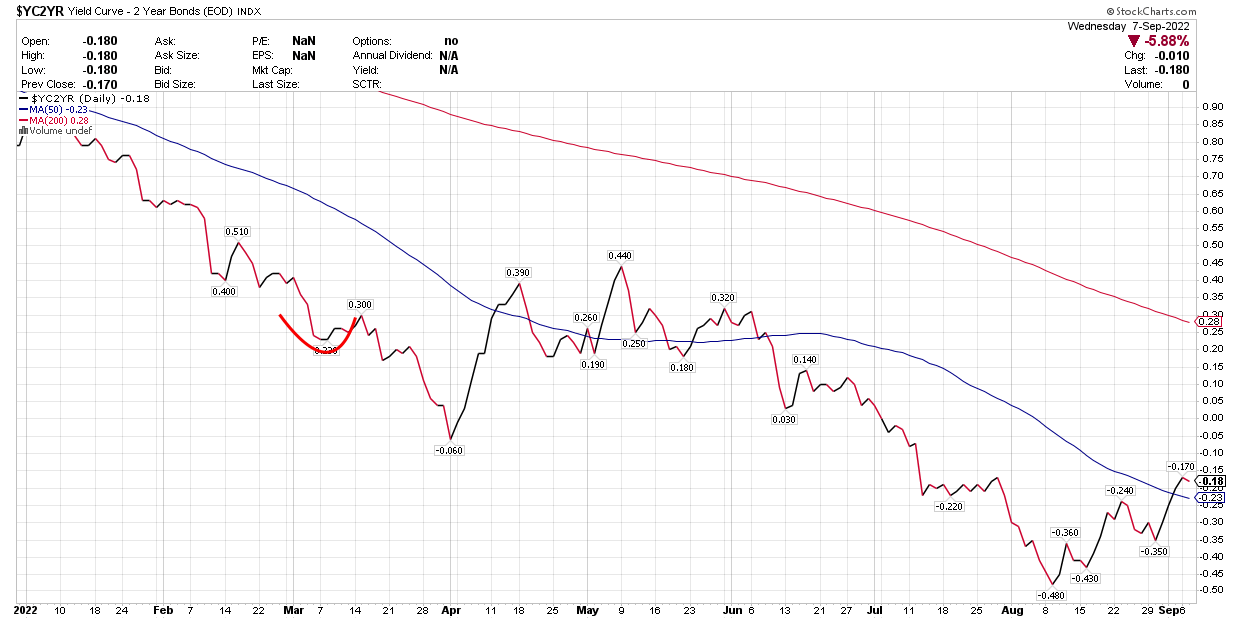
Stockcharts
In order to see the S&P 500 hold key support at 3,900 and resume its uptrend, we need to see interest rates halt their upward trajectory at current levels. This will also help keep a lid on further dollar appreciation, which weighs on the profits of multinational U.S. companies. A slower rate of economic growth and inflation combined with more balanced rhetoric from the Fed are all key, which is what the bulls need to see.
Be the first to comment