

Khaosai Wongnatthakan
Investment Thesis
The WisdomTree LargeCap Dividend ETF (NYSEARCA:DLN) has many attractive fundamental features, including an estimated 2.71% dividend yield, a 10.39% five-year dividend growth rate, and a 0.89 five-year beta that suggests some solid downside protection potential. It’s also among the most diversified and highest quality dividend funds I follow, making it an excellent selection for dividend growth investors wanting a single fund solution. While it’s not my favorite dividend ETF, as investors can do better managing a portfolio of high-quality funds instead, investors will not be disappointed with it over the long run. I look forward to taking you through DLN’s features alongside another popular alternative, the iShares Core Dividend Growth ETF (DGRO), in the following article.
DLN Overview
Strategy Discussion
On its website, WisdomTree lists three reasons to invest in DLN:
- Gain exposure to U.S. large-cap dividend-paying stocks
- Complement or replace large-cap value or dividend-oriented strategies
- Satisfy demand for growth potential and income focus
I would add an element of downside protection since DLN is consistently less volatile than the broader market. Dividends are a return of capital, as they reduce a company’s share price on the ex-dividend date. This return effectively takes some risk off the table, and companies that consistently pay and grow dividends are often highly profitable and can afford to do so.
To determine eligibility, WisdomTree first considers all U.S. dividend-paying securities that meet the following criteria:
- listed on a U.S. stock exchange
- incorporated and headquartered in the United States
- pays regular cash dividends on shares of its common stock
- a market capitalization of at least $100 million
- an average daily dollar volume of at least $100K in the last three months
- not a limited partnership, limited liability company, royalty trust, or BDC
Annual reconstitutions occur in December, and WisdomTree excludes securities that fall in the bottom 10% of a composite risk factor score that measures quality and momentum. Quality is determined by trends in return on equity, return on assets, gross profits over assets, and cash flow over assets. Meanwhile, momentum is a stock’s risk-adjusted total returns over the last six and twelve months.
These are the criteria for the WisdomTree Total Dividend ETF (DTD), and DLN is merely a cutout of the top 300 companies by market capitalization. Constituents are weighted based on total cash dividends expected to be paid over the next year, which gives preference to large companies like Apple (AAPL) that may have a low yield. This way, WisdomTree’s dividend ETFs capture at least some of the growth factor, which is crucial in upwards-trending markets.
Sector Exposures and Top Holdings
DLN is one of the best-diversified dividend ETFs you can own. Consider its investment in all eleven GICS sectors per the below table. Its largest exposure area is in Health Care (17.82%), followed by Consumer Staples (15.37%), Technology (14.01%), Financials (13.42%), and Energy (12.51%).
Morningstar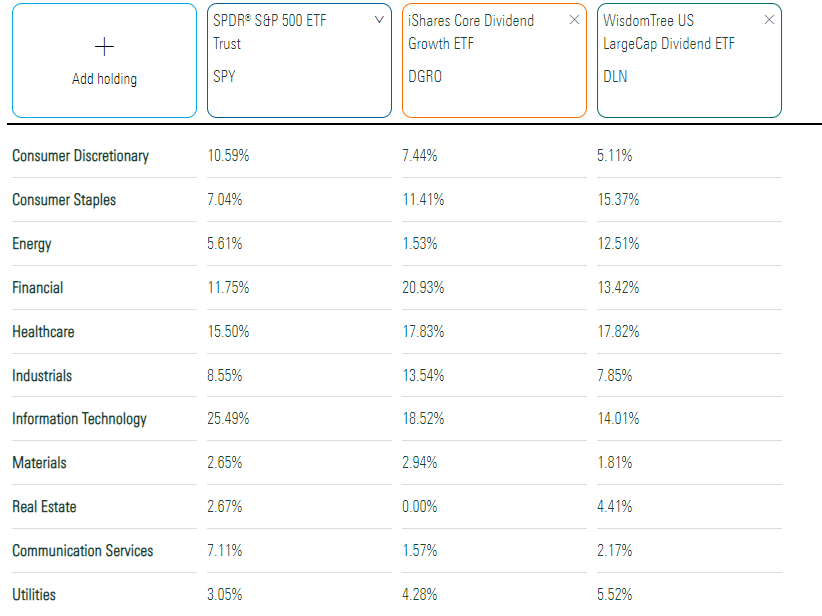
Given the SPDR S&P 500 ETF (SPY) has over 25% exposure to Technology stocks, I think DLN has the diversification edge. I also included DGRO because it’s well-diversified, as described in this article. DGRO shares similar dividend characteristics with DLN, including a 2.35% trailing yield that’s just 13 basis points less than DLN. DGRO’s lack of Real Estate exposure means you’ll probably need to round out your portfolio with another dividend ETF or a broad-based Real Estate fund like XLRE. With DLN, it’s optional.
DLN distinguishes itself from many dividend ETFs with a relatively high allocation to the Energy sector. Exxon Mobil (XOM) is its largest holding with a 5.00% weighting, while Chevron (CVX) is fifth on the list with a 3.01% weighting. Johnson & Johnson (JNJ) and Pfizer (PFE) cover most of the Pharmaceuticals exposure, and Philip Morris (PM) has snuck into the top ten list following an impressive quarter and raised guidance from management last month. The top ten list is below, totaling 29.46% of the portfolio.
WisdomTree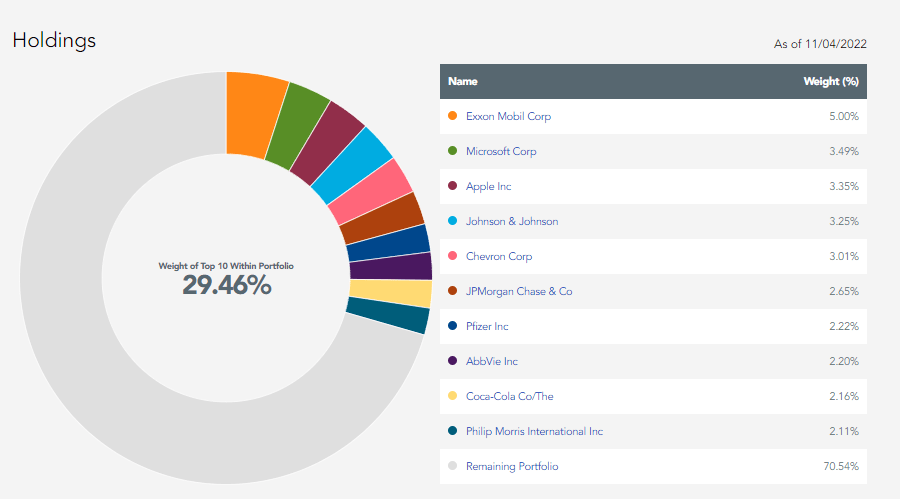
Performance
I last reviewed DLN in August when I compared it with DTD, determining that only a little separated the two from a performance and fundamentals perspective. As shown in the graph below, each has gained about 8.25% per year since its launch. DLN has the edge on risk-adjusted returns (Sharpe and Sortino Ratios) because of its lower annualized volatility (standard deviation). It makes sense because DTD includes some small- and mid-cap securities, which are often riskier. Risk-averse investors are almost always better off sticking with the highly profitable large-caps instead.
Portfolio Visualizer
While DLN and DTD’s past performance is virtually indistinguishable, they pale compared to DGRO. The performance period is constrained since DGRO didn’t launch until June 2014, but the graph below clearly identifies it as the superior pick. Investors have taken notice, too. DGRO has amassed $23.67 billion in assets under management in eight years, while DLN is at $3.63 billion over twice the time.
Portfolio Visualizer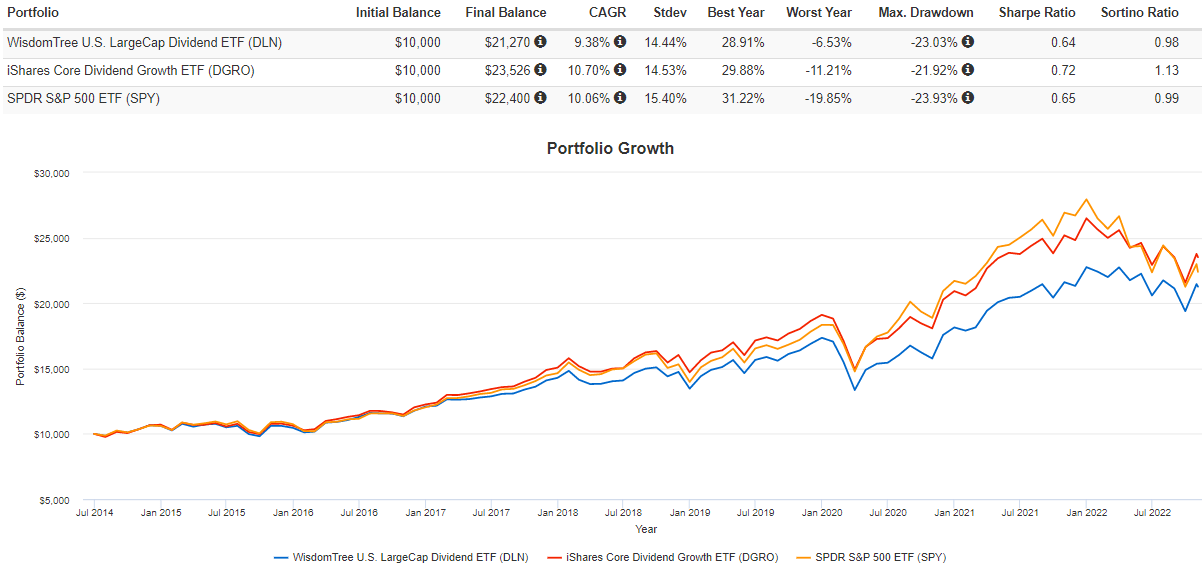
Dividends
DGRO has also been the better dividend growth ETF. On a $10,000 initial investment, a shareholder’s YTD portfolio income, with one quarterly payment remaining, would be $402 compared to $389 for DLN.
Portfolio Visualizer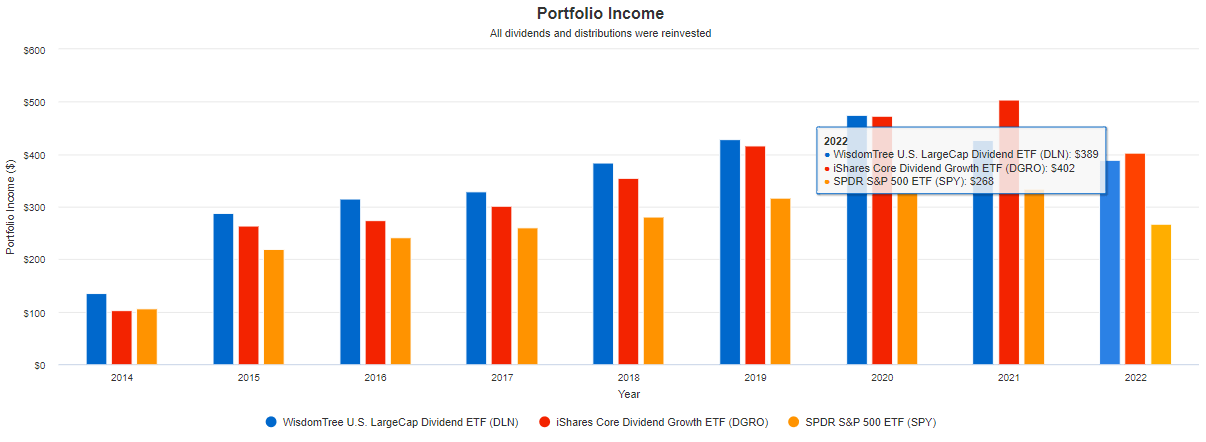
Seeking Alpha gives DLN a “B” Dividend Grade, boosted in part because of its longevity. Compared to DGRO, they both have C+ Dividend Yield Grades, but DGRO has an 11.40% five-year dividend growth rate compared to DLN’s 6.86%. This metric provides dividend growth investors with a good reason to ignore the more expensive DLN, especially considering how its 2.48% dividend yield doesn’t stand out.
Seeking Alpha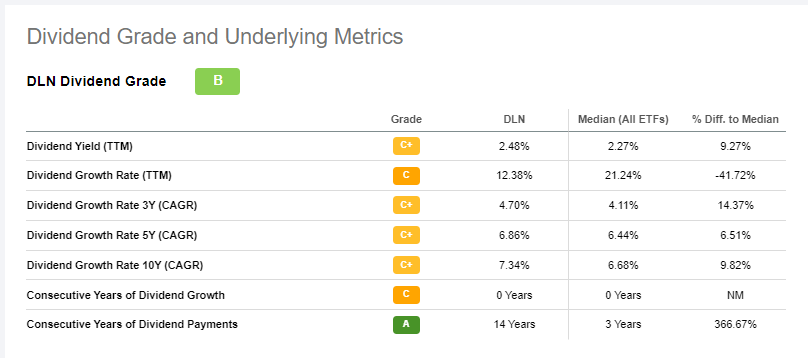
Fundamentals
While historical metrics suggest DLN is the inferior ETF, due diligence is more challenging than looking at the metrics a simple ETF screener can provide. It’s essential to examine the current holdings and what they offer today. To simplify the analysis, I’ve created the following summary of key fundamental metrics on concentration, volatility, growth, valuation, dividends, and profitability for DLN’s top 25 holdings. The bottom two rows are summary metrics for DLN and DGRO, allowing for an easy comparison.
The Sunday Investor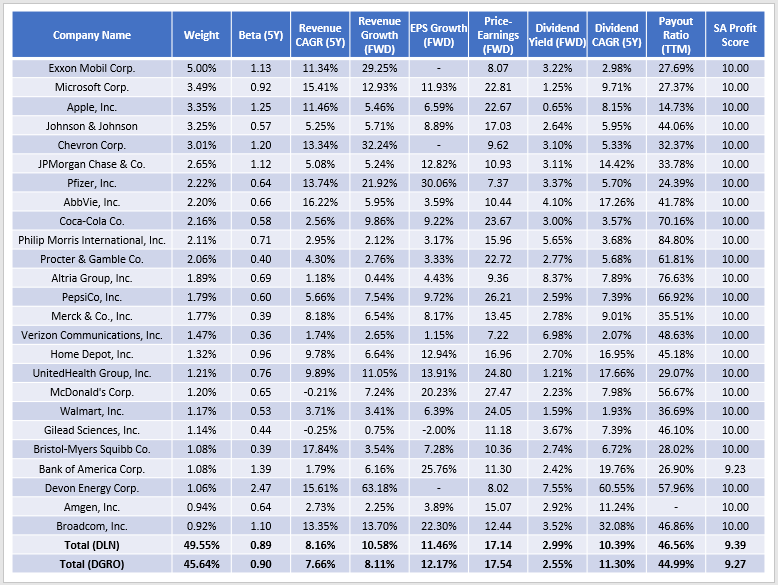
The first thing I want to highlight is DLN’s outstanding 9.39 Profit Score, which I’ve calculated using individual Seeking Alpha Profitability Grades and normalizing them on a ten-point scale. Scanning through my ETF database, which includes 63 other dividend ETFs, only a handful of others score better. One is the WisdomTree U.S. Dividend Growth ETF (DGRW), so the composite score mentioned before works. DGRO’s 9.27 score is still well above the 9.10 average for large-cap dividend ETFs, but DLN appears better for this challenging environment.
Second, DLN’s top 25 holdings total 49.55% of the fund, 4% more than DGRO. These figures contradict my earlier suggestion that DLN was the better-diversified fund. However, the percentage of assets in the top 25 industries is about the same for both funds (76.86% vs. 75.64%), and DLN isn’t overweight any sector, so I still think it has the diversification edge.
Third, neither ETF appears to have a significant volatility advantage. Their five-year betas are nearly identical (0.89 vs. 0.90) and par for the course for large-cap dividend ETFs. Still, DLN takes more of a “barbell” approach, meaning it’s a mixture of extremely low- and high-beta stocks. Examples from the table above are Johnson & Johnson and Devon Energy (DVN), which have betas of 0.57 and 2.47. You’ll also find a bit of that in DGRO, but less. Citigroup (C) is DGRO’s most volatile top 25 stock and has a 1.58 five-year beta.
Fourth, the dynamic between expected growth and valuation is what you’d expect. DLN has a lower estimated earnings per share growth rate (11.46% vs. 12.17%) and a lower forward price-earnings ratio (17.14 vs. 17.54) to compensate. DLN has a superior estimated sales growth rate (10.58% vs. 8.11%), but this figure may be inflated due to the Energy sector’s outliers. Of course, it could materialize, but I have little confidence in predictions concerning oil prices. Instead, the 12.51% exposure to the sector is reasonable, and DGRO’s lack of exposure is an issue its shareholders should look to solve should inflation remain a persistent problem.
Finally, DLN’s constituents currently yield a gross 2.99% or about 2.71% after fees. DGRO pays 2.55% or 2.47% after expenses, so DLN has the advantage on dividends. Furthermore, its 10.39% five-year dividend growth rate is nearly as good as DGRO’s 11.30%. Both ETFs have reasonable payout ratios of around 45%, so future dividend growth seems well-supported.
Investment Recommendation
DLN has many positive features at the moment, and I’m not bothered much by its historical underperformance relative to ETFs like DGRO because its current fundamentals look solid. It yields about 2.71% after fees, and due to its superior profitability and low payout ratio, its distributions have the potential to grow by 10% or more. Furthermore, I like that DLN is diversified across all sectors with sufficient exposure to Energy stocks, which will prove key should inflation remain elevated for longer.
For investors wanting a single ETF solution, DLN is a nice choice. However, I’m only rating it as a hold because I believe most investors are better off owning a portfolio of high-quality dividend funds. This approach will automatically improve diversification and allow each investor to select which factors matter most to them. To illustrate, here are the fundamental metrics for the Active Equity Model ETF Portfolio I created as part of the HCIB Marketplace.
The Sunday Investor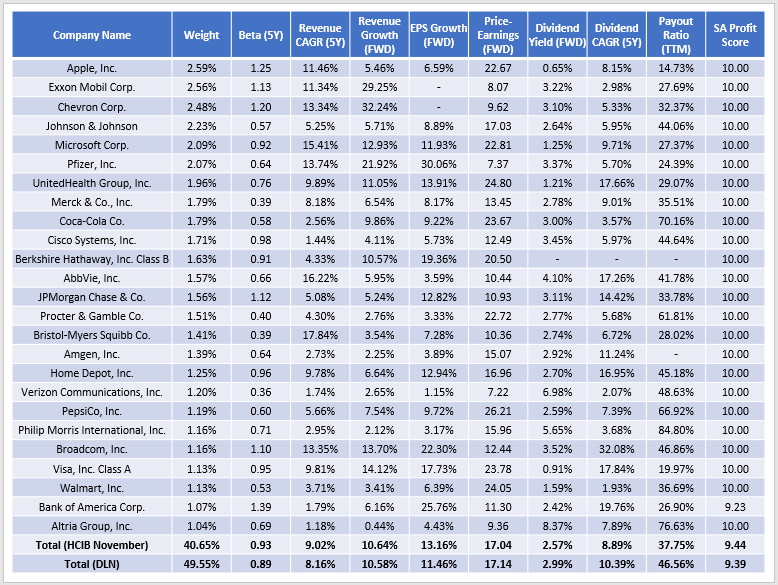
As shown, there’s just a 40.65% concentration in the top 25 holdings, the profit score is better at 9.44, and the portfolio has a superior estimated earnings growth rate of 13.16%. I like this strategy better, and although it’s not for everyone, I hope you can use this information to think about how to improve your own portfolio’s fundamentals. Thank you for reading, and as always, I hope to answer any questions you may have in the comments below.
Be the first to comment