

Chee Siong Teh
This dividend ETF article series aims at evaluating products regarding the relative past performance of their strategies and quality metrics of their current portfolios. Holdings and their weights change over time: reviews are updated when necessary.
DJD strategy and portfolio
The Invesco Dow Jones Industrial Average Dividend ETF (NYSEARCA:DJD) has been tracking the Dow Jones Industrial Average Yield Weighted Index since 12/16/2015. It has 27 holdings, a 12-month distribution yield of 3.07% and a cheap total expense ratio of 0.07%.
As described by Invesco in the prospectus,
the Underlying Index is calculated using a yield-weighted methodology that weights all dividend-paying constituents of the Dow Jones Industrial Average™ by their twelve-month dividend yield defined as a stock’s annual dividend (not including any special dividends) divided by its price. The Underlying Index is rebalanced semi-annually (…)
This is reminiscent of the Dogs of the Dow strategy, which consists in buying the ten companies with the highest dividend yields in the Dow Jones Index (DIA). The top 10 holdings of DJD (listed below) are the “Dogs” of the latest rebalancing day. They weigh 56.8% of asset value in aggregate. The fund is quite concentrated and exposed to risks related to the top names. It is similar for DIA, whose top 10 holdings have an aggregate weight of 55.3%.
|
Ticker |
Name |
Weight% |
EPS growth %TTM |
P/E TTM |
P/E fwd |
Yield% |
|
Verizon Communications, Inc. |
7.09 |
-13.54 |
9.17 |
8.14 |
6.19 |
|
|
Dow, Inc. |
7.05 |
-0.01 |
7.13 |
8.57 |
5.09 |
|
|
International Business Machines Corp. |
6.73 |
-74.03 |
104.76 |
15.78 |
4.59 |
|
|
Walgreens Boots Alliance, Inc. |
6.52 |
-146.32 |
N/A |
8.13 |
5.24 |
|
|
3M Co. |
5.81 |
12.68 |
11.04 |
12.41 |
4.70 |
|
|
Merck & Co., Inc. |
5.01 |
112.19 |
19.11 |
15.53 |
2.54 |
|
|
Intel Corp. |
4.92 |
-37.10 |
8.87 |
14.65 |
5.08 |
|
|
JPMorgan Chase & Co. |
4.80 |
-25.07 |
11.65 |
11.92 |
2.90 |
|
|
Chevron Corp. |
4.67 |
240.94 |
10.05 |
9.24 |
3.22 |
|
|
Cisco Systems, Inc. |
4.23 |
2.87 |
17.47 |
13.61 |
3.15 |
Three constituents of the Dow Jones are not in DJD because they don’t pay dividends: Boeing (BA), Salesforce (CRM) and Disney (DIS).
Technology is the heaviest sector, with a weight of 18.4% (it is almost the same in DIA: 18.2%). Compared to the parent index, DJD overweights consumer staples, energy, communication and materials. It underweights healthcare, financials, industrials and consumer discretionary. It results in a better balance across sectors:
Sector breakdown (Chart: author)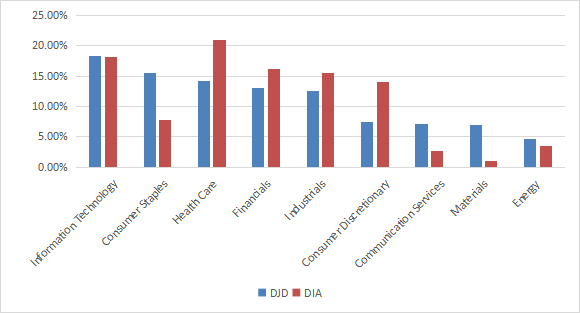
Performance
Since inception in December 2015, DJD is behind DIA by a short margin of 2.1 percentage points in total return. The difference of 15 bps in annualized return is not really significant.
|
Tot. Return |
Annual.Return |
Drawdown |
Sharpe ratio |
Volatility |
|
|
DJD |
119.58% |
11.82% |
-34.66% |
0.68 |
15.81% |
|
DIA |
121.68% |
11.97% |
-36.70% |
0.7 |
16.51% |
DJD vs DIA since December 2015 (Portfolio123)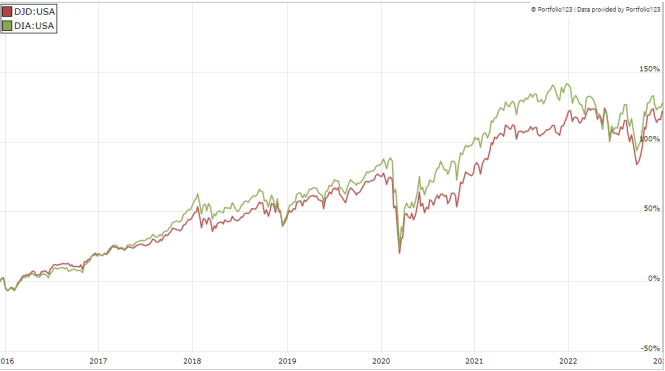
DJD has been more resilient in 2022, outperforming DIA by about 6 percentage points in the last 12 months.
DJD vs DIA, last 12 months (Portfolio123)
The fund pays quarterly dividends. Annualized distributions have increase from $0.7109 per share in 2016 to $1.3785 in 2022. This is an annualized dividend growth of 14%, which is excellent.
In previous articles, I have shown how three factors may help cut the risk in a dividend portfolio: Return on Assets, Piotroski F-score, and Altman Z-score.
The next table compares DJD since inception with a subset of the S&P 500: stocks with a dividend yield above the average of their respective indexes, an above-average ROA, a good Altman Z-score and a good Piotroski F-score. It is rebalanced annually to make it comparable with a passive index.
|
Tot. Return |
Annual.Return |
Drawdown |
Sharpe ratio |
Volatility |
|
|
DJD |
119.58% |
11.82% |
-34.66% |
0.68 |
15.81% |
|
Dividend quality subset |
140.16% |
13.25% |
-36.53% |
0.76 |
16.77% |
Past performance is not a guarantee of future returns. Data Source: Portfolio123
DJD lags the S&P 500 dividend and quality subset by 20 percentage points in total return. However, ETF performance is real, whereas the subset is hypothetical. My core portfolio holds 14 stocks selected in this subset (more info at the end of this post).
Scanning DJD portfolio
DJD is significantly cheaper than DIA regarding the usual valuation ratios:
|
DJD |
DIA |
|
|
P/E |
13.8 |
19.37 |
|
P/Book |
2.98 |
4.13 |
|
P/Sales |
1.38 |
2.33 |
|
P/Cash Flow |
10.78 |
17.27 |
Data: Fidelity
In my ETF reviews, risky stocks are companies with at least 2 red flags: bad Piotroski score, negative ROA, unsustainable payout ratio, bad or dubious Altman Z-score, excluding financials and real estate where these metrics are less relevant. Out of 27 holdings, only two are risky regarding these criteria: Verizon (VZ) and Walgreens Boots Alliance (WBA). Unfortunately, they are in the top 10 and weigh 13.6% of asset value.
Based on my calculation of weighted Altman Z-score, Piotroski F-score and ROA, DJD is slightly inferior to DIA in portfolio quality.
|
Aggregates |
Altman Z-score |
Piotroski F-score |
ROA% TTM |
|
DJD |
3.27 |
4.75 |
3.27 |
|
DIA |
5.75 |
6.04 |
5.75 |
Takeaway
DJD holds the 27 dividend-paying companies of the Dow Jones index, weighted based on yields. The sector breakdown is more balanced than the parent index. Regarding fundamental metrics, DJD is cheaper than DIA, but has a lower quality. The dividend growth rate since inception is excellent. The fund is marginally behind the benchmark in total return, but it has outperformed in 2022. In summary, DJD is a good fund with cheap fees for investors attracted to blue chips, with a higher dividend and a better sector balance than the Dow Jones index. For transparency, a dividend-oriented part of my equity investments is split between a passive ETF allocation (DJD is not part of it) and my actively managed Stability portfolio (14 stocks), disclosed and updated in Quantitative Risk & Value.
Be the first to comment