


Nodar Chernishev
Investment Thesis
It’s best to buy the Invesco Dow Jones Industrial Average Dividend ETF (NYSEARCA:DJD) when it’s trading at a significant discount to the price-weighted Dow Jones Industrial Average. Unfortunately, that’s not the case today, and many of DJD’s most overweight constituents face significant earnings risk over the next few weeks, including 3M (MMM) and Intel (INTC). While DJD’s 3.40% trailing dividend yield is tempting, I think readers should avoid chasing it today and opt for a well-rounded dividend ETF like SCHD instead.
ETF Overview
Strategy, Sector Exposures, and Top Holdings
DJD tracks the Dow Jones Industrial Average Yield Weighted Index, selecting only the dividend-paying stocks in the DJIA and weighting them by trailing twelve-month yield instead of price. The resulting portfolio is a low-beta one, meaning investors can generally expect outperformance in bear markets and vice versa. I’ll discuss these features and several other fundamental metrics shortly, as I find it fascinating how a simple change in the weighting scheme can impact a portfolio’s risk profile so dramatically.
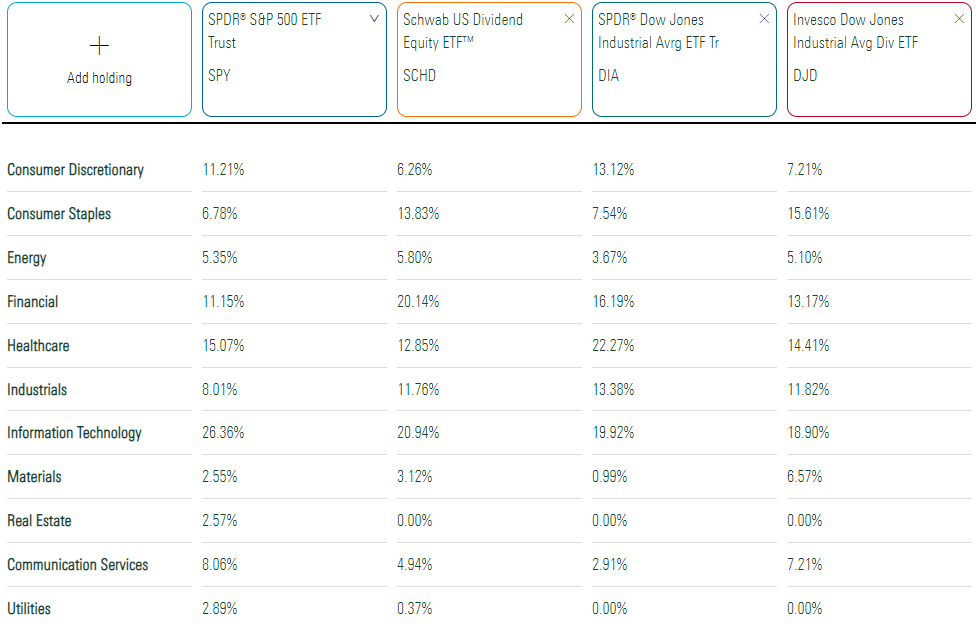
The 30-stock DJIA gets reduced to 27, given how salesforce.com (CRM), Boeing (BA), and Disney (DIS) do not pay a dividend. Otherwise, the main takeaways are that DJD overweights Consumer Staples and Materials and underweights Consumer Discretionary and Health Care.
Morningstar
The average stock weighting is 3.70%, but the following top ten holdings have much higher weights due to their high yields. Walgreens Boots Alliance (WBA), down 35% YTD, currently yields 5.60%. International Business Machines (IBM) and Verizon Communications (VZ) pay 5.08% and 7.38%, respectively. Meanwhile, Apple (AAPL) yields only 0.62% and receives the lowest weight in the Index at just 0.72%.

Invesco
Summary statistics worth highlighting include the following:
- Assets Under Management: $221 million
- Expense Ratio: 0.07%
- Launch Date: December 16, 2015
- Trailing Dividend Yield: 3.40%
- Five-Year Dividend CAGR: 9.88%
- Dividend Payout Frequency: Quarterly
- Five-Year Beta: 0.82
- Number of Securities: 27
- Portfolio Turnover: 15% (20%, 14%, 50% From 2019-2021)
- Assets in Top Ten: 57.01%
- 30-Day Median Bid-Ask Spread: 0.25%
- Tracked Index: Dow Jones Industrial Average Yield Weighted Index
- Index Reconstitution Frequency: Semi-Annually in March and September
- Weighting Scheme: Trailing 12-Month Dividend Yield
Performance History
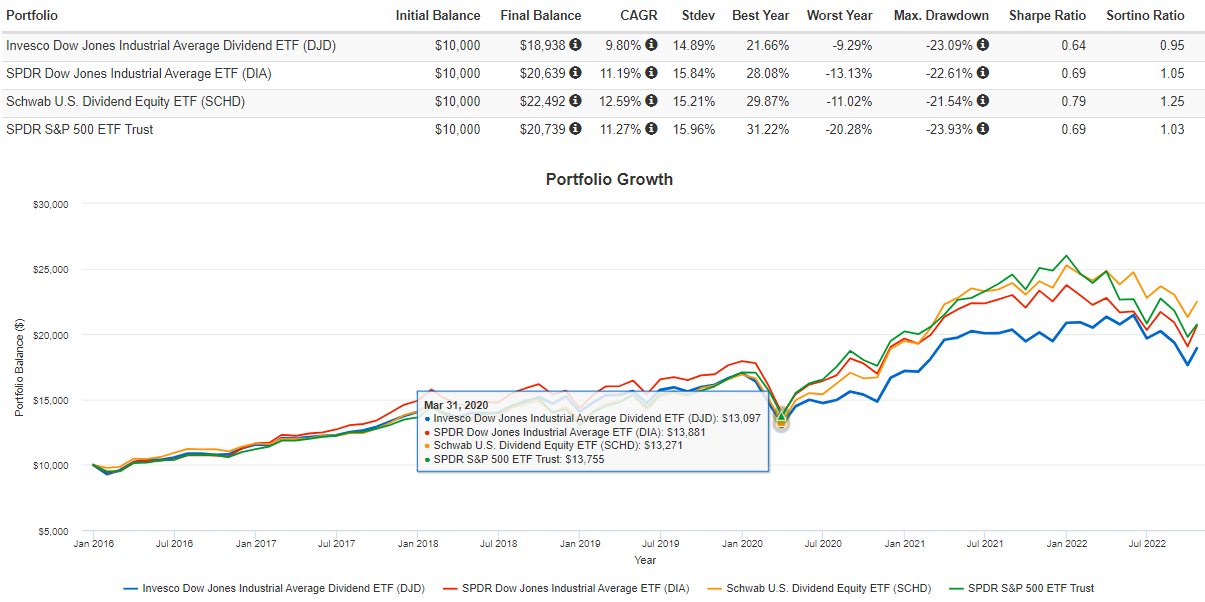
The yield-weighted strategy produces a cheaper portfolio with lower volatility, and these factors proved valuable this year. Through October 21, 2022, DJD has outperformed DIA, SCHD, and SPY by 3.84%, 1.73%, and 11.00%, respectively. SCHD is the closest comparison since it’s also dividend-focused with a high yield. The graph below shows how much DJD lagged SCHD in 2020-2021. Until then, however, most people would have viewed DJD as a solid alternative. One reason is that DJD is a low-growth ETF and was ill-prepared for the post-pandemic boom in equities.

Portfolio Visualizer
Readers can analyze the total risk and return metrics in the graph below for a more complete look. I’ve highlighted how all four ETFs had similar returns up until March 2020. Unfortunately, DJD lagged afterward, resulting in an annualized return that was 2.79% worse than SCHD. DJD did experience slightly less volatility which led to an improvement in risk-adjusted returns (Sharpe and Sortino Ratios), but it wasn’t enough.
Portfolio Visualizer
Dividends
DJD receives a C+ Seeking Alpha Dividend Grade because of a relatively poor trailing growth rate of 11.26% and just two consecutive years of dividend payments.

Seeking Alpha
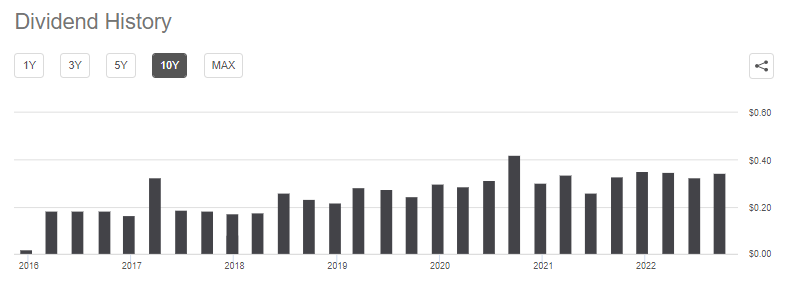
I question the 20.11% metric assigned as the median for all ETFs and don’t place much value on the consecutive years of dividend payment grade for this or any other fund. Since nearly all equity ETFs pay dividends, this metric is primarily a function of how long a fund has been around. Also, the two-year figure doesn’t appear accurate, as payments have been made since 2016.
Seeking Alpha
The main metrics to focus on are DJD’s 3.40% trailing yield and its five-year dividend growth rate, which is a respectable 9.88%. SCHD yields 3.53% and has a 12.10% five-year dividend growth rate, so it seems better geared to dividend growth investors. Still, they both look like solid choices and choosing the better one will come down to each ETF’s quality of holdings. Let’s look at that next.
ETF Analysis
Company Snapshot
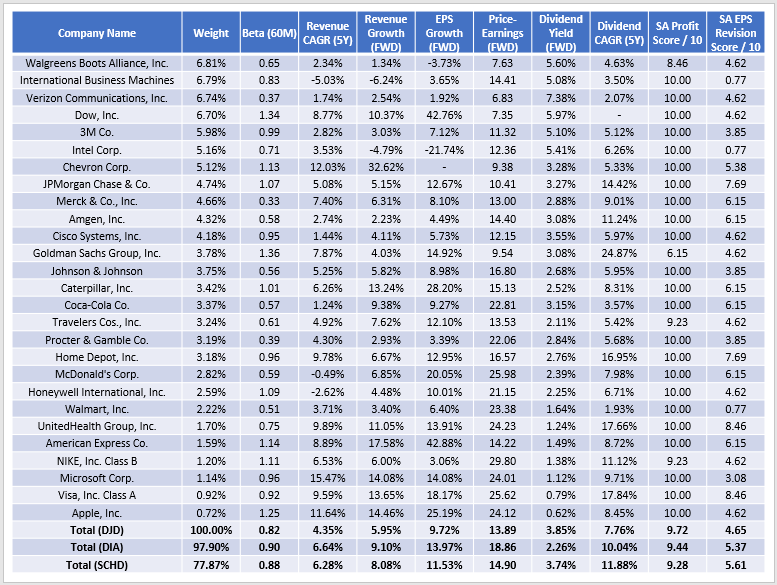
The following table summarizes selected fundamental metrics for all of DJD’s 27 holdings. This showcases the impact of DJD’s dividend-yield weighting scheme and highlights how many of DJD’s features are also in SCHD. Have a look through it, and I’ll offer my comments afterward.
The Sunday Investor
1. DJD has a five-year beta of 0.82, below 0.90 and 0.88 for DIA and SCHD, respectively. It supports the lower annualized volatility shown earlier in the performance analysis section.
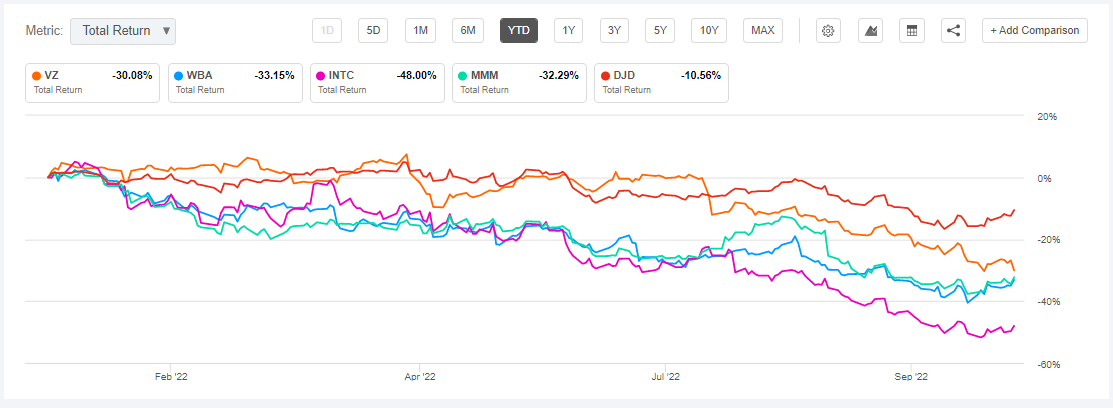
2. With dividend ETFs, downside protection is often exchanged for lower growth, and DJD is no exception. Constituents have a weighted-average 9.72% estimated sales growth rate, placing it in the bottom 25% among the 65 dividend ETFs I track. A lot of the slow growers like Verizon Communications (VZ), Walgreens Boots Alliance (WBA), Intel (INTC), and 3M (MMM) have significantly lagged behind the broader Index YTD. It indicates these stocks aren’t mispriced but are down because of poor results.
Seeking Alpha
3. DJD trades at 13.89x forward earnings, slightly better than SCHD’s 14.90x valuation. Though seemingly attractive compared to DIA’s 18.86 figure, it’s about average for dividend ETFs yielding above 3.50%. Recall I was bullish on DJD in February when it traded at a seven-point discount compared to DIA. Outperformance followed up until my May downgrade due to the discount slipping to four points. The discount is the same today, so I don’t think DJD has any significant value advantage worth chasing.
Earnings Season Update
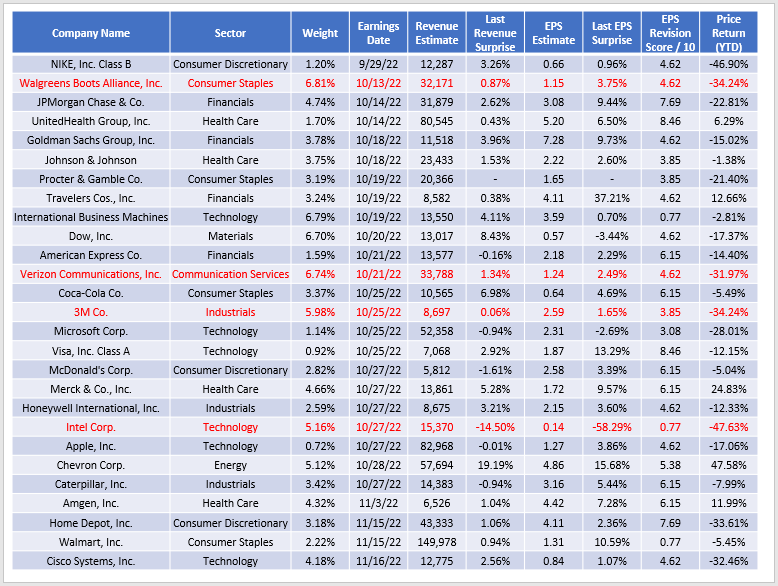
The following table summarizes estimated sales and earnings expectations for DJD’s holdings. I’ve highlighted four companies it overweights and could be in trouble in the next few weeks. Collectively, these companies represent nearly one-quarter of the ETF.
The Sunday Investor
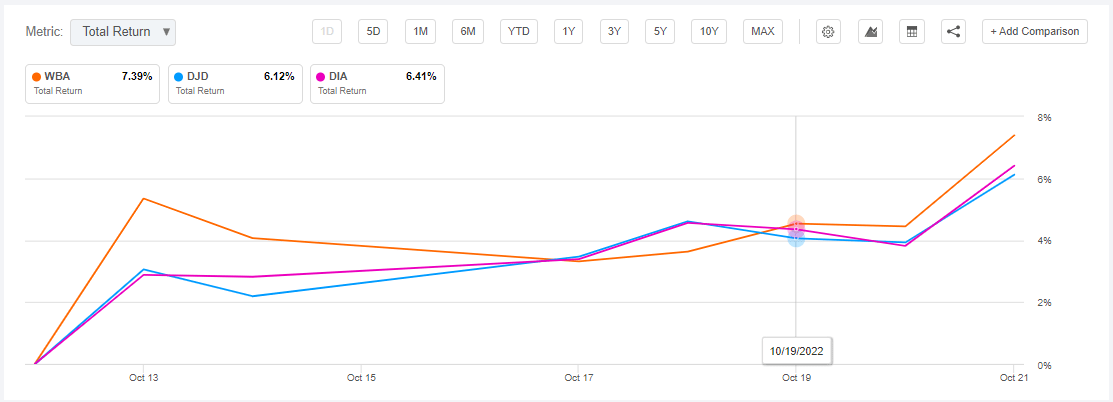
1. Walgreens recorded its ninth-straight quarterly earnings beat on October 13, but the 3.75% surprise was the lowest during that period. The stock is up 7.39% since, but that’s not much better than DJD and DIA’s gains. Overall, I think the report was a good news story, but likely not enough to turn market sentiment positive again. WBA remains down 34% YTD.
Seeking Alpha
2. Shares in Verizon Communications (VZ) sunk to a 12-year low after the company reported a minimal beat on sales and earnings. Subscriber issues and rising costs were the key issues highlighted by analysts, though the company revealed a plan to save between $2-$3 billion in annual expenses by 2025. Verizon yields an attractive 7.38%, but I’m wary it’s a classic yield trap and am uncomfortable with its 6.74% weighting.
3. 3M (MMM) is the target of 230,000 lawsuits, and investors will undoubtedly be looking for an update when the company reports before markets open on Tuesday. The company’s five-year beta is 0.99, indicating it moves in line with the market, but that should change this week. Several Seeking Alpha analysts are touting the stock and its 5.10% yield as a tremendous buying opportunity, but I think it’s mostly speculation. Event-driven buying tied to legal proceedings is a skill most of us, including me, do not have. Even the CEO, Mike Roman, stated his belief that litigating these cases individually “could take years, if not decades,” and that the potential outcomes are highly variable. I’m inclined to follow Wall Street on this one, and the sentiment is overwhelmingly negative.
Seeking Alpha
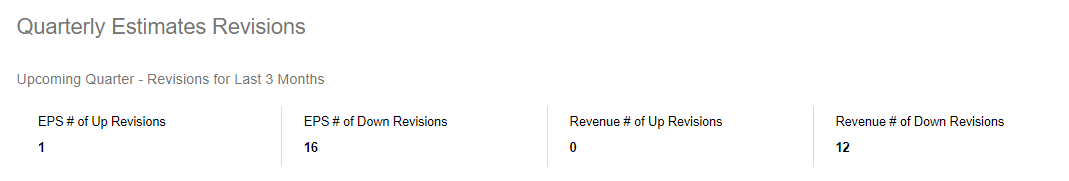
4. Recall the massive earnings miss Intel (INTC) reported last quarter, and the stock is now down 48% YTD. Seeking Alpha has assigned an “F” EPS Revision Grade to the company, and its $0.14 EPS estimate is already low enough, reflecting what would be a 91.56% decline from Q3 2021.

Seeking Alpha
Finally, the median earnings surprise for the 12 companies already reporting this quarter was only 2.60%, far below the 5.40% aggregate earnings surprise Yardeni Research notes for the S&P 500 Index. In short, I don’t think this earnings season is going too well for DJD’s constituents, and there are likely a lot of risks outstanding over the next few weeks.
Investment Recommendation
DJD will be attractive to income investors due to its 3.40% trailing dividend yield, but I think it’s likely to underperform its peers, including DIA and SCHD, in the near term. Its valuation discount is no longer significant, and several companies it overweights are facing substantial challenges this earnings season. Slow sales and earnings growth continue to be problematic, and I don’t think the risk-reward makes sense at these prices. Therefore, I recommend passing on DJD today and look forward to recapping Q3’s results before the year ends.
Be the first to comment