

ijeab
ETF Snapshot
The Invesco Dow Jones Industrial Average Dividend ETF (NYSEARCA:DJD) is a product that focuses on the dividend-paying securities of the Dow Jones Industrial Average, aka, DOW. DJD made its debut on the market in late 2015; since then, it has managed to accumulate AUM OF ~$180m. Gaining access to this ETF comes at a limited cost, as exemplified by a low expense ratio of only 0.07%; this is incidentally more than 2x lower than the only ETF that gives you access to the DOW – The SPDR Dow Jones Industrial Average ETF Trust (DIA). Despite covering less than 30 stocks, DJD does engage in ample churn; typically, on average, 50% of the portfolio gets churned every year. Given the dividend-centric theme, it’s not a surprise to discover that DJD offers a better yield (3.15%) than DIA (1.85%), and the ETF median (2.08%)
How Do DJD and DIA Differ?
The point of this exercise is to determine if there’s great merit in pursuing the dividend-yielders of the DOW, or, is one just better off sticking to the DOW, as it is. Before I touch upon the respective performances, it is important to highlight how DJD’s construction differs from the Dow Jones.
The Dow Jones Industrial Average, as you know, is an index covering 30 large-cap stocks, as determined by a committee of stock editors; stocks chosen are then weighted on the basis of price. DJD on the other hand is a subset of the former, and only covers stocks from the DOW that have paid dividends over the past 12 months.
Since the last rebalancing date that came into play on the third Friday of March, only 27 out of the 30 Dow stocks have passed the dividend test. The next rebalancing exercise will commence shortly, by the end of this month, and the rebalancing will come into effect by the third Friday of September.
The other crucial thing to note about DJD is that the index is weighted and rebalanced based on the indicated annual dividend yield (excluding special dividends). Thus, even though DJD covers the same stocks as DIA (albeit, this is a slightly smaller portfolio), the way these stocks are weighted across both portfolios will make a difference to the end returns. To reiterate this point, do consider that none of the top-10 stocks (aggregate weight of ~55%) of DIA make up the top-10 stocks (aggregate weight of ~56%) of DJD.
Invesco, State Street Global Advisors SPDR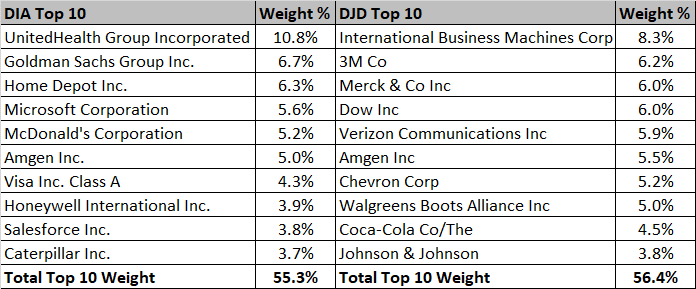
How Has DJD Performed Relative to DIA?
So, has the dividend-yielding weighting methodology paid off for DJD? Unfortunately, no. As you can see from the image below, whilst there was a tug-of-war in the first few years of DJD’s existence, since late 2016, the Dow 30 has consistently outperformed the dividend yielders.
YCharts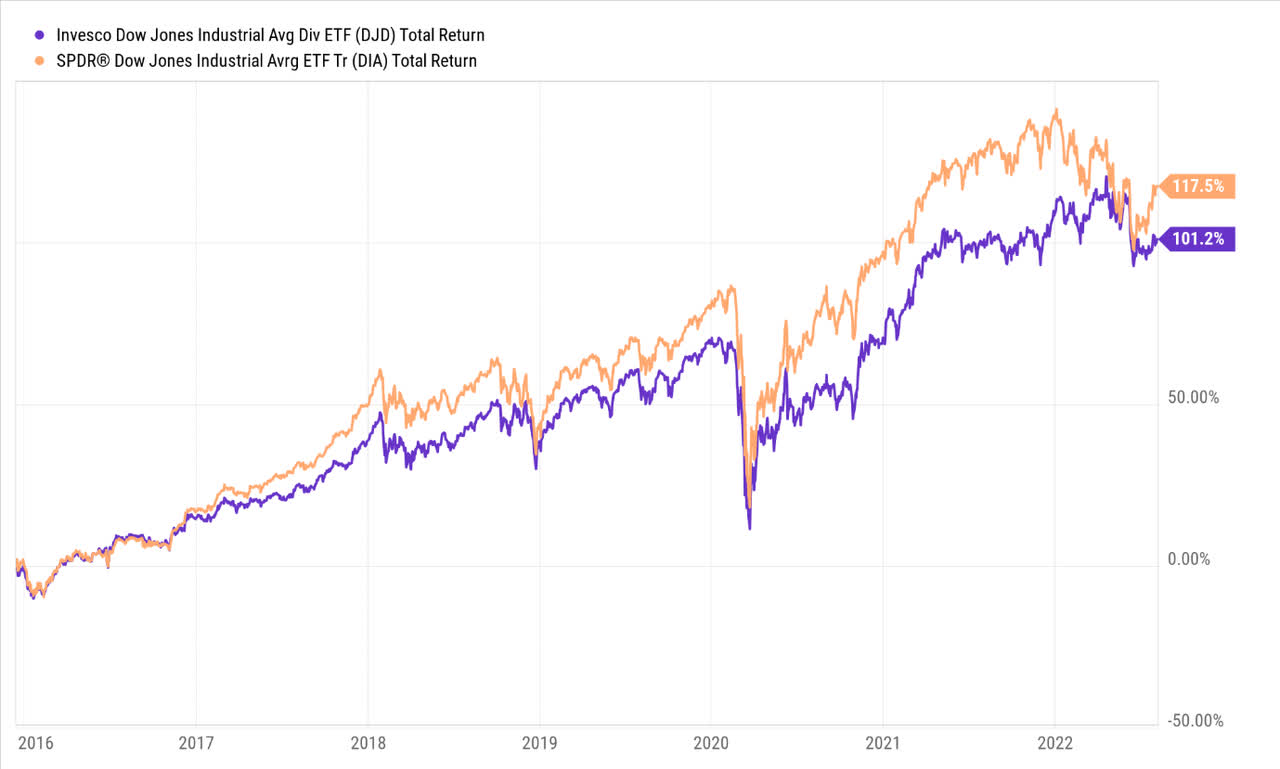
Looking at the total return differential between these two products only provides one half of the story; there are other nuances as well to consider, such as gauging the volatility quotient of these two ETFs, and whether they have provided a threshold of returns that is commensurate with the degree of risk taken.
There are three key metrics to consider to get a better sense of this, and I’ve also looked at how these products have fared across different periods. A medium-term time frame, which covers a larger chunk of the pre-pandemic era, and the short-term time frame, which focuses more on the performance since the advent of the pandemic.
YCharts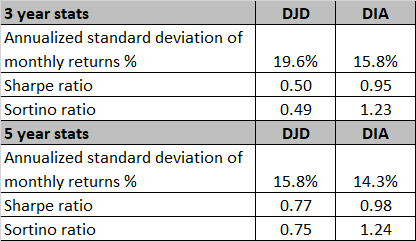
Firstly, what can be gleaned irrespective of the time frame is that DJD is the more volatile portfolio of the two (higher standard deviation), and the volatility differential has only become more pronounced in recent years.
The elevated standard deviation of DJD calls for a higher threshold of excess returns (relative to the risk-free rate); admittedly, whilst even DIA fails to deliver a Sharpe ratio of over 1, be it over 3 years or 5 years, its numbers are still miles ahead of DJD.
Finally, consider the Sortino ratio, which measures the ability of these two portfolios to deliver excess returns when faced with harmful volatility or downside deviation. This is a decent gauge to determine the defensiveness of a portfolio. Whilst DIA delivers solid Sortino ratios well over 1x, DJD flounders, and if anything, things have worsened dramatically in recent years (3-year Sortino of 0.49 vs 0.75 across 5 years whereas for DIA it is pretty consistent across time frames).
Closing Thoughts
At the end of the day, weighting a portfolio of stocks solely based on yield comes across as inadequate; ideally, you want to solidify the screening and weighing mechanism with other measures such as dividend growth, consistency, sustainability, FCF cover, low leverage, etc. When things are based solely on the yield, every six months (DJD rebalances on a semi-annual basis), you’d invariably get locked in with the chief underperformers as high yielders are mostly a function of the weak denominator effect (share price) rather than a strong numerator effect (higher dividend).
What works in favor of DJD is that its forward P/E valuation is currently only at 13x, which is around ~23% cheaper than the corresponding multiple of DIA. But then again, do consider that DIA offers better earnings growth potential of 26% annual growth vs 22% for DJD (Source: YCharts).
I’ll also touch upon some technical considerations. As you can see from the image below, at the current price point, neither of the two ETFs offer attractive risk-reward as exemplified by the relative strength ratio of DJD and DIA which is in the middle of the range.
StockCharts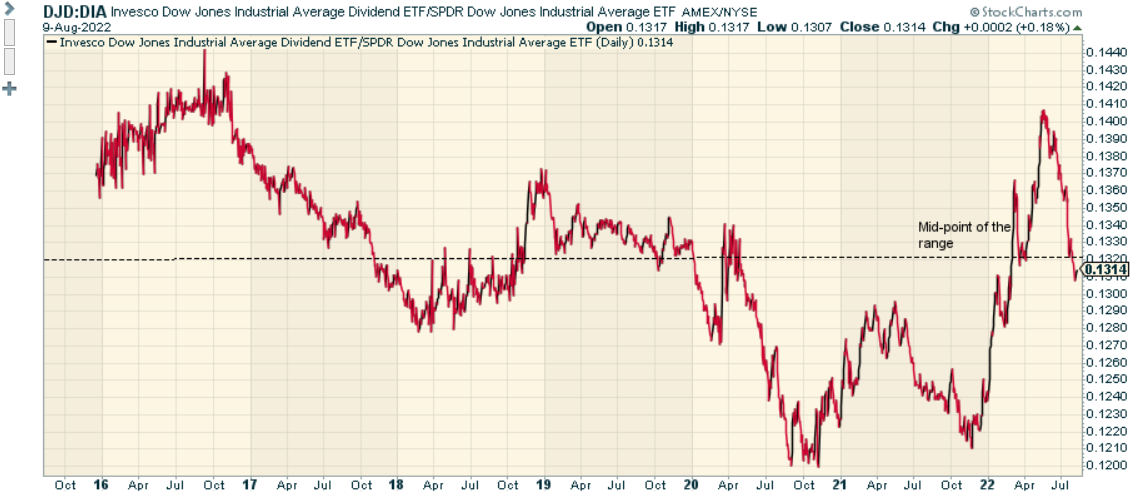
Finally, also consider the standalone monthly chart of DJD; after months of consolidation below the $50 levels, things have actually broken down since June from the rising wedge pattern, which is a typically bearish pattern.
Investing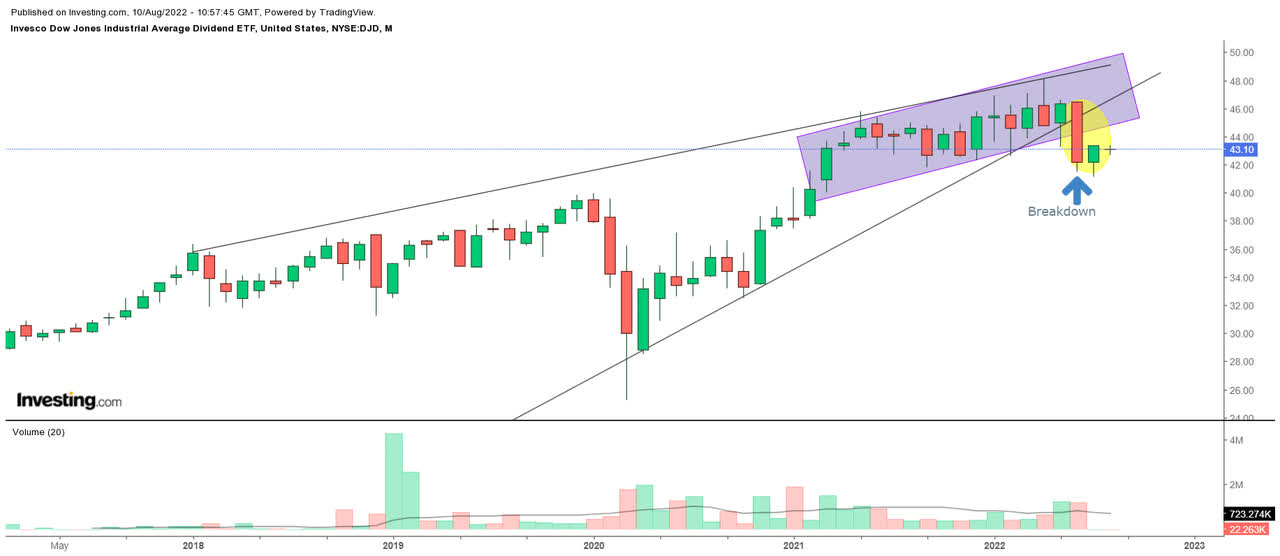
To conclude, I don’t believe there’s any great merit in pursuing the high-yielding stocks of the Dow Jones Industrial Average, which are weighted based on the yield.
Be the first to comment