

Pgiam/iStock via Getty Images
Portfolio Changes in November
Investing into stocks never stops and month after month I am grateful for being able to invest a solid amount of my income into building wealth along my journey towards reaching financial independence.
In November, I invested a total of $2,369, including the sale of my position in Lumen Technologies at a small loss. My investment strategy focuses on buying high-yielding BDC stocks, such as Hercules Capital (HTGC), Ares Capital Corporation (ARCC), and MidCap Financial Investment Corporation (MFID). These purchases will significantly increase my forward dividend income. I will continue to focus on these securities unless there is a major market sell-off that makes other, lower-yielding stocks more attractive.
In addition to these investments, I also added to my position in ZIM Integrated Shipping Services (ZIM) as the stock price fell to a more appealing level. While the current quarterly dividend of $2.95 is high, it is down from the previous dividend of $4.76, and I anticipate that future dividends will be lower as freight rates decline in the face of a deteriorating global economy. Despite these challenges, I believe ZIM is a compelling long-term investment opportunity, and I am willing to be patient as the company navigates these difficult economic conditions.
Apart from that all other purchases were triggered by the almost weekly savings plans.
Due to the nature of how the monthly investment plan process works, I am investing relatively equally into these stocks at two points of time during the month – at the beginning of the month and mid-month – which breaks down as shown below. Figures are in Euro and show that, for instance, at the beginning of the month, I am investing between 50 and 75 EUR each into Microsoft, The Home Depot (NYSE:HD), Visa (NYSE:V), W. P. Carey (WPC), and BP (NYSE:BP). Mid-month, I am adding between 33 and 40 EUR each into STAG Industrial (NYSE:STAG), AT&T (T), NextEra Energy (NYSE:NEE), Toronto-Dominion Bank (NYSE:TD), Main Street Capital (NYSE:MAIN) and JPMorgan (NYSE:JPM).
I have added several investment plans starting mid-September 2020 which include AGNC Investment Corp. (NASDAQ:AGNC), Ares Capital (NASDAQ:ARCC), Medical Properties Trust (NYSE:MPW), The Bank of Nova Scotia (NYSE:BNS) and The Trade Desk (NASDAQ:TTD). Investments here will be focused on high-yield as well as high-growth stocks in the technology, therapeutic and renewables sectors.
All those purchases substantially raised my forward annual dividend income, breaking down as follows:
Added Dividend Income (Designed by Author)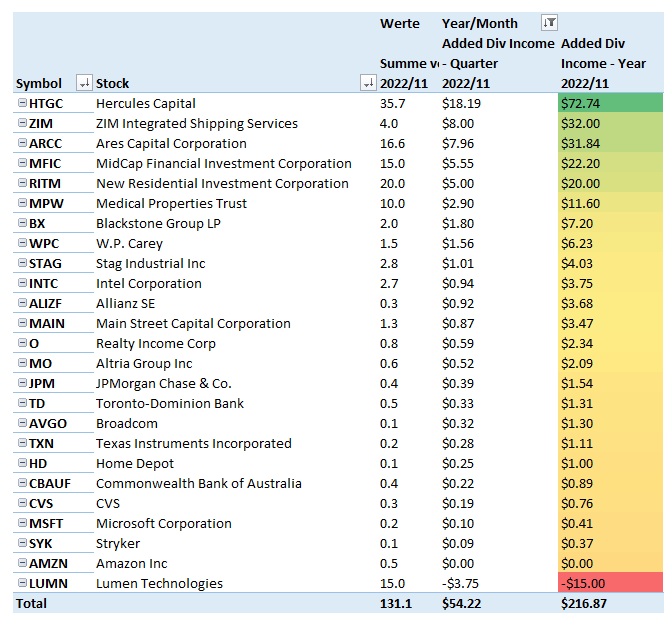
All net purchases in November can be found below:
November 2022 Net Purchases (Designed by author)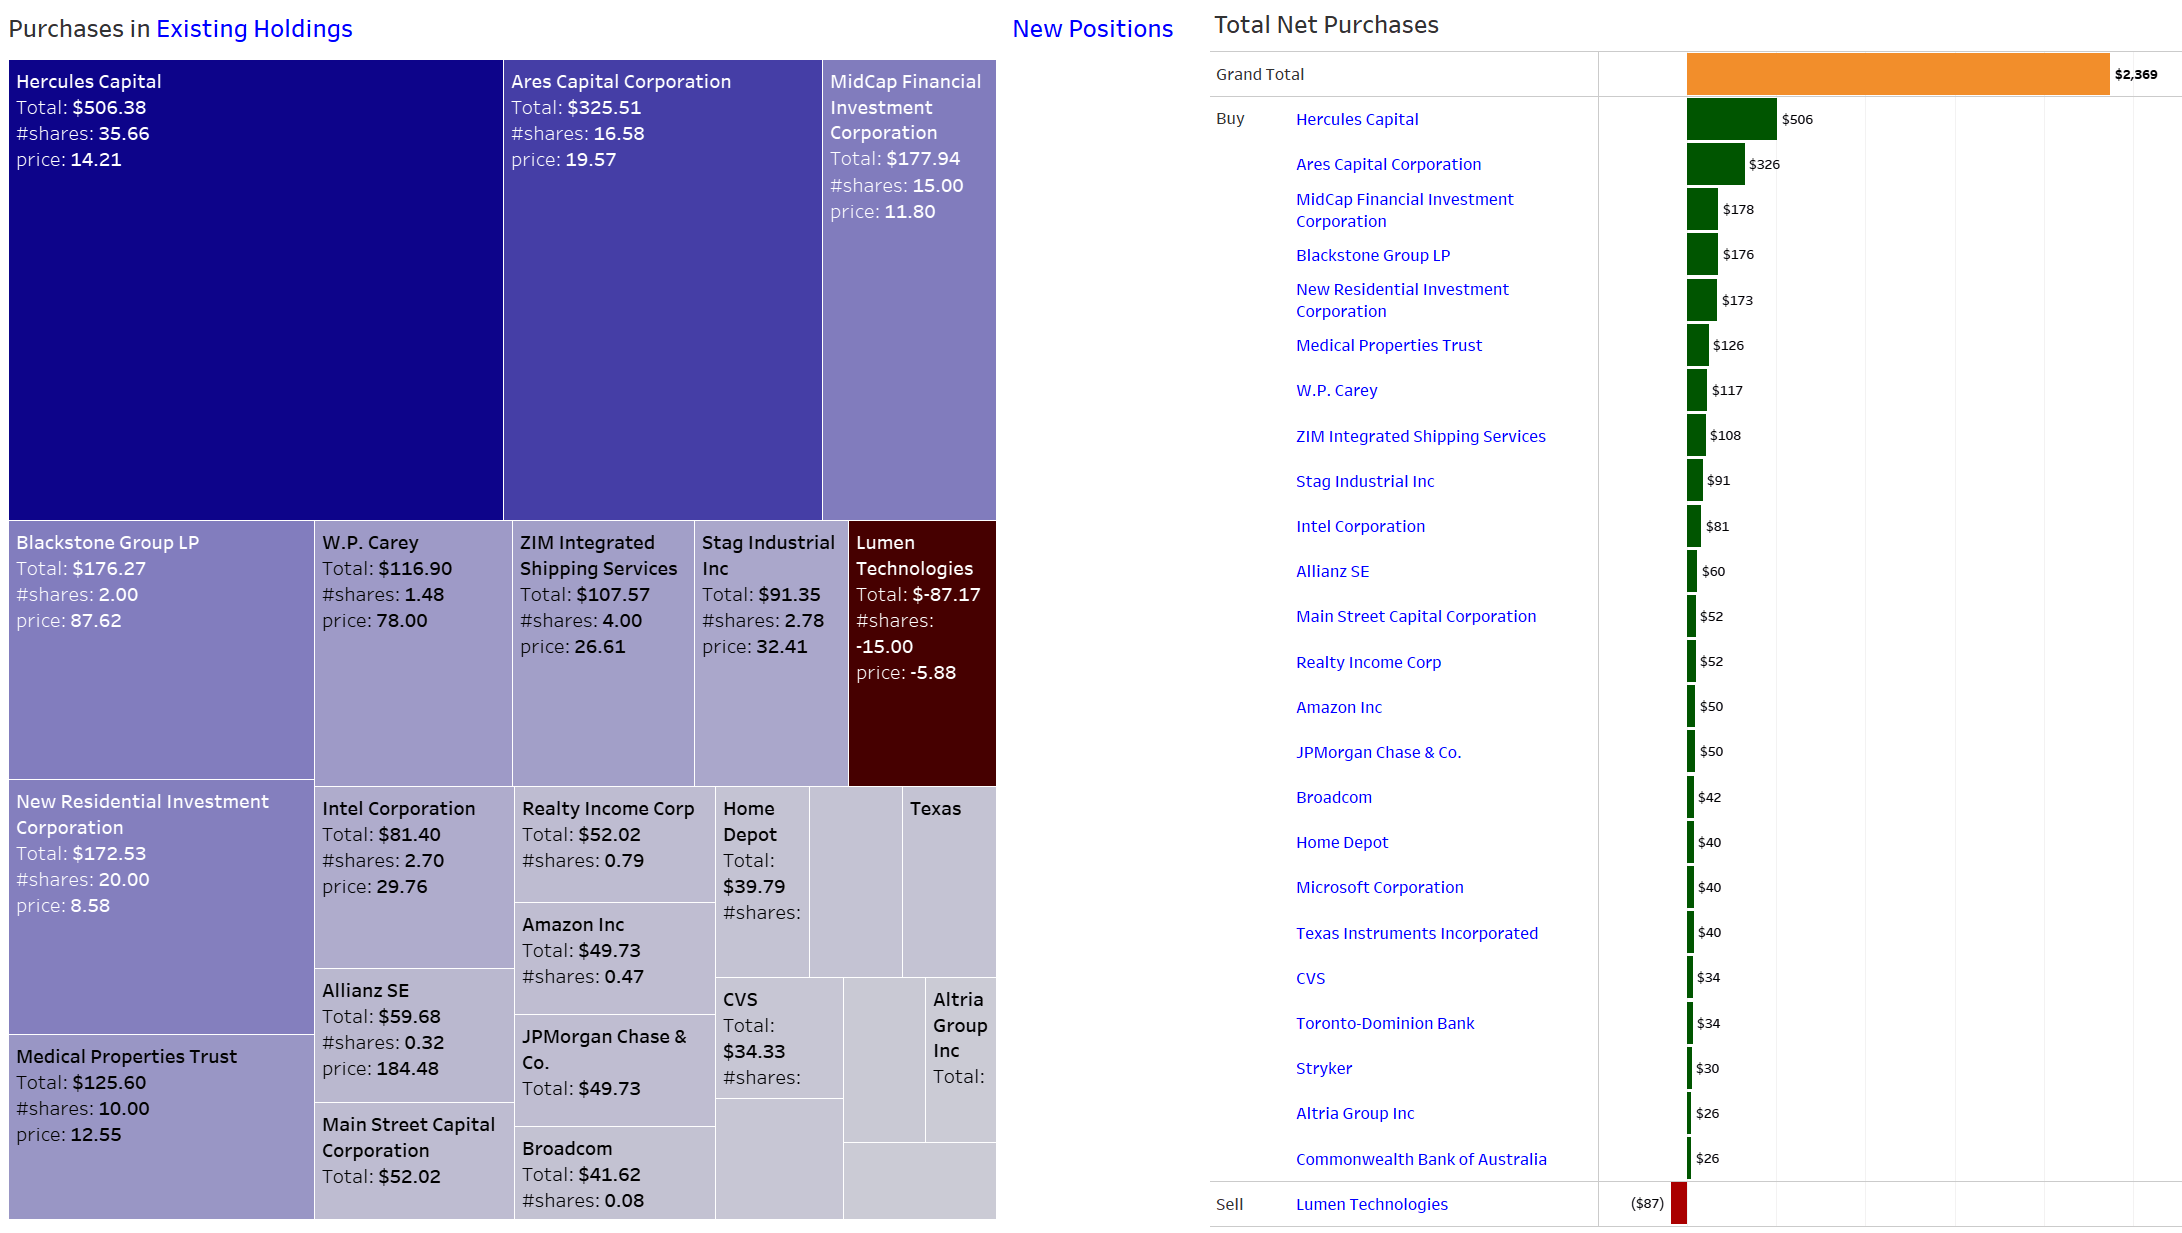
Dividend Income: What Happened on the Dividend Side?
Dividend income hit a new November record of $405 and is up an explosive 30% annually and up 14% sequentially.
The recent addition of Hercules Capital Corporation to my portfolio has been the primary driver of my strong dividend income growth. The quarterly dividend income from this position rose from $3.42 in August to $27.02 in November, and I expect it to at least double, if not triple, by February 2023 due to my focus on building this position while the stock remains very attractive.
In the coming months, my ongoing investments in Hercules Capital will offset the loss of dividend income from AT&T (T) following the company’s restructuring and accompanying dividend cut. I do not plan to sell my position in AT&T, as it is already deep in the red, but I will not add to it until the market demands a multiple expansion for the stock, which is unlikely to happen during the upcoming recession. I have not added to my holdings in Apple in several months, so my dividend income from the company has not changed on a year-over-year basis. However, the stock is still too expensive for me to consider adding to my position at this time.
Despite the easing of some COVID restrictions in China, the massive backlog in iPhone production due to factory shutdowns may create a buying opportunity when Apple releases its next earnings report. I will continue to carefully monitor the company’s performance and consider increasing my position if the stock becomes more reasonably priced.
November 2022 Dividend Income (Designed by author)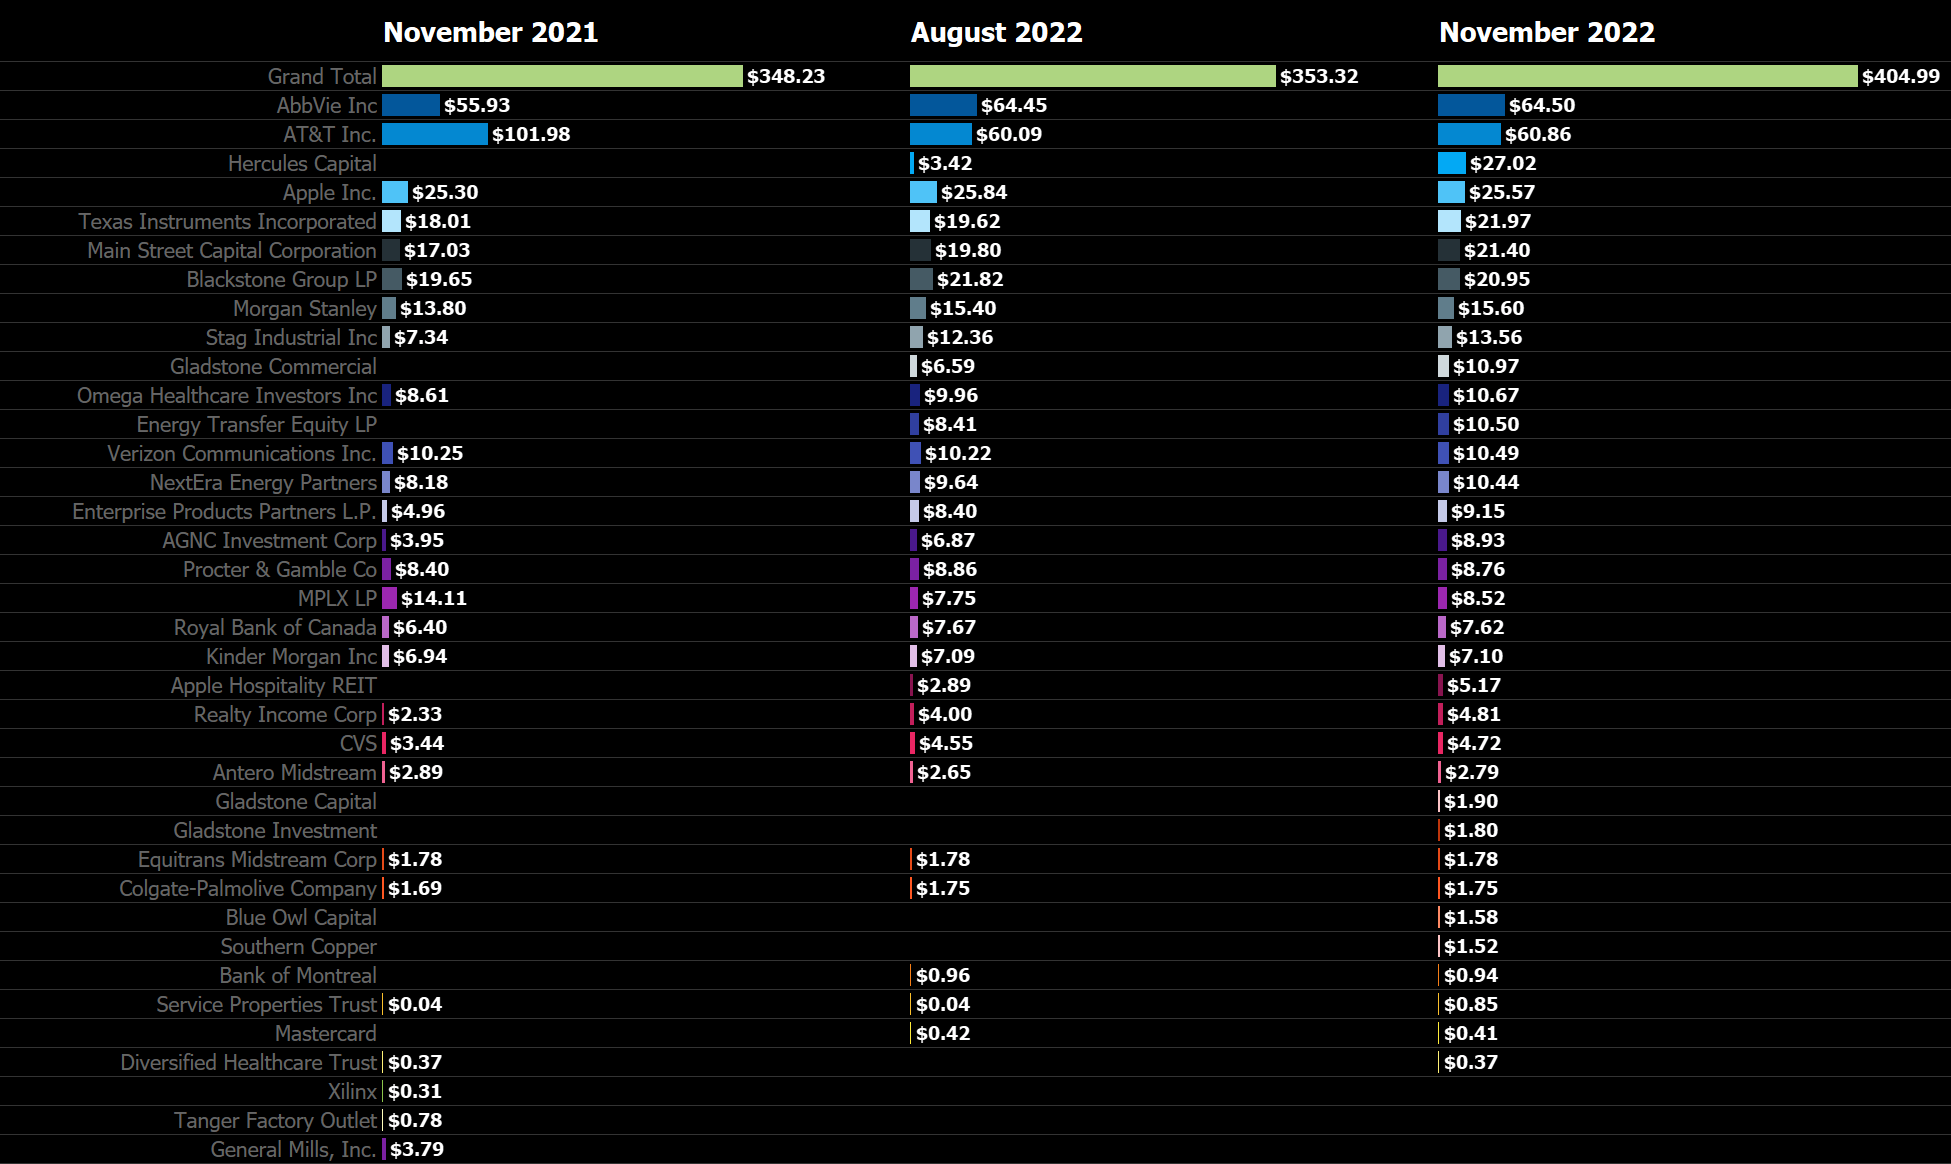
The focus on Hercules Capital can also be seen when looking at the Top 3 Dividend Payers in November featuring AbbVie, AT&T and Hercules. Hercules immediately entered the top 3 which just shows how disproportionately low my dividend income in November truly is but also how high Hercules’ yield of around 10% really is.
Top 3 Dividend Payers (Designed by author)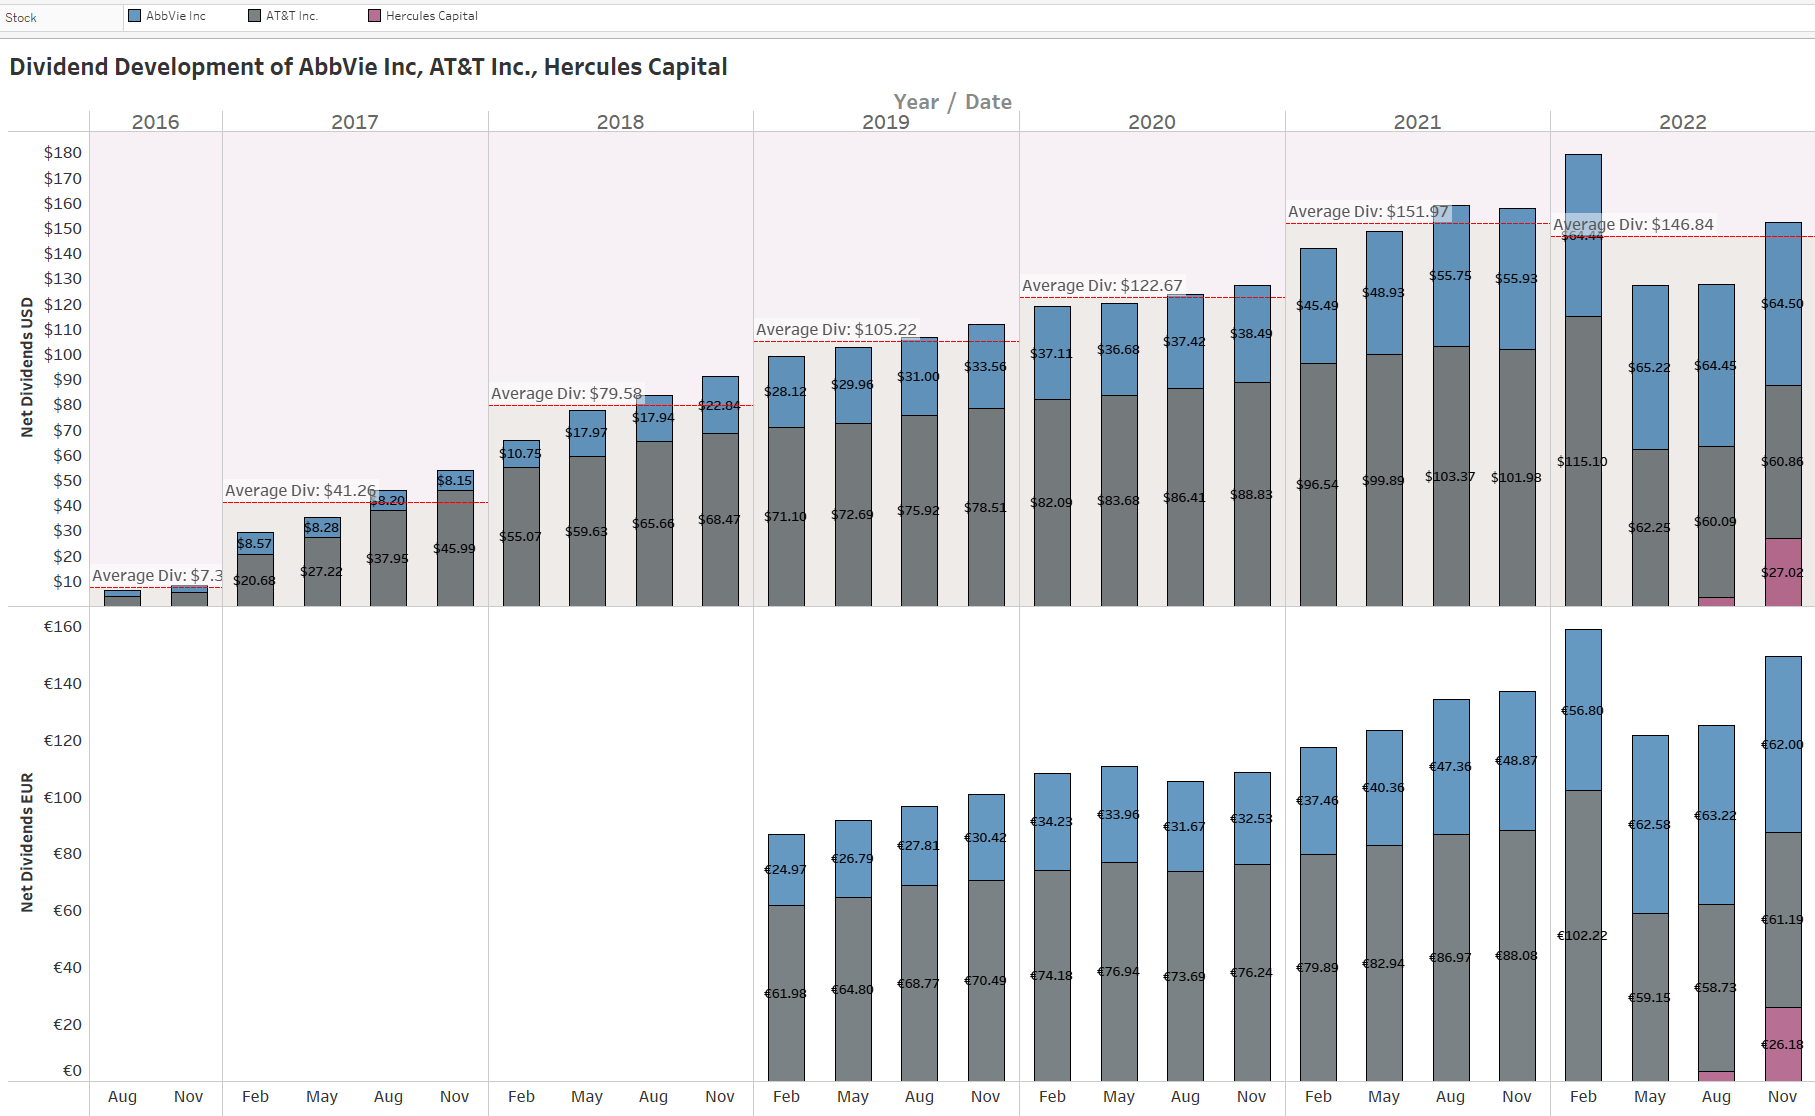
Here is a chart that shows the development of my net dividend income by month over time between 2015 and 2022. You can see the growth of my dividend income and the average annual dividend for each year:
All-time Dividend Development (Designed by author)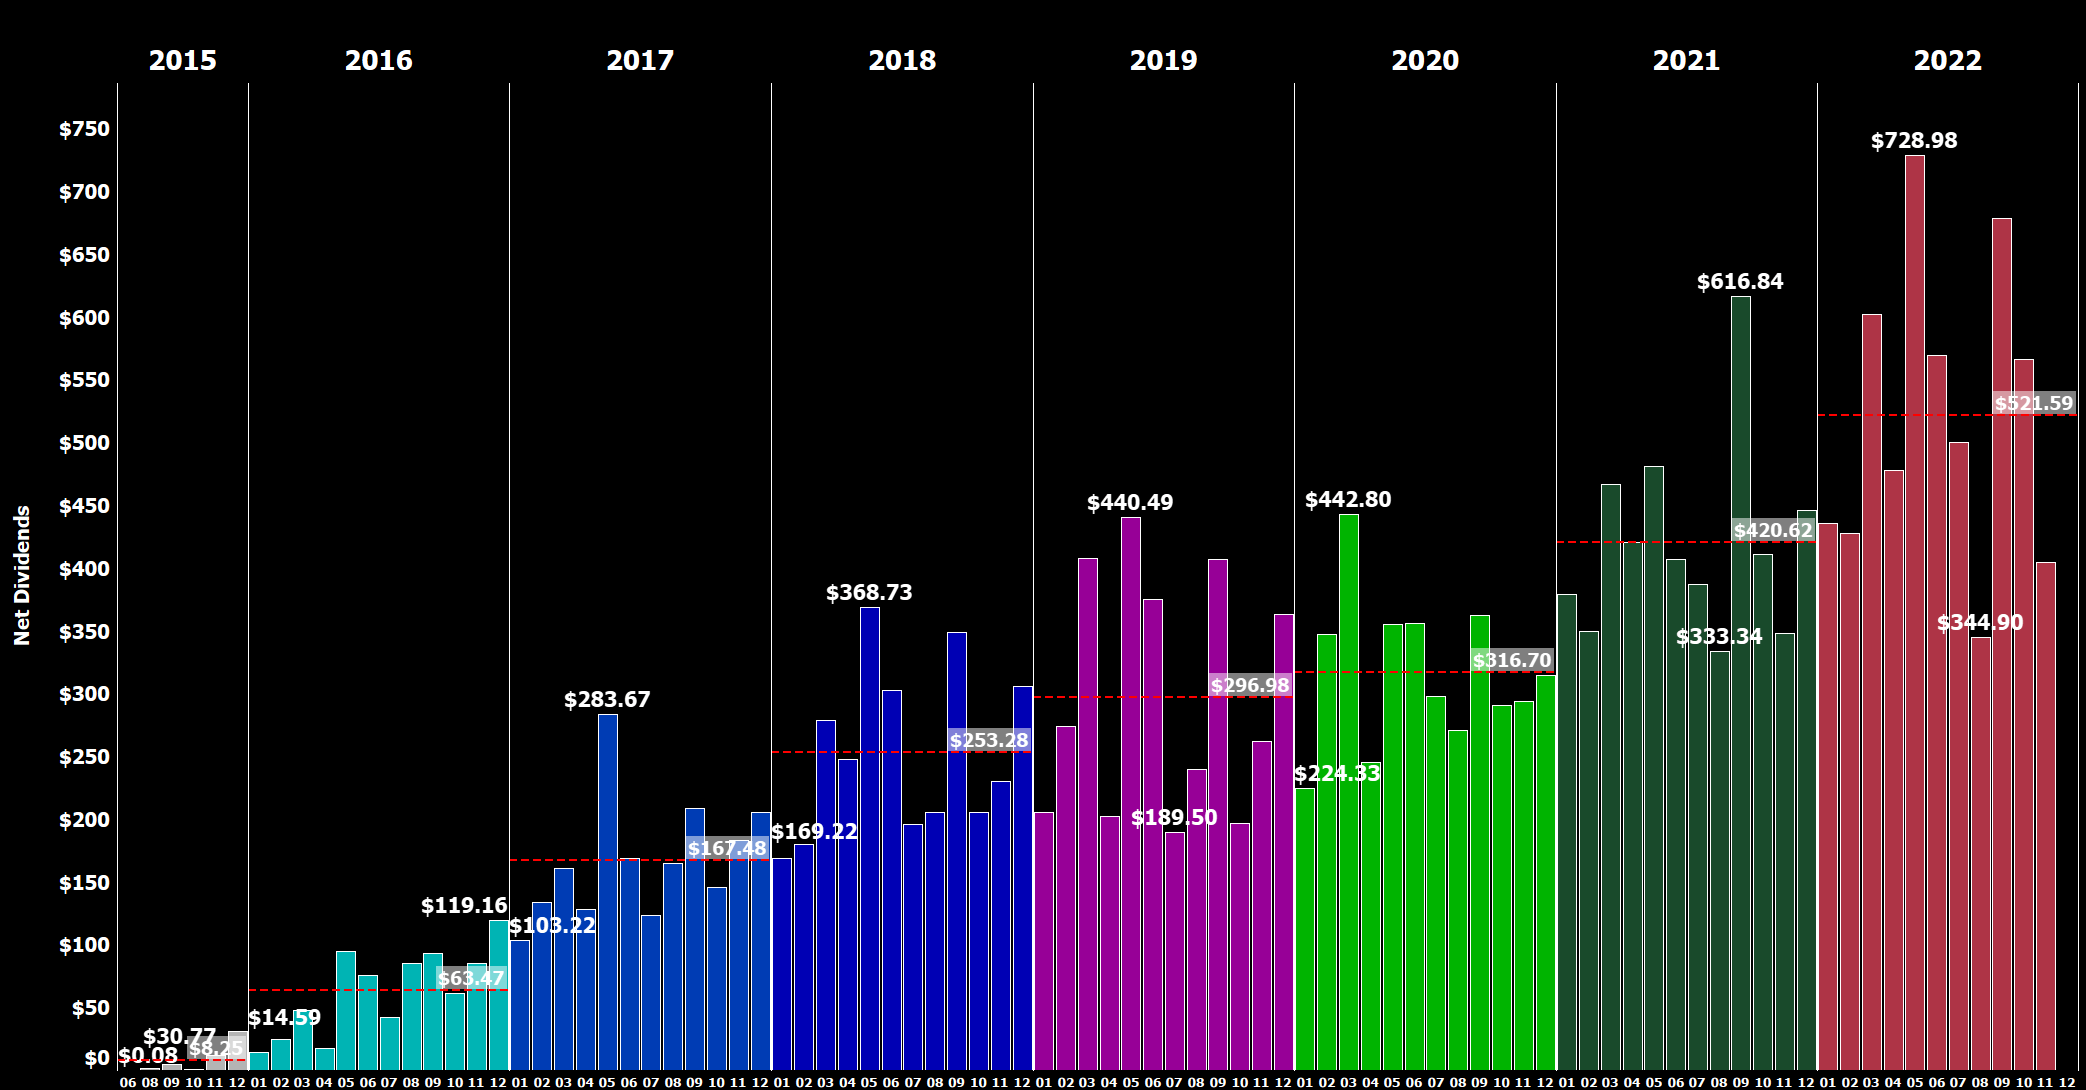
This chart is my favorite because it illustrates the progression of my dividend income over time and allows me to easily see the average annual dividend for each year.
Next, I have plotted all of the individual dividend payments I have received, coloring them by year and arranging the years side by side instead of horizontally as in previous updates. This visualization allows for a more comprehensive analysis of the distribution of my dividend payments over time.
Dividend Bubbles (Designed by author)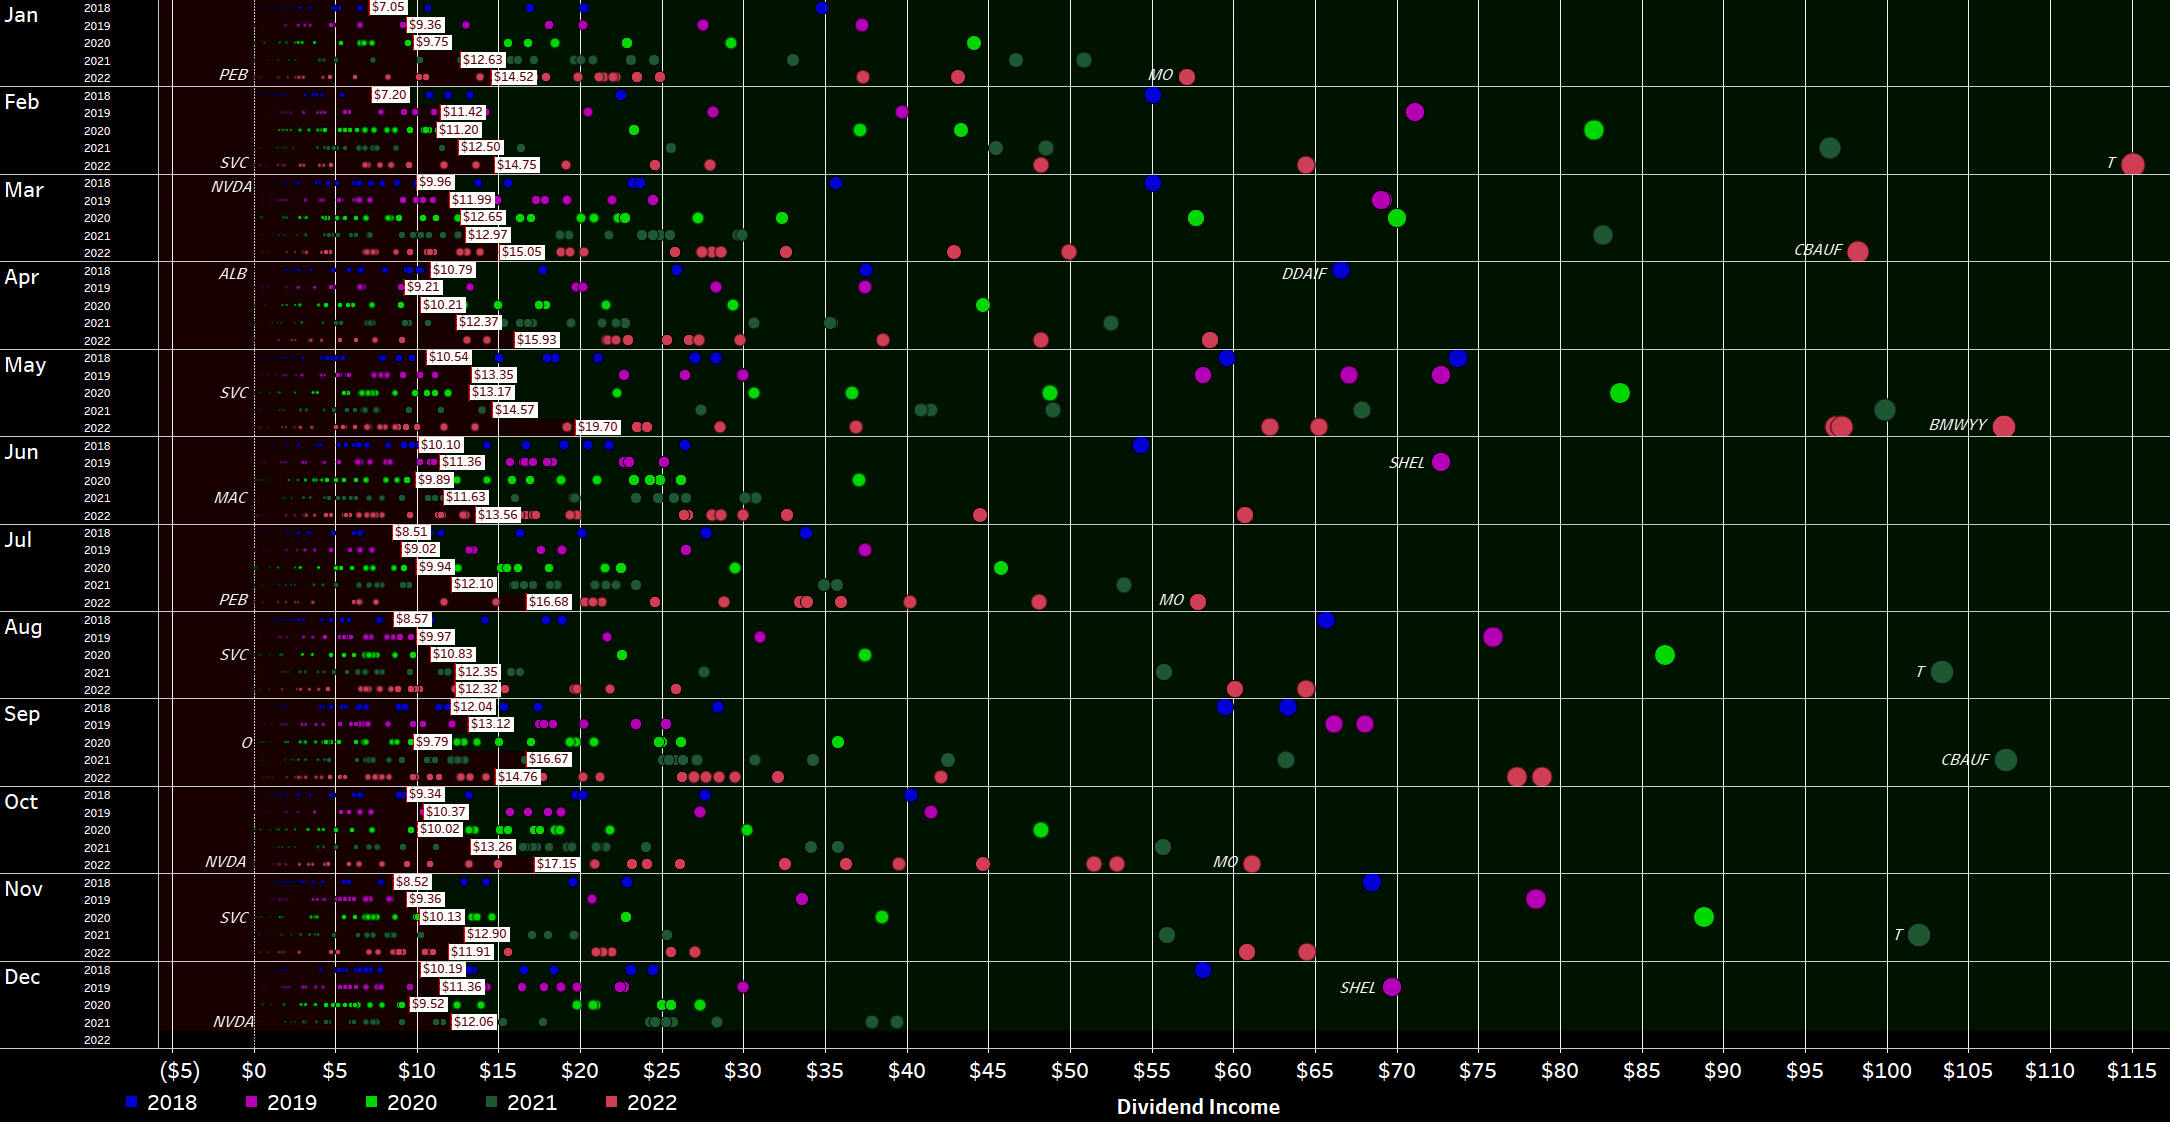
By plotting the data in this way, we can easily see the distribution of dividend payments across different years and gain insights into the overall growth of my dividend income over time.
This visualization is initially quite cluttered, but it contains a wealth of information. It shows every individual dividend payment I have received since I began my investment journey in 2015, represented as a circle that is colored and sized according to its contribution. The view is organized by month and year, allowing for a more comprehensive analysis of the development of my dividend income over time. For each year and month, a white rectangle indicates the average monthly dividend. The area where dividends fall below the average is filled in dark red, while the area above the average is colored dark green. I greatly prefer this redesigned version of my old “bubbles chart” because it makes it much easier to identify trends and developments in my dividend income. This type of data visualization allows for a detailed examination of the distribution of my dividend payments over time and enables me to more easily identify trends and patterns in my income growth.
November 2022 Dividends (Designed by author)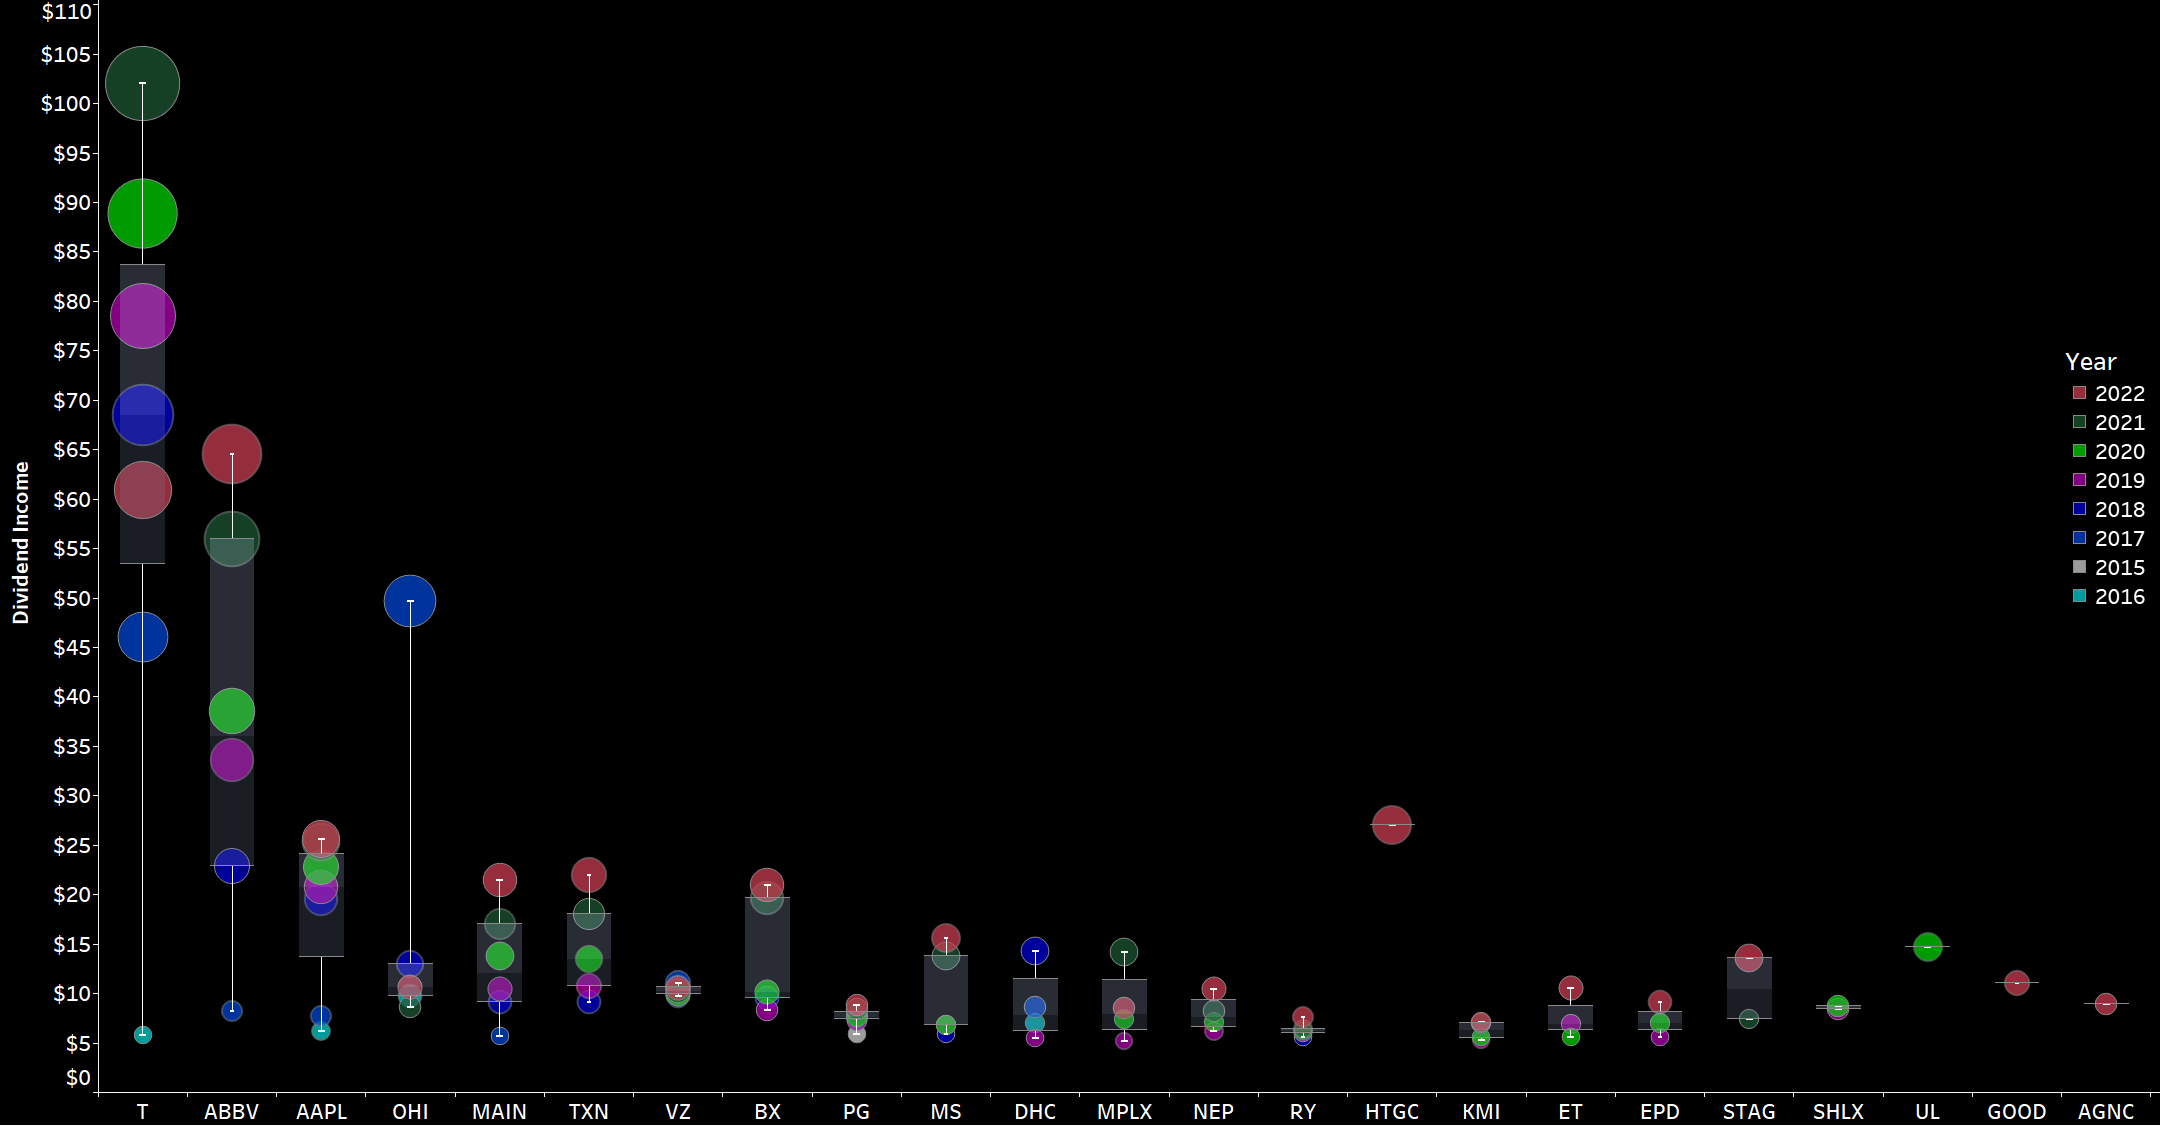
Now, zooming in on November, we can immediately see a number of big green circles in a sea of black. The bigger the circle and the bigger the distance to the previous circle for the same stock, the bigger is the change in dividend income compared to the prior years.
The importance of Hercules Capital is clear, with a reddish circle indicating the first year with dividend income from the company. I expect this circle to continue moving upward and potentially surpass the income from AbbVie and the record income from AT&T in 2021.
Overall, I aim to see as many big red circles at the top of the scale as possible, as this indicates rising dividend income. .
Another way to express the monthly dividend income is in terms of Gifted Working Time (GWT). Assuming an average hourly rate of $30.8 for 2022, my GWT and annual net dividends have been as follows:
- 2018: 121 hours GWT, $3,000 in annual net dividends
- 2019: 142 hours GWT, $3,600 in annual net dividends
- 2020: 152 hours GWT, $3,800 in annual net dividends
- 2021: 180 hours GWT, $5,050 in annual net dividends
- 2022: Targeting at least 179 hours GWT, $5,500 in annual net dividends
I expect overall GWT to decrease in 2022 due to higher calculated hourly rates, as I project a 10% increase in the hourly rate due to inflation. My initial target for the year was conservative, as I needed more visibility into how the year was progressing, particularly with ongoing monthly investments expected to decline due to elevated stock levels and rising inflationary and geopolitical pressures.
Across the years, my YTD Dividend Race has been as follows:
- 2018: Disappointing
- 2019: Phenomenal, benefiting from a low baseline in the prior year
- 2020: Fairly disappointing
- 2021: Phenomenal
- 2022: Targeting a conservative high single-digit growth rate
At this stage by the end of November I have already reached my annual goal with realized net dividends of $5,745 exceeding the goal of $5,500 in net dividends.
In November, I reached my annual goal of $5,500 in net dividends, with realized net dividends of $5,745. With one month remaining, I expect to earn at least $550 in net dividends, surpassing my next milestone of $6,000 and likely ending the year with $6,300 to $6,500 in net dividends. This equates to more than $500 in net dividends per month, which is a significant amount for me and more than enough to pay my soaring utility bills due to the war in Ukraine and its repercussions.
For 2023, I am cautiously targeting the next milestone of $7,000 in net dividends, which would require around 15% growth in dividend income.
YTD Dividend Growth (Designed by author)
I have updated the YTD Dividend Race chart to show the development of YTD dividend income on a daily basis, allowing us to see that most of my dividend income is generated mid-month and towards the end of the month. The chart also breaks down the development by month for the current year, making it easy to identify significant jumps in income. The old format of the chart is shown in the top left.
YTD Dividend Race (Designed by author)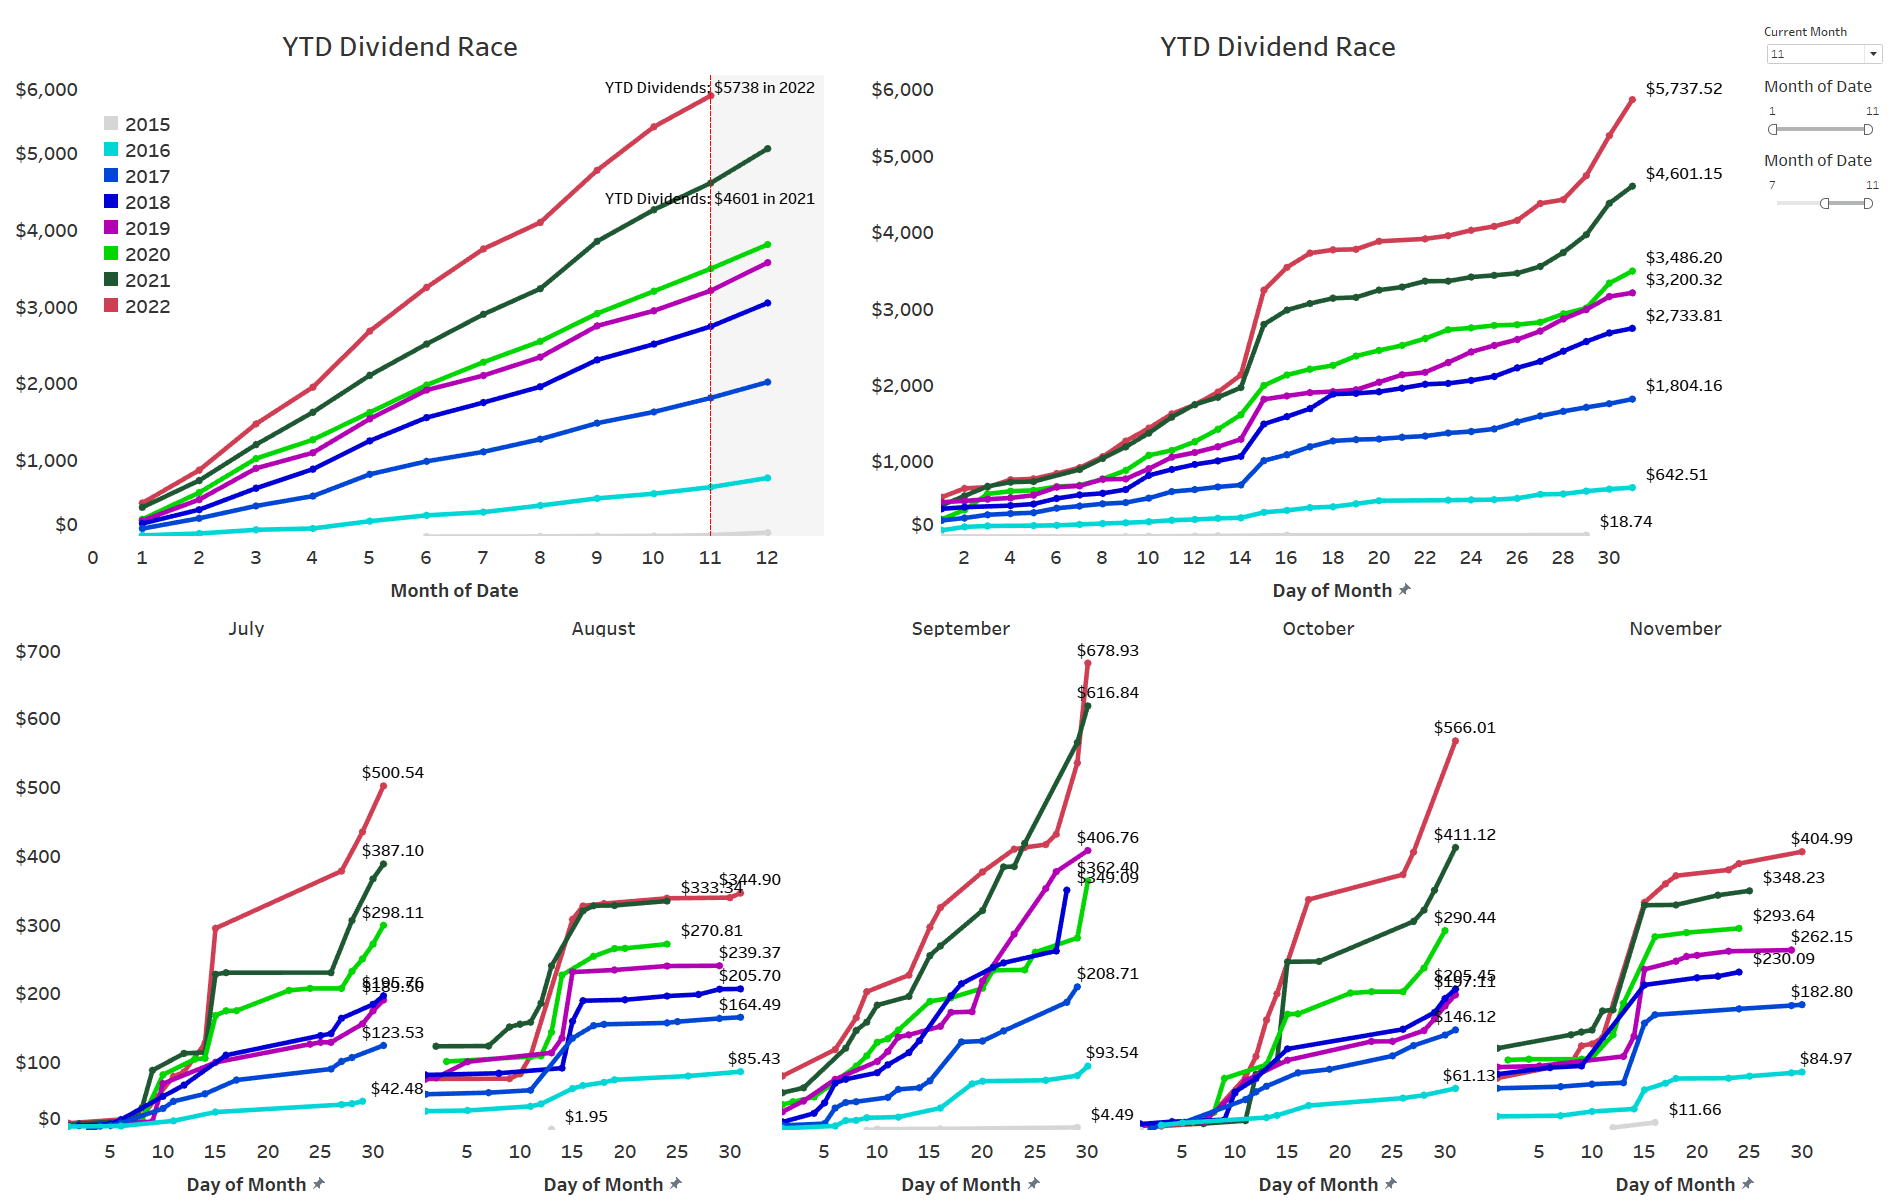
Expressed in GWT, it presents itself as follows:
Gifted Working Time (Designed by author)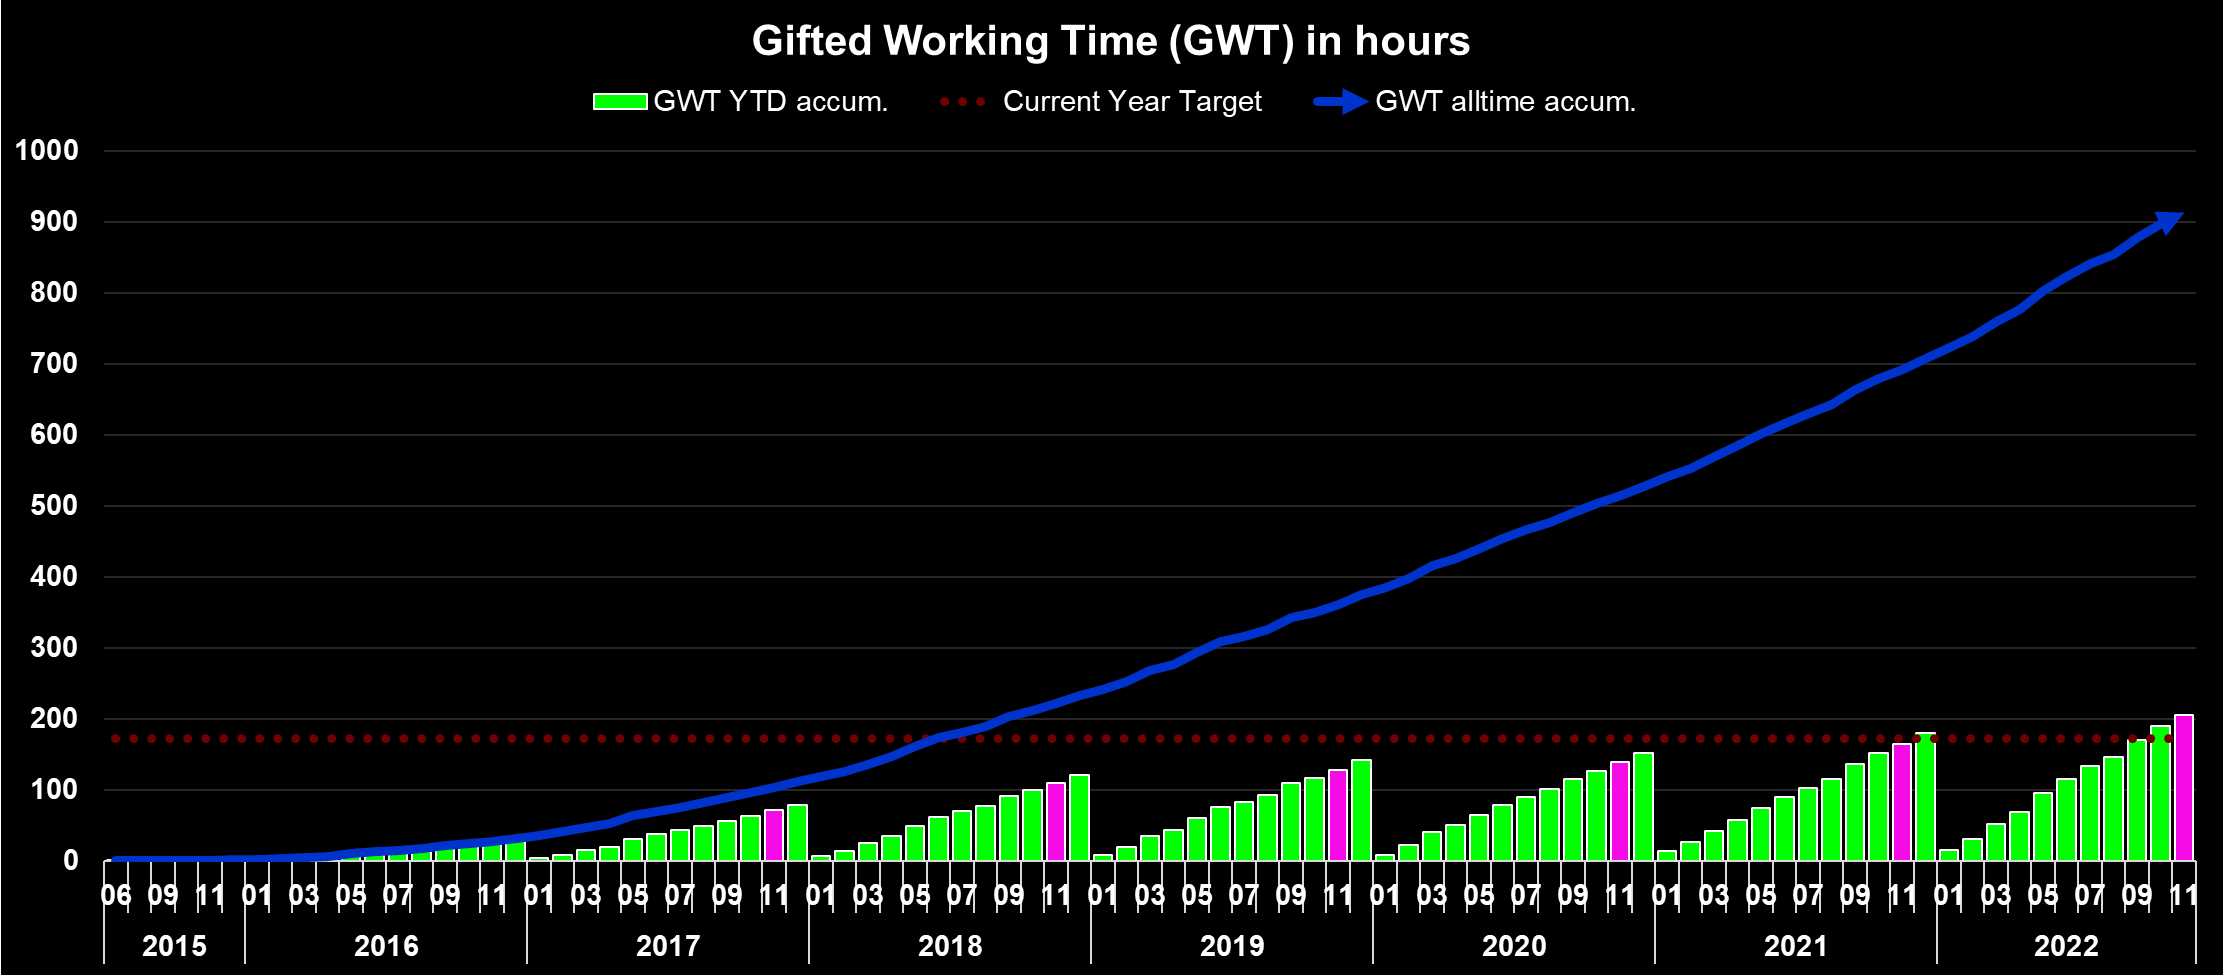
What this shows is as follows:
- All time (blue area) – Around 912 hours, or 114 days, of active work have been replaced with passive income since the start of my dividend journey. Assuming a five-day workweek this translates into almost 23 weeks of vacation funded via dividends.
- YTD (green bars) – Around 205 hours, or 25.6 days, of active work have been replaced with passive income in 2022 already, which equals more than 5 weeks’ worth of active work funded via dividends.
- Highlighted in pink is the accumulated YTD total at the end of the current reporting month (November).
This visualization allows us to see the overall impact of my dividend income on the amount of active work I am able to replace with passive income. It also enables us to see the progress made year-to-date, as well as the accumulated total at the end of the current reporting month.
Upcoming December Dividends
With December marking the end of the quarter, this will traditionally be a strong month in terms of dividend income. Among others, further big dividend payers from my portfolio in March are Royal Dutch Shell (SHEL), BP (BP), McDonald’s (NYSE:MCD), Johnson & Johnson (NYSE:JNJ), Southern Company (NYSE:SO) and Ares Capital Corporation (ARCC) of which 4 companies are part of my regular monthly savings plans.
Many of those are part of my monthly savings plans and thus there should be some solid growth in dividend income despite the heavy dividend cuts from Shell, BP and Wells Fargo although all three of them have already reverted back to growing their dividend, especially Wells Fargo which simply doubled its dividend.
The snapshot below is taken from my newly and free-for-all released Dividend Calendar (make sure to follow instructions in the video) and shows my expected dividend payments in December.
My Dividend Calendar (Designed by author)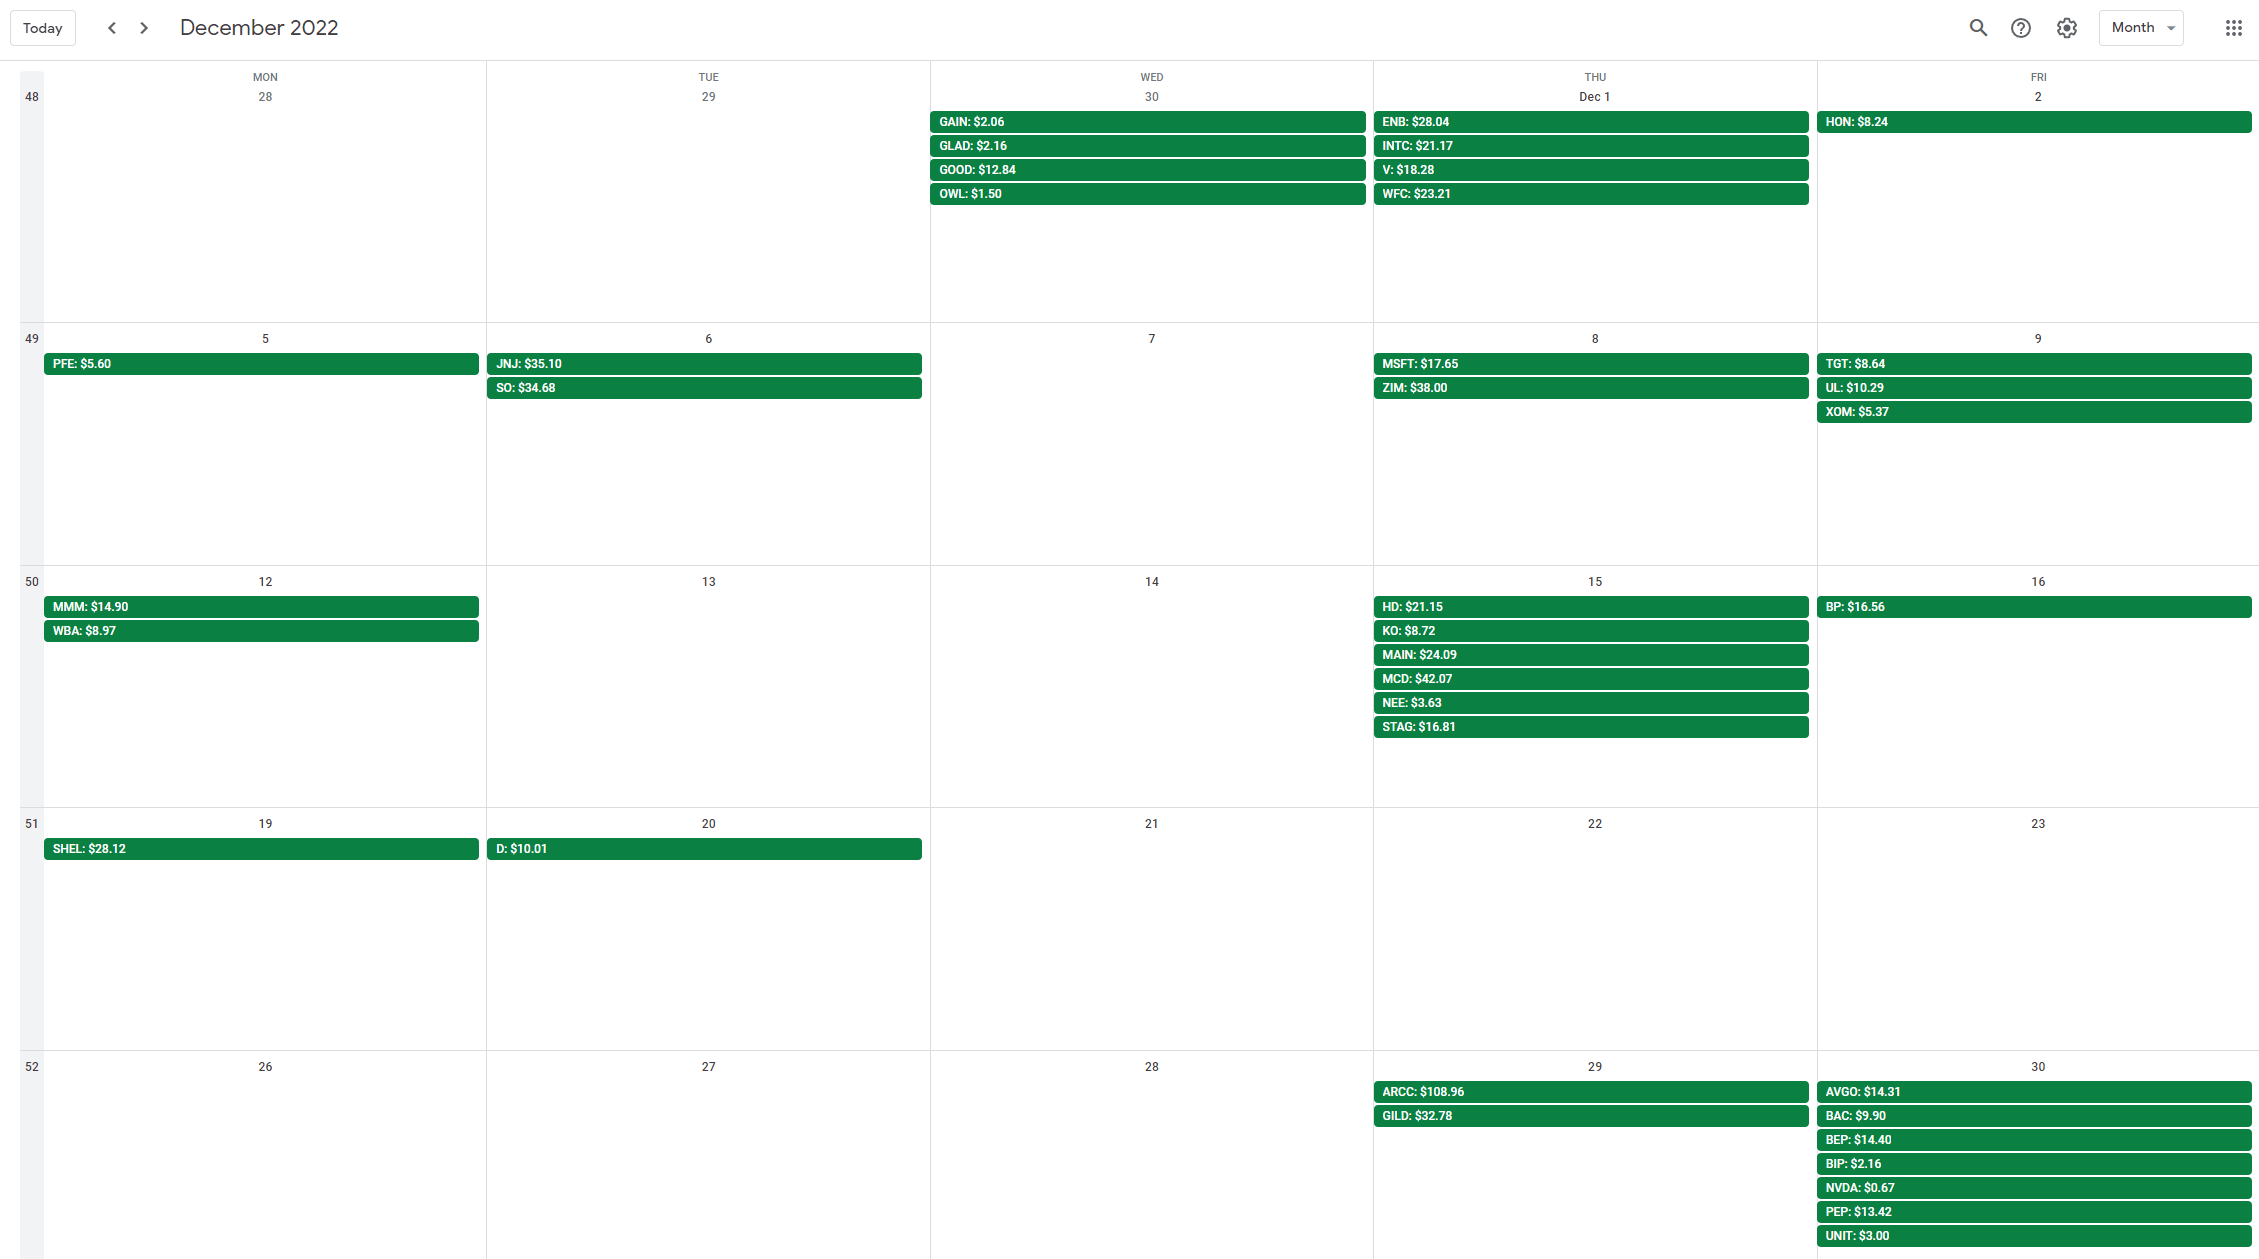
At the end of November, my dividend portfolio is composed as follows:
| Company Name | Ticker | % Market Value | Market Value (€) |
| Apple Inc. | (AAPL) | 11.56% | 21,298 |
| Visa Inc | (V) | 4.14% | 7,622 |
| AbbVie Inc | (ABBV) | 4.11% | 7,579 |
| McDonald’s Corp | (MCD) | 3.60% | 6,625 |
| Microsoft Corporation | (MSFT) | 3.42% | 6,297 |
| Commonwealth Bank of Australia | (OTCPK:CBAUF) | 2.80% | 5,157 |
| Johnson & Johnson | (JNJ) | 2.76% | 5,095 |
| Cisco Systems, Inc. | (CSCO) | 2.71% | 4,993 |
| W.P. Carey | (WPC) | 2.43% | 4,481 |
| Ares Capital Corporation | (ARCC) | 2.25% | 4,145 |
| Shell | (SHEL) | 2.21% | 4,066 |
| AT&T Inc. | (T) | 2.17% | 3,996 |
| Main Street Capital Corporation | (MAIN) | 2.04% | 3,764 |
| Stag Industrial Inc | (STAG) | 1.95% | 3,586 |
| Texas Instruments Incorporated | (TXN) | 1.94% | 3,579 |
| Southern Co | (SO) | 1.82% | 3,362 |
| Altria Group Inc | (MO) | 1.81% | 3,342 |
| Wells Fargo & Co | (WFC) | 1.80% | 3,310 |
| Home Depot | (HD) | 1.78% | 3,278 |
| JPMorgan Chase & Co. | (JPM) | 1.74% | 3,206 |
| Toronto-Dominion Bank | (TD) | 1.68% | 3,104 |
| Gilead Sciences, Inc. | (GILD) | 1.61% | 2,976 |
| Medical Properties Trust | (MPW) | 1.49% | 2,737 |
| Bank of Nova Scotia | (BNS) | 1.48% | 2,728 |
| Allianz SE | (OTCPK:ALIZF) | 1.32% | 2,425 |
| Siemens Healthineers | (OTCPK:SEMHF) | 1.22% | 2,250 |
| Blackstone Group LP | (BX) | 1.15% | 2,127 |
| NVIDIA Corporation | (NVDA) | 1.13% | 2,073 |
| PepsiCo, Inc. | (PEP) | 1.05% | 1,938 |
| Morgan Stanley | (MS) | 1.01% | 1,860 |
| Broadcom Inc | (AVGO) | 0.92% | 1,692 |
| Procter & Gamble Co | (PG) | 0.90% | 1,650 |
| BMW | (OTCPK:BMWYY) | 0.89% | 1,633 |
| Intel Corporation | (INTC) | 0.87% | 1,605 |
| BP1 | (BP) | 0.85% | 1,573 |
| Enbridge | (ENB) | 0.85% | 1,557 |
| BP2 | (BP) | 0.83% | 1,533 |
| Philip Morris International Inc. | (PM) | 0.82% | 1,514 |
| Store Capital | (STOR) | 0.77% | 1,428 |
| Gladstone Commercial Corporation | (GOOD) | 0.77% | 1,426 |
| Bank of America Corp | (BAC) | 0.77% | 1,414 |
| Brookfield Renewable Partners | (BEP) | 0.77% | 1,413 |
| Honeywell International Inc. | (HON) | 0.77% | 1,411 |
| Starwood Property Trust, Inc. | (STWD) | 0.73% | 1,339 |
| Target Corporation | (TGT) | 0.68% | 1,247 |
| Realty Income Corp | (O) | 0.65% | 1,190 |
| Daimler | (DDAIF) | 0.64% | 1,180 |
| Annaly Capital Management | (NLY) | 0.63% | 1,152 |
| The Coca-Cola Co | (KO) | 0.60% | 1,109 |
| 3M Co | (MMM) | 0.60% | 1,105 |
| NextEra Energy Partners LP | (NEP) | 0.56% | 1,040 |
| Dominion Energy Inc | (D) | 0.54% | 993 |
| Unilever NV ADR | (UL) | 0.53% | 981 |
| CVS Health Corp | (CVS) | 0.53% | 973 |
| Royal Bank of Canada | (RY) | 0.49% | 905 |
| Apple Hospitality REIT | (APLE) | 0.49% | 903 |
| Stryker | (SYK) | 0.48% | 892 |
| Verizon Communications Inc. | (VZ) | 0.45% | 820 |
| B&G Foods, Inc. | (BGS) | 0.41% | 748 |
| Canadian Imperial Bank of Commerce | (CM) | 0.38% | 699 |
| Medtronic | (MDT) | 0.38% | 697 |
| NextEra Energy | (NEE) | 0.36% | 672 |
| Hercules Capital | (HTGC) | 0.35% | 645 |
| Sino AG | (XTP.F) | 0.33% | 616 |
| Exxon Mobil Corporation | (XOM) | 0.33% | 615 |
| Pfizer Inc. | (PFE) | 0.33% | 605 |
| Walgreens Boots Alliance Inc | (WBA) | 0.32% | 588 |
| BASF | (OTCQX:BASFY) | 0.31% | 571 |
| ZIM Integrated Shipping Services | (ZIM) | 0.31% | 568 |
| Antero Midstream Corporation | (AM) | 0.30% | 556 |
| Spirit Realty Corporation | (SRC) | 0.30% | 548 |
| AGNC Investment Corporation | (AGNC) | 0.30% | 544 |
| Kinder Morgan Inc | (KMI) | 0.29% | 531 |
| Enterprise Products Partners L.P. | (EPD) | 0.26% | 486 |
| General Electric Company | (GE) | 0.25% | 463 |
| Alibaba Group Holding Ltd | (BABA) | 0.23% | 415 |
| Apollo Commercial Real Est. Finance Inc | (ARI) | 0.22% | 401 |
| Apollo Investment | (MFIC) | 0.20% | 367 |
| Energy Transfer Partners | (ET) | 0.20% | 366 |
| Omega Healthcare Investors Inc | (OHI) | 0.20% | 363 |
| Colgate-Palmolive Company | (CL) | 0.19% | 355 |
| MPLX LP | (MPLX) | 0.19% | 354 |
| Sixt | (OTC:SXTSY) | 0.19% | 348 |
| BRT Realty Trust | (BRT) | 0.18% | 335 |
| Mastercard | (MA) | 0.17% | 319 |
| Bayer AG | (OTCPK:BAYZF) | 0.15% | 285 |
| Vonovia | (OTCPK:VONOY) | 0.13% | 237 |
| Brookfield Infrastructure Partners L.P. | (BIP) | 0.12% | 213 |
| Blue Owl Capital | (OWL) | 0.08% | 141 |
| Uniti Group Inc | (UNIT) | 0.07% | 138 |
| Fresenius SE | (OTCPK:FSNUF) | 0.07% | 121 |
| Equitrans Midstream Corporation | (ETRN) | 0.06% | 115 |
| Walt Disney Co | (DIS) | 0.05% | 100 |
| Boeing | (BA) | 0.05% | 98 |
| Bank of Montreal | (BMO) | 0.05% | 88 |
| Newtek Business Services | (NEWT) | 0.05% | 83 |
| The GEO Group Inc | (GEO) | 0.03% | 60 |
| Fresenius Medical Care | (FMS) | 0.03% | 56 |
| Diversified Healthcare Trust | (DHC) | 0.02% | 40 |
| Service Properties Trust | (SVC) | 0.02% | 28 |
Be the first to comment