

gesrey
The markets had a great week as the S&P 500 increased by 2.56% and the Nasdaq appreciated by 2.12%, fueled by a strong job market and declining inflation. The Dividend Harvesting portfolio has officially snapped the 6-week losing streak and has strung together 3 consecutive weeks of finishing in the black. To date, I have invested $100 per week into income-producing assets. After allocating $7,600, the Dividend Harvesting portfolio’s balance is $7,904.46, up 4.01%, and is generating a projected $542.41 in annual dividends, which is a 6.86% portfolio yield, or a 7.14% yield on invested capital. Over time, I believe this series will prove you can take advantage of dividend investing without a large amount of seed capital. The most important part, in my opinion, just like saving for retirement, is to create a plan and stick with it. There are many investment theories, and there isn’t one correct answer for every investor. I hope that one of the takeaways from this series is that anybody can start an investment portfolio, no matter what side of the income scale you find yourself on, and have your money work for you. Over the past 76 weeks, the Dividend Harvesting portfolio has finished in the black 89.47% (68/76) of the time and has delivered on its 3 investment goals of generating a continuous stream of income, mitigating downside risk, and achieving low levels of capital appreciation.
In week 76, I utilized the $100 in allocated capital to increase my positions in the Altria Group (MO), Ares Capital (ARCC), PIMCO Dynamic Income Fund (PDI), and The Global X Alternative Income ETF (ALTY). In week 76, the Dividend Harvesting portfolio produced 3 dividends which generated $1.90 in income, bringing 2022’s collected dividend income to a total of $249.79, which is an average of $7.81 per week or $33.31 per month (figuring 7.5 months have passed). The Dividend Harvesting portfolio generates weekly income, and every dividend is reinvested back into its original position. I have built a broad investment mix that includes individual equities, exchange-traded funds (ETFs), closed-end funds (CEFs), and exchange-traded notes (ETNs). I am looking forward to the Dividend Harvesting portfolio’s progression and seeing the impacts of the snowball effect in several years.
Steven Fiorillo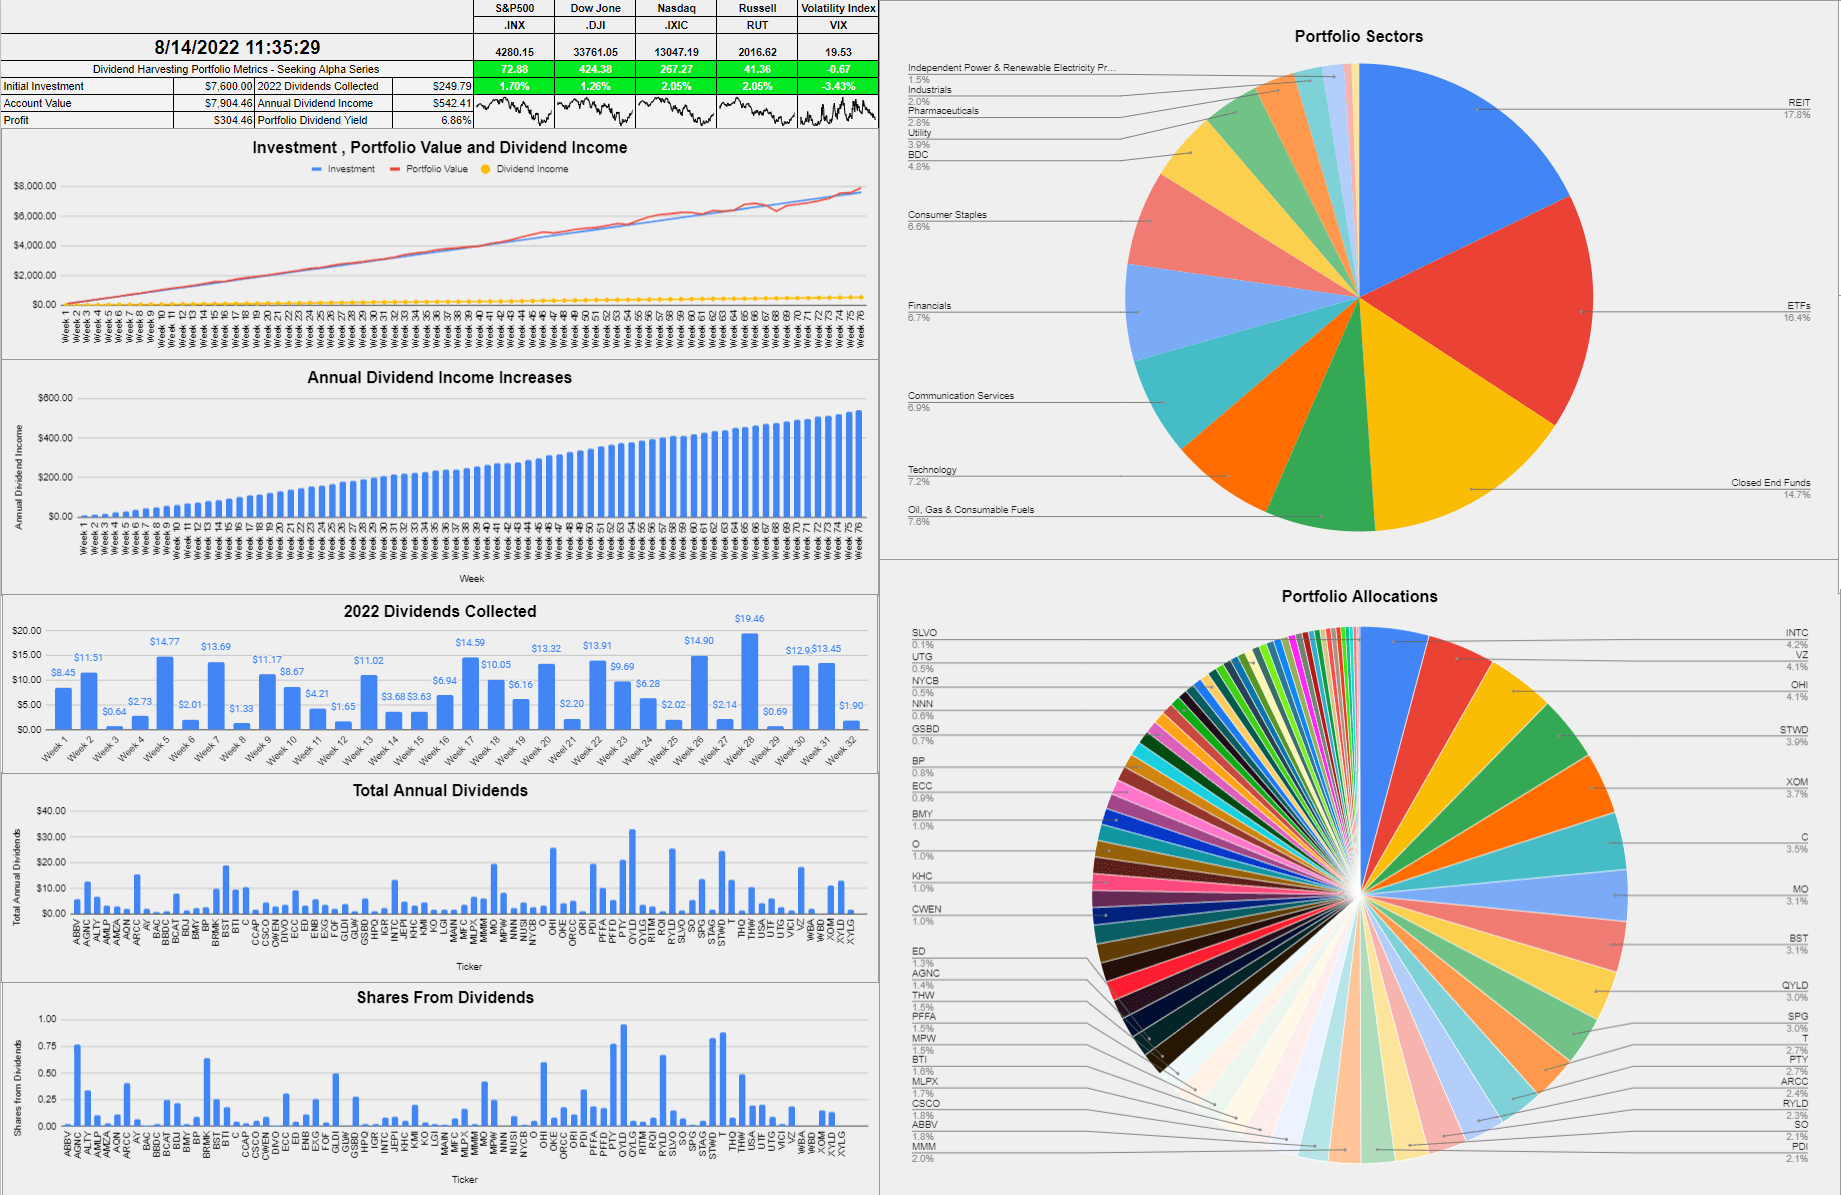
I allocate capital toward big tech, funds, dividends, and growth outside of my retirement accounts. These are not my only investments, but I did open a separate account, so I could easily track and document this series. I intentionally created broad diversification throughout the Dividend Harvesting portfolio so I could benefit from sector rotations and mitigate my downside risk. Investors who are too exposed to growth companies or large-cap tech have gotten crushed as the investment landscape changes. On the growth and tech side of my investments, I am feeling the pain as some of my favorite companies, including Alphabet (GOOGL) (GOOG), Amazon (AMZN), and Meta Platforms (META), have been taken to the woodshed.
I am going to address a question that continues to surface. I am not trying to beat the market with this portfolio. I love index funds and am invested in several index funds. I love dividend investing due to the stream of cash flow it generates. I don’t want 100% of my assets outside of real estate tied to an S&P index fund. I have created a personal investment strategy that works to achieve my investment goals, and having a stream of income generated from dividends is part of my investment strategy. Low-cost index funds are one of the best investments anyone can make in my opinion, and the Dividend Harvesting portfolio is not meant to be a substitute for an index fund. I have read many questions about dividend investing and wanted to start a portfolio from the ground up and document its progress to disprove many misconceptions, including that you need a large amount of seed capital to make dividend investing work for you.
This series has never been about hitting a target yield, generating a certain amount of profit, or beating the market. I had two specific goals with this series. The first was to create a blueprint for constructing a dividend portfolio by documenting the journey starting from the beginning. The second goal was to illustrate how allocating capital each week toward investing, regardless of the amount, would be beneficial in the long run.
Too many people are under the illusion that you need tens of thousands or even hundreds of thousands to benefit from investing. Instead of using my real dividend portfolio as an example, I decided to start a new account, fund it with $100, and add $100 weekly, providing a step-by-step guide to dividend investing. This methodology doesn’t have to be used for dividend investing, and it could be as simple as an S&P index fund or a Total Market fund. Hopefully, this series is inspiring people to invest in their future to attain financial freedom.
A Historical Recap of the Dividend Harvesting Portfolio’s Investment Principles and Historical Performance
Investment Objectives
- Income generation
- Downside mitigation through diversification
- Capital appreciation
Below are the fundamental rules I have put in place for this Portfolio:
- Allocate $100 weekly to this Portfolio
- Only invest in dividend-producing investments
- No position can exceed 5% of the Portfolio
- No sector can exceed 20% of the Portfolio
- All dividends & distributions are to be reinvested
Below is a chart that extends from week 1 through the current week to illustrate the Dividend Harvesting Portfolio’s Progression
- Blue line is my initial investment $100 in week 1, $1,000 in week 10, etc.
- Red line is the account value at the end of each week
- Yellow line is the annual dividend income the Dividend Harvesting Portfolio was projected to generate after that week’s investments and dividends reinvested
Steven Fiorillo
The Dividend Harvesting Portfolio Dividend Section
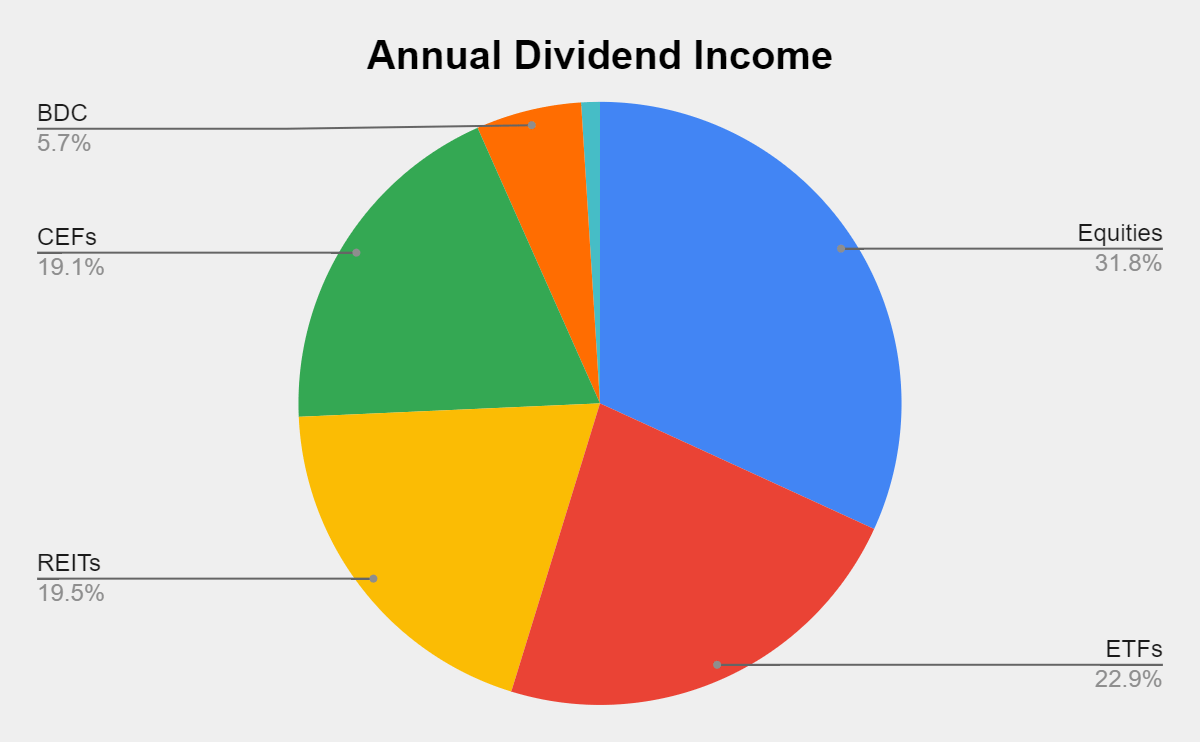
Here is how much dividend income is generated per investment basket:
- Equities $172.69 (31.84%)
- ETFs $124.30 (22.92%)
- REITs $105.97 (19.54%)
- CEFs $103.36 (19.06%)
- BDC $30.66 (5.65%)
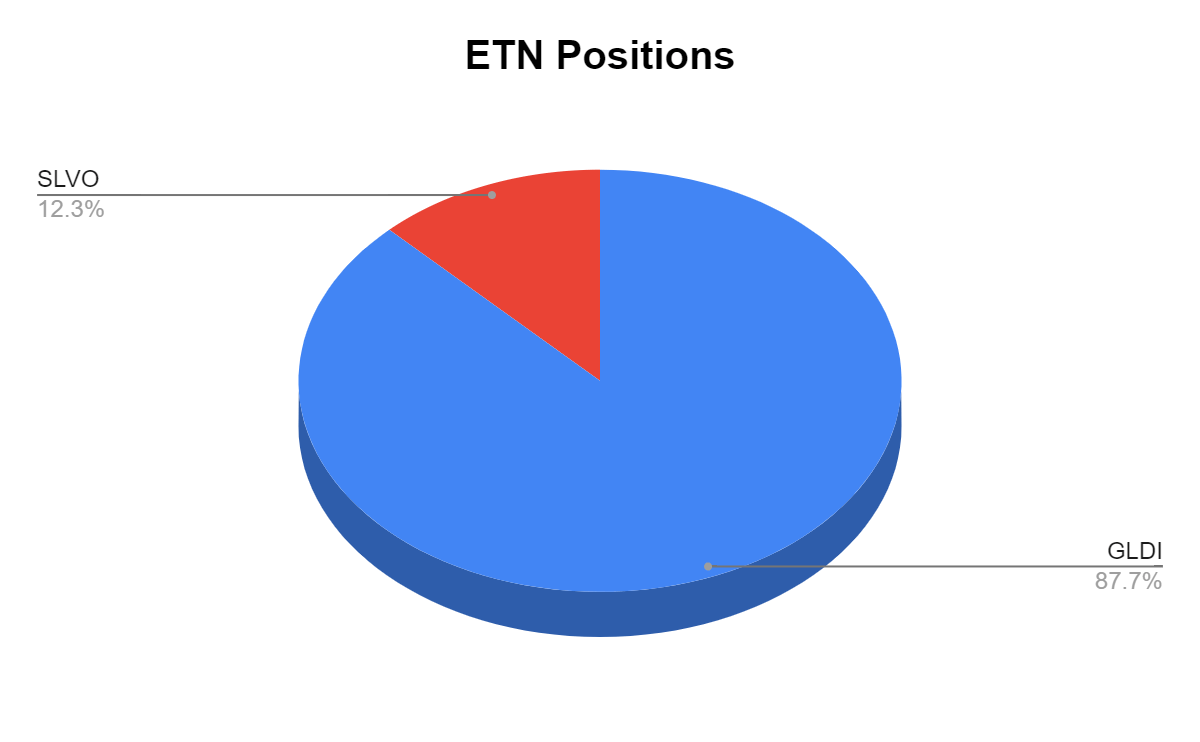
- ETNs $5.43 (1%)
Steven Fiorillo Steven Fiorillo
Collecting dividends can serve many functions in a portfolio. Some investors utilize dividends to supplement their income and live off. I am building a dividend portfolio for myself 30 years into the future. Since I am reinvesting every dividend, they serve multiple purposes today. In 2022 alone, I have collected $249.79 in dividend income from 302 dividends across 32 weeks. This has allowed the Dividend Harvesting portfolio to stay in the black while growing the snowball effect.
These dividends allow me to gain additional equity in my investments while increasing my future cash flow in down markets. This style of investing isn’t for everyone, but if you’re looking to generate consistent cash flow while mitigating downside risk, this method has worked for me. I am hoping to collect between $450-$500 in dividends in 2022, which will be reinvested, and finish the year generating >$700 in annual dividends.
Steven Fiorillo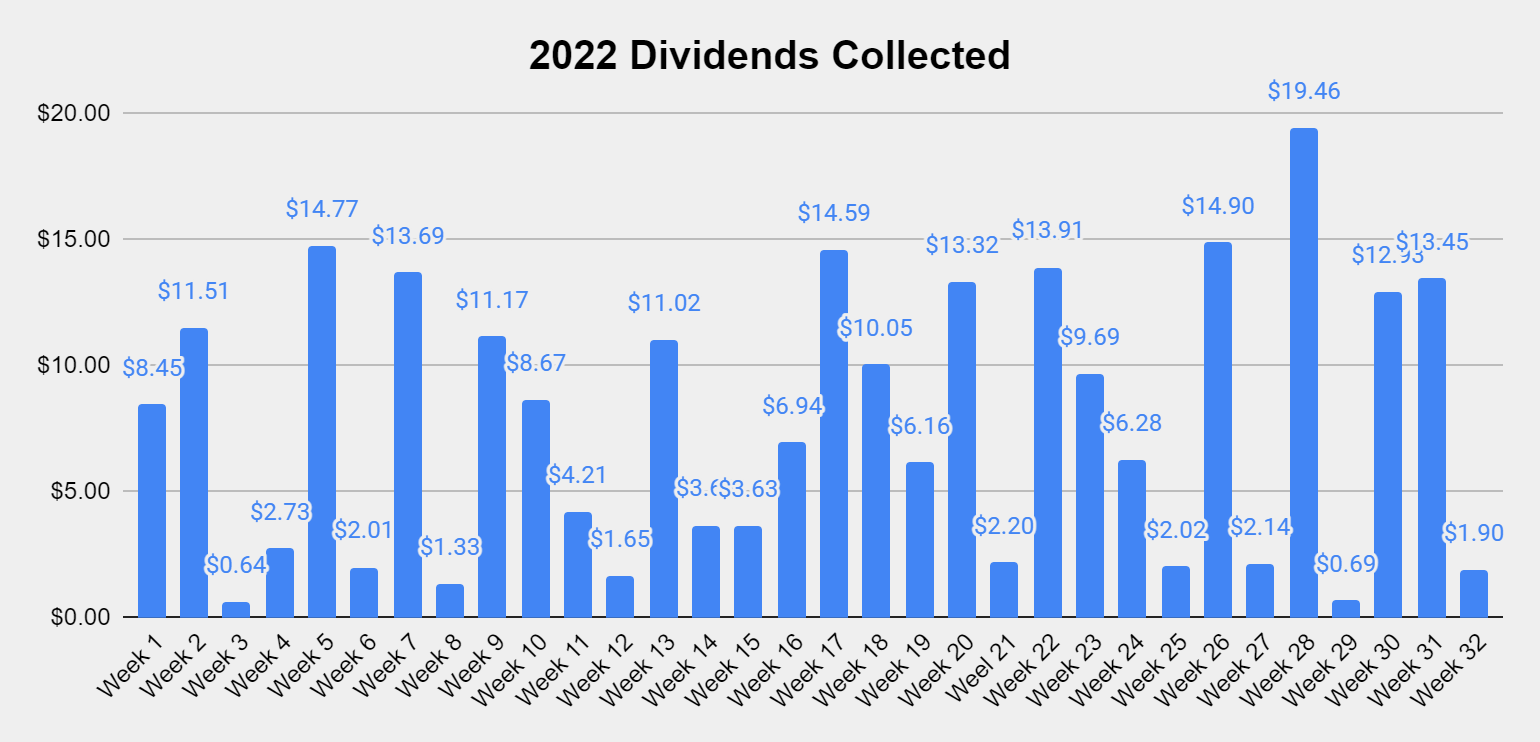
The never-ending stream of dividend income keeps flowing into my account through weekly dividends. After adding WBA and NNN to the Dividend Harvesting portfolio in week 73, there are 584 annual dividends being produced. Each week income comes rolling in, and the snowball effect amplifies little by little.
Steven Fiorillo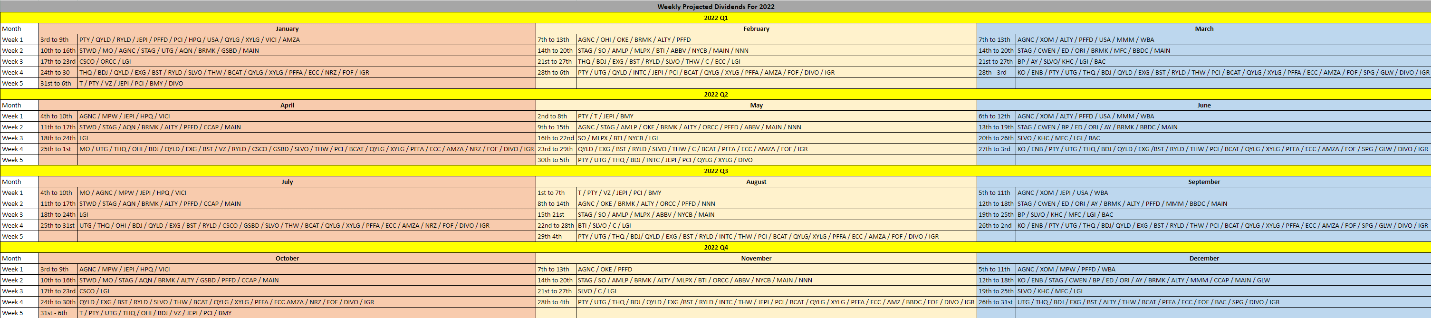
The goal of generating enough income from the dividends to purchase an additional share per year has been the never-ending project of this portfolio. There are now 6 positions that are generating at least 1 share annually through their dividends, which include Starwood Property Trust (STWD), PIMCO Corporate & Income Opportunity Fund (PTY), Broadmark Realty Capital (BRMK), AGNC Investment Corp. (AGNC), the Global X Russell 2000 Covered Call ETF (RYLD), and the Global X NASDAQ 100 Covered Call ETF (QYLD). I am trying to get more of the current positions over the finish line. Eventually, more positions will generate one share per year in dividend income.
With the market’s appreciation, some of the positions in the Dividend Harvesting portfolio have reversed course and fallen into the previous category for shares from dividends annually.
|
Shares from Dividends Annually |
||||||||||
|
0-9.9% |
10-19.99% |
20-29.99% |
30-39.99% |
40-49.99% |
50-59.99% |
60-69.99% |
70-79.99% |
80-89.99% |
90-100% |
Generating > 1 share |
|
DIVO |
C |
XYLD |
EXG |
BCAT |
ALTY |
THW |
OHI |
PDI |
PTY |
|
|
CSCO |
MFC |
IGR |
ORCC |
MPW |
GLDI |
USA |
ARCC |
ECC |
QYLD |
|
|
CCAP |
FOF |
NYCB |
INTC |
BST |
T |
BRMK |
||||
|
AMZA |
MLPX |
KMI |
SLVO |
PFFA |
RYLD |
|||||
|
BBDC |
AQN |
PFFD |
GSBD |
MO |
STWD |
|||||
|
BP |
BDJ |
BTI |
RITM |
VZ |
AGNC |
|||||
|
LGI |
QYLG |
NUSI |
||||||||
|
KHC |
ENB |
UTF |
||||||||
|
JEPI |
SPG |
|||||||||
|
AMLP |
XOM |
|||||||||
|
UTG |
||||||||||
|
CWEN |
||||||||||
|
SO |
||||||||||
|
THQ |
||||||||||
|
RQI |
||||||||||
|
XYLG |
||||||||||
|
OKE |
||||||||||
|
AY |
||||||||||
|
WBA |
||||||||||
|
NNN |
||||||||||
|
STAG |
||||||||||
|
VICI |
||||||||||
|
O |
||||||||||
|
ORI |
||||||||||
|
ABBV |
||||||||||
|
MMM |
||||||||||
|
MAIN |
||||||||||
|
ED |
||||||||||
|
HPQ |
||||||||||
|
BMY |
||||||||||
|
GLW |
||||||||||
|
KO |
||||||||||
|
BAC |
||||||||||
|
WBD |
||||||||||
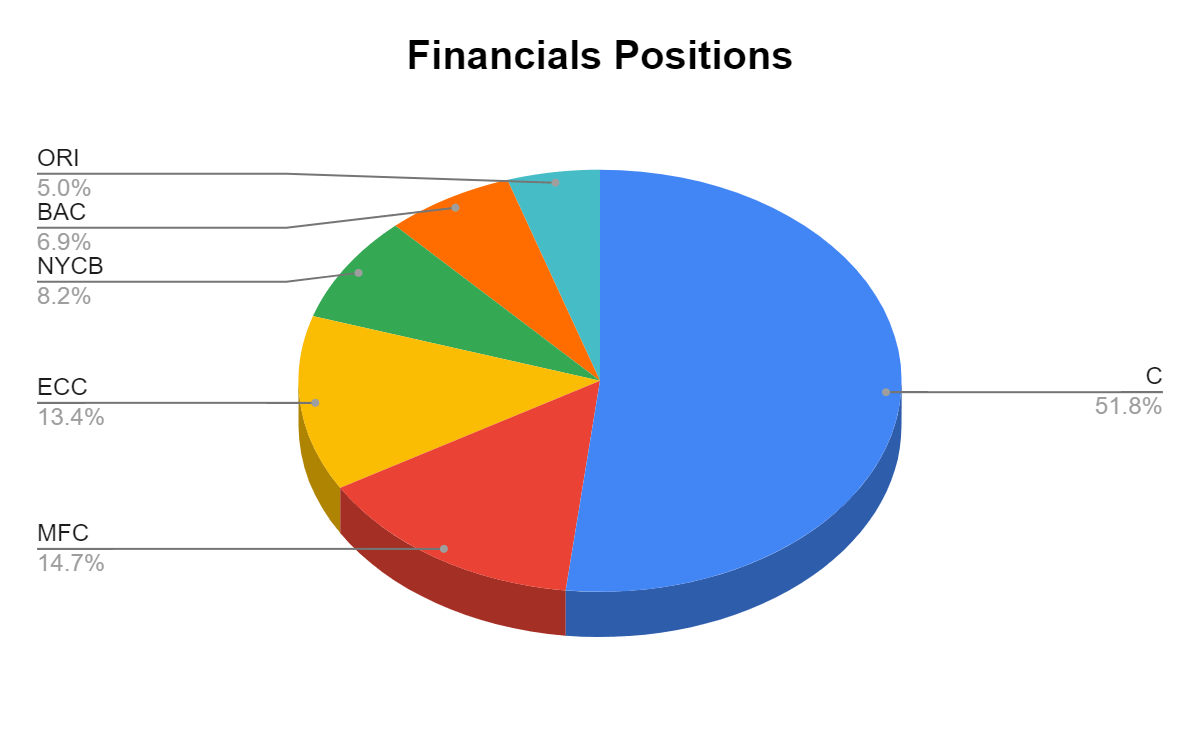
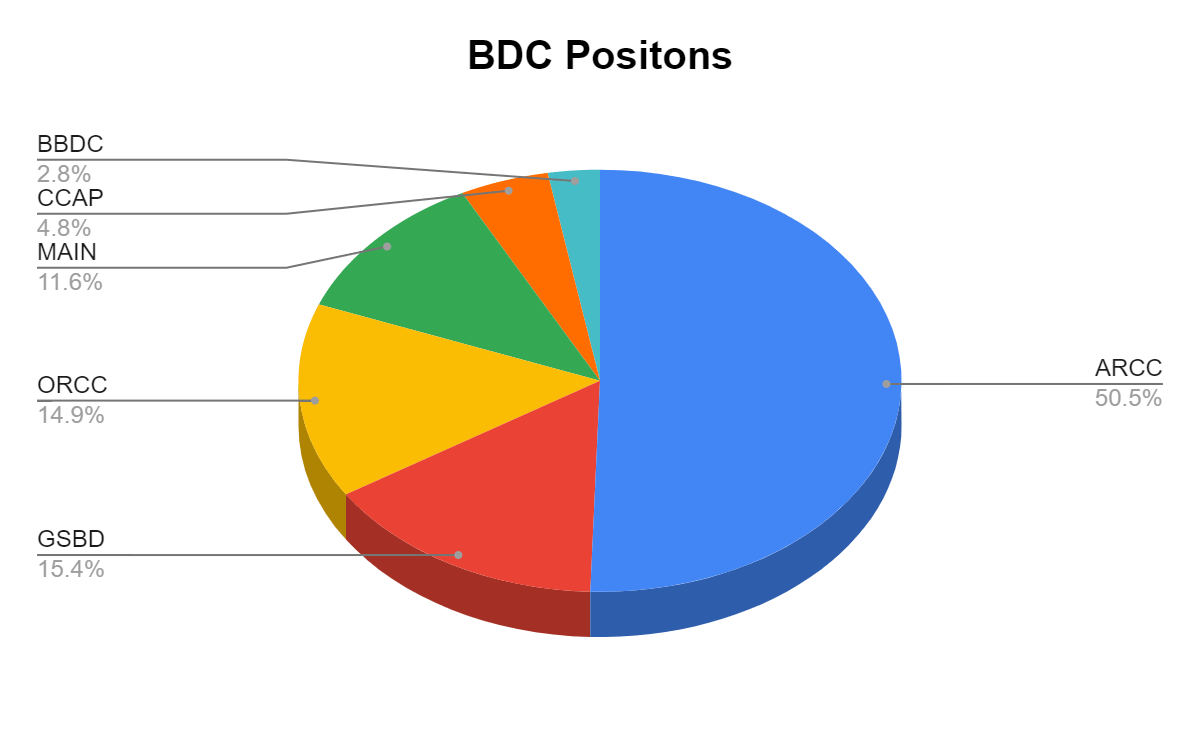
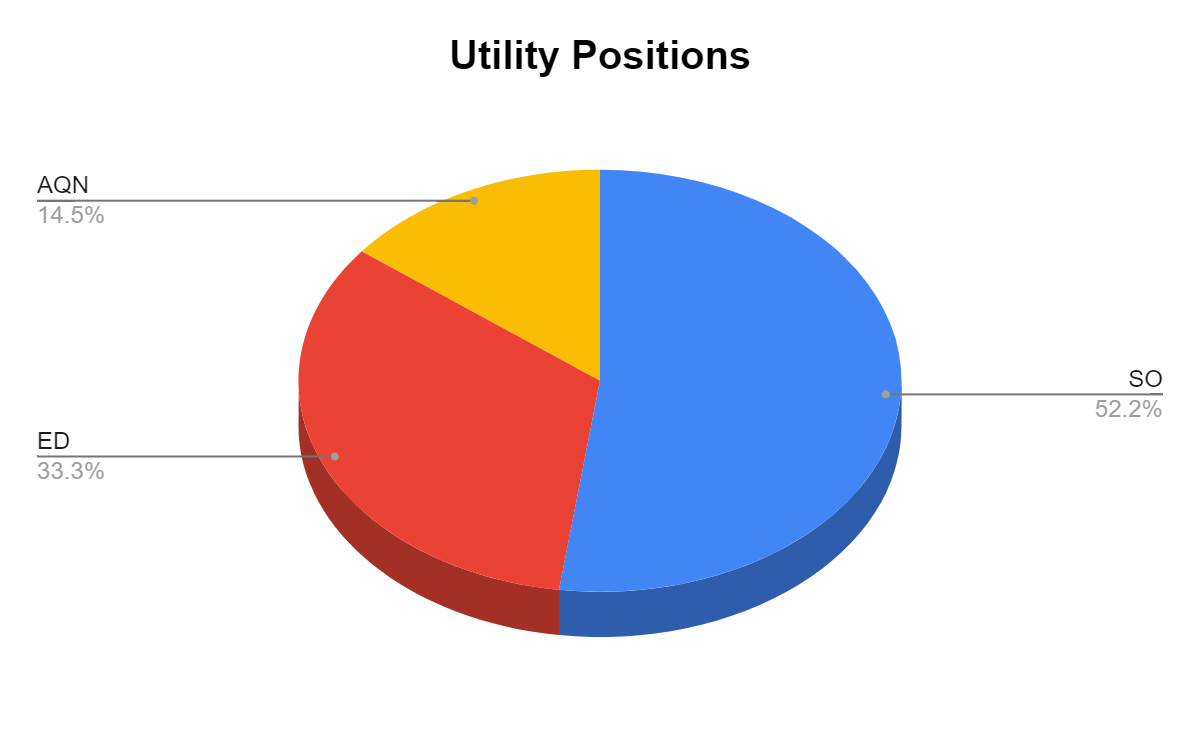
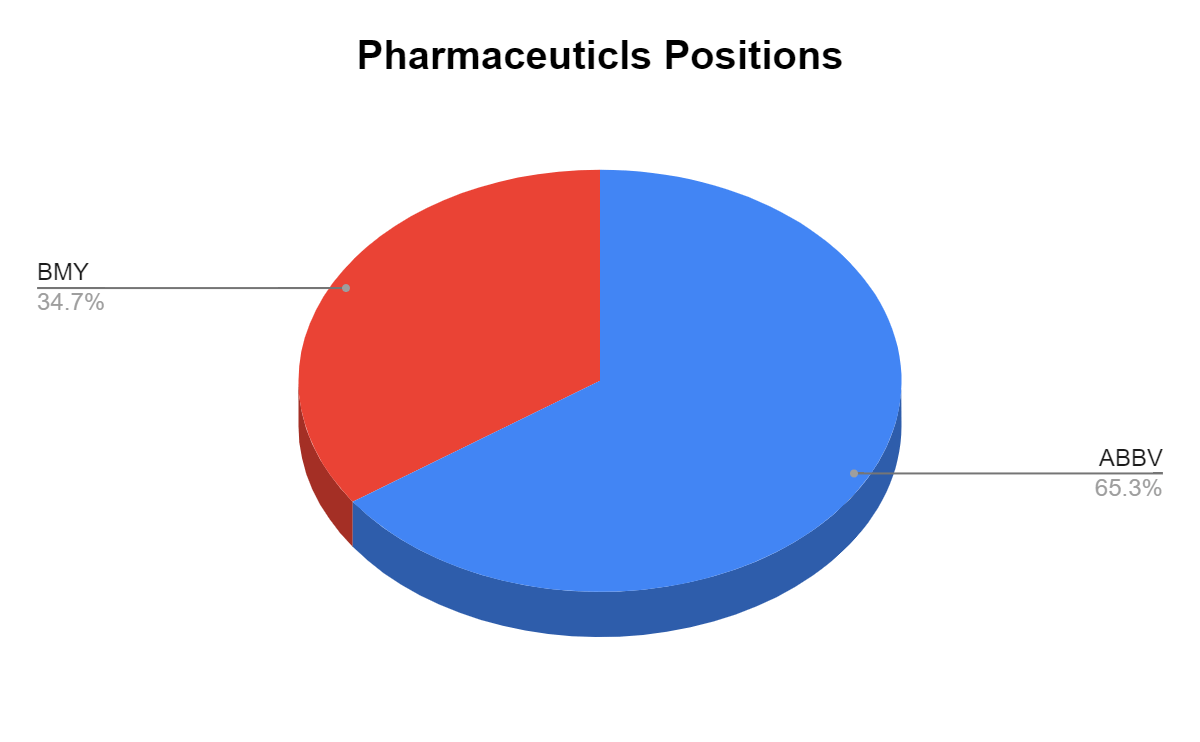
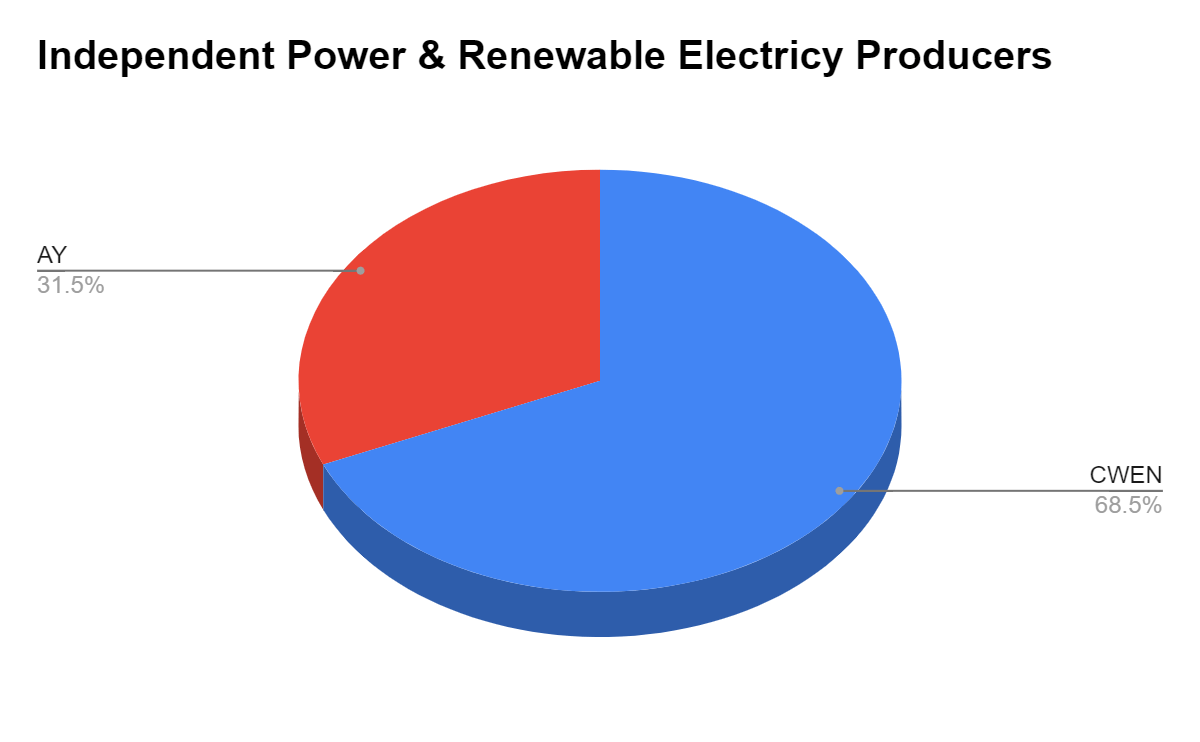
The Dividend Harvesting Portfolio Composition
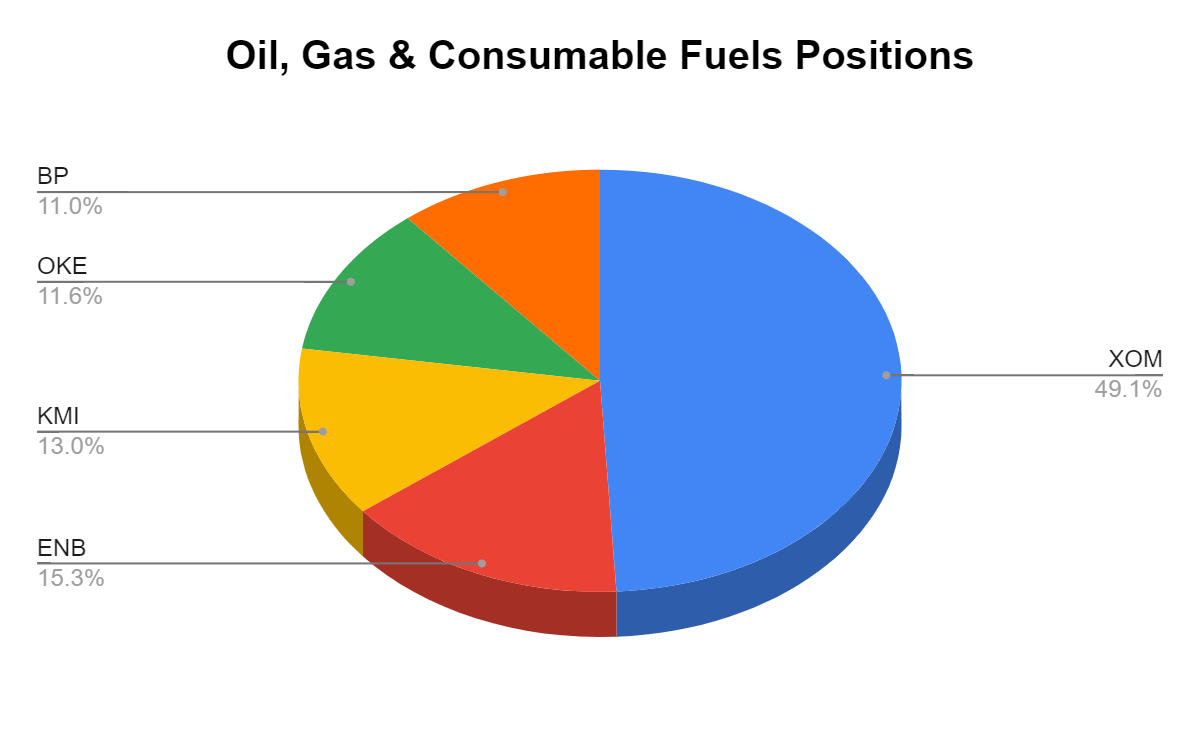
Many of the readers have asked if I could break down the individual positions within these sectors. I created pie charts for each individual sector and have illustrated how much each position represents of that sector of the Dividend Harvesting portfolio. Since I only have 1 position in Food & Staple Retailing and Industrials, I did not make a chart for those. 3M (MMM) and Walgreens Boots Alliance represent 100% of those sectors. The charts will follow the normal portfolio total I have constructed. Please keep the ideas coming, as I am happy to add as much detail to this series as I can.
Steven Fiorillo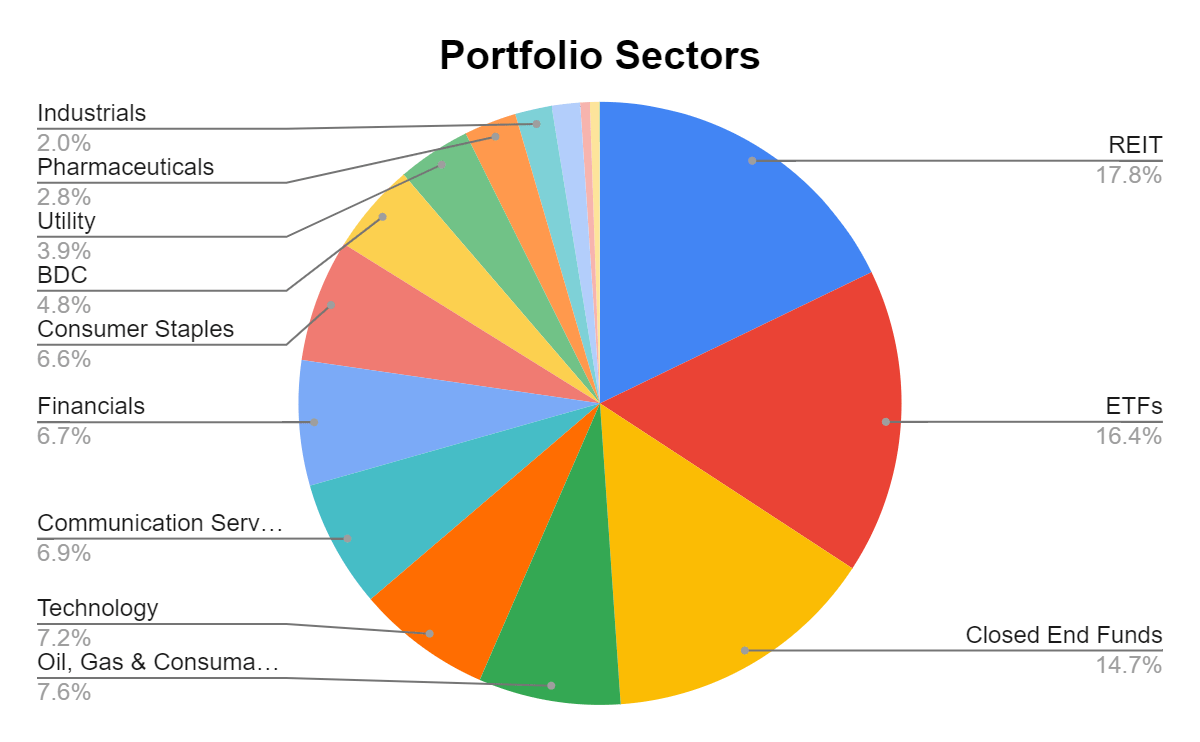
In week 76, REITs remained as the largest sector of the Dividend Harvesting portfolio with a 17.84% portfolio weight, while ETFs maintained 2nd place, accounting for 16.38%. Individual equities make up 45.71% of the portfolio and generate 31.84% of the dividend income, while ETFs, CEFs, REITs, BDCs, and ETNs represent 54.29% of the portfolio and generate 68.16% of the dividend income. I have a 20% maximum sector weight, so when a singular sector gets close to that level, I make sure capital is allocated away from that area to balance things out. In 2022, I will make an effort to even out these portfolio percentages. As more capital is deployed, the bottom half of the portfolio weighting will increase.
|
Industry |
Investment |
Portfolio Total |
% of Portfolio |
|
REIT |
$1,409.81 |
$7,904.46 |
17.84% |
|
ETFs |
$1,294.68 |
$7,904.46 |
16.38% |
|
Closed End Funds |
$1,161.46 |
$7,904.46 |
14.69% |
|
Oil, Gas & Consumable Fuels |
$602.26 |
$7,904.46 |
7.62% |
|
Technology |
$570.77 |
$7,904.46 |
7.22% |
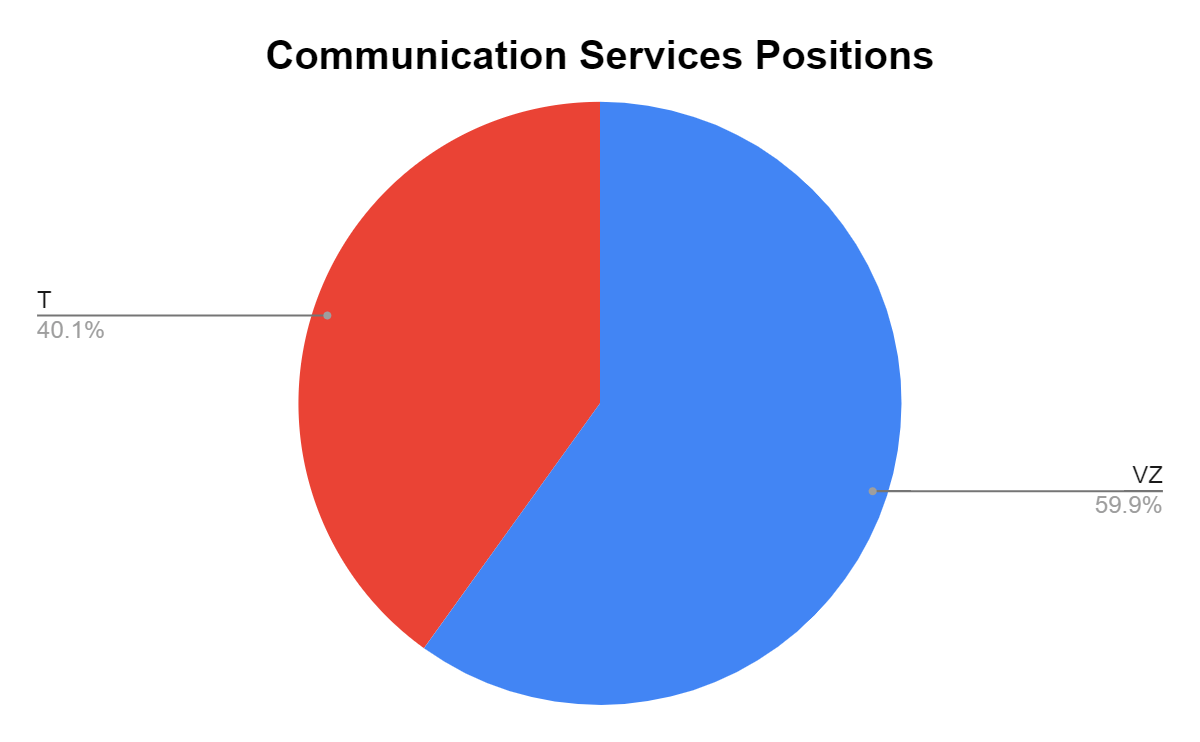
|
Communication Services |
$541.59 |
$7,904.46 |
6.85% |
|
Financials |
$529.45 |
$7,904.46 |
6.70% |
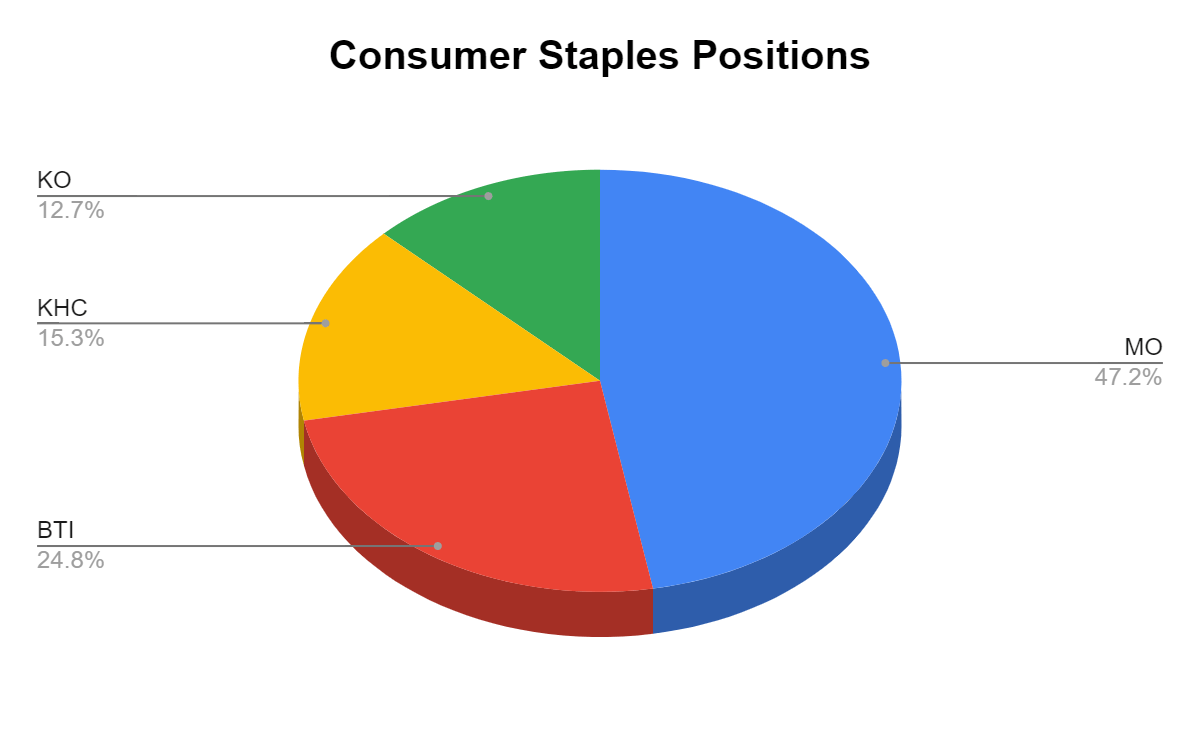
|
Consumer Staples |
$518.83 |
$7,904.46 |
6.56% |
|
BDC |
$383.04 |
$7,904.46 |
4.85% |
|
Utility |
$311.32 |
$7,904.46 |
3.94% |
|
Pharmaceuticals |
$222.54 |
$7,904.46 |
2.82% |
|
Industrials |
$155.44 |
$7,904.46 |
1.97% |
|
Independent Power & Renewable Electricity Producers |
$120.14 |
$7,904.46 |
1.52% |
|
Food & Staple Retailing |
$40.59 |
$7,904.46 |
0.51% |
|
ETN |
$39.71 |
$7,904.46 |
0.50% |
|
Cash |
$2.85 |
$7,904.46 |
0.04% |
Steven Fiorillo
Steven Fiorillo Steven Fiorillo Steven Fiorillo Steven Fiorillo Steven Fiorillo Steven Fiorillo Steven Fiorillo Steven Fiorillo Steven Fiorillo Steven Fiorillo Steven Fiorillo Steven Fiorillo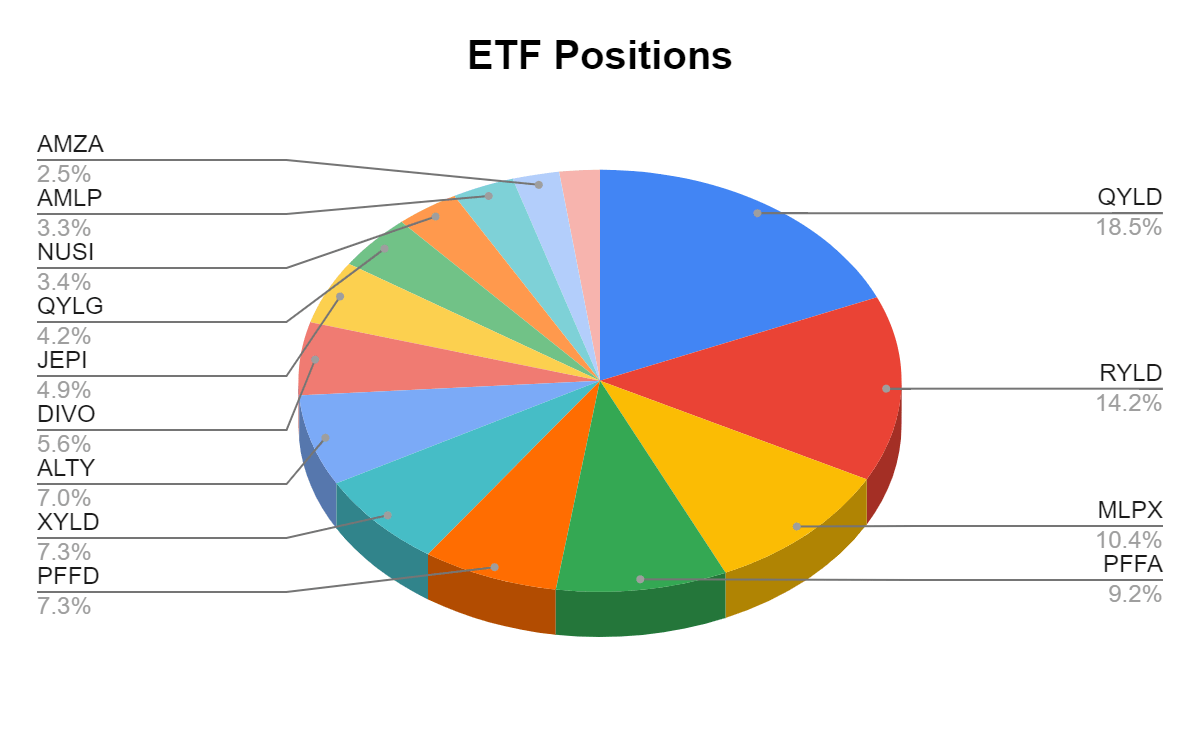

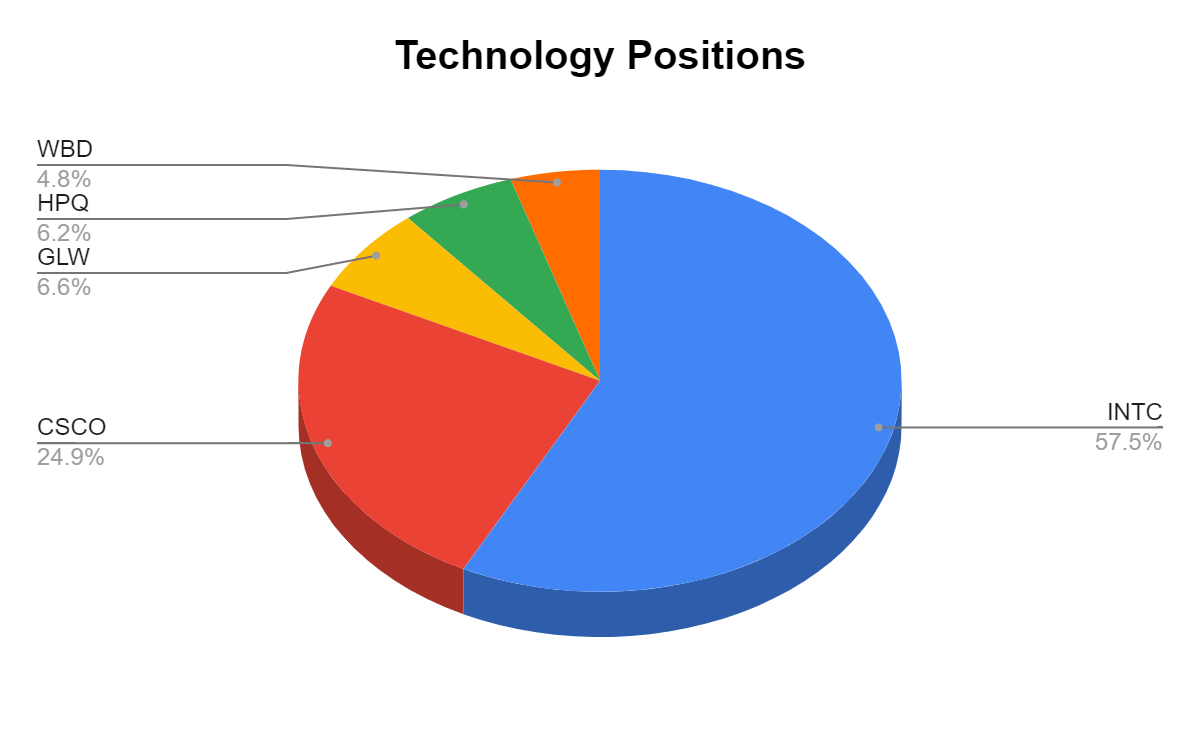
In week 76, Intel Corporation (INTC) took back the top spot and represents 4.15% of the Dividend Harvesting portfolio. While I have a 5% rule, I would really like to get Omega Healthcare Investors (OHI) over the finish line with respect to generating an additional share annually through reinvesting its dividends. OHI is generating 80.42% of its current share price in dividends, so adding a share or two could occur in the next several weeks.
Steven Fiorillo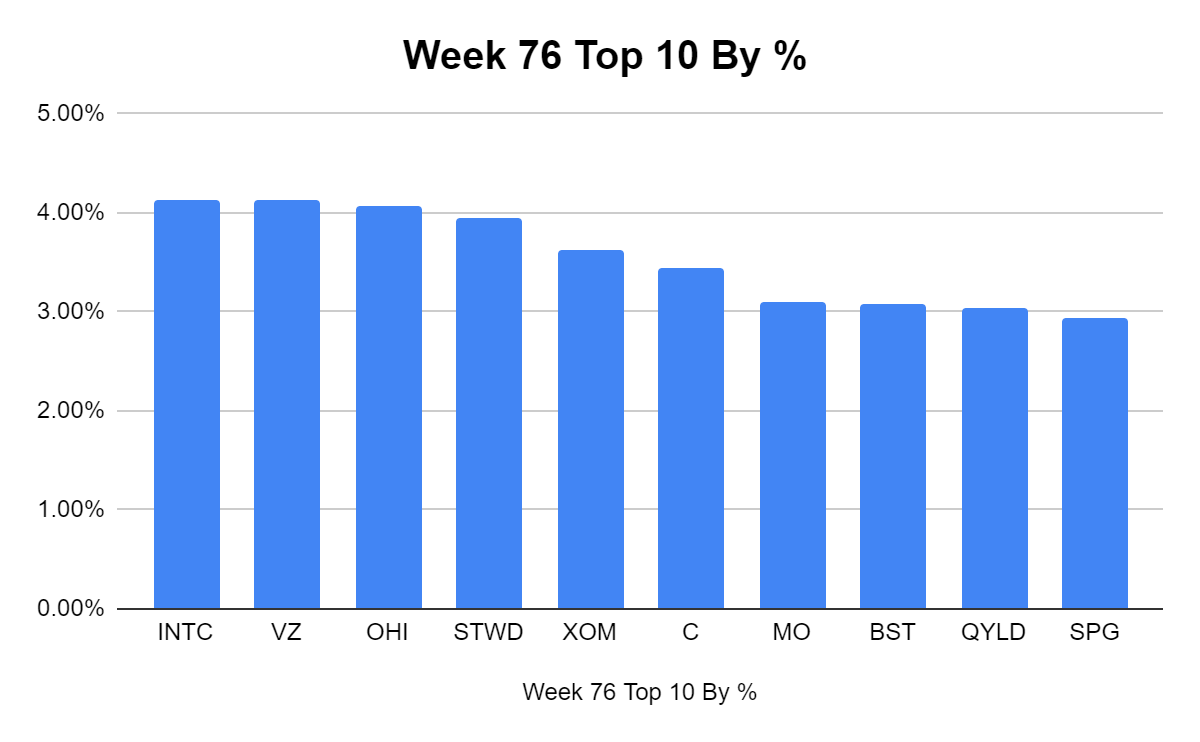
Week 76 Additions
In week 76, I added to my current positions of:
- Altria Group (MO)
- Ares Capital (ARCC)
- PIMCO Dynamic Income Fund (PDI)
- The Global X Alternative Income ETF (ALTY)
Altria Group
- In June, MO fell from roughly $54.01 to $41.16, losing -23.79% of its value. MO is controversial, but at the end of the day, it’s a cash cow. I don’t smoke, I rarely drink, but I also believe every adult has the right to choose if they want to put these substances in their body since they are legal. MO’s dividend yield jumped into the mid-8% range, and I had decided that once it started to rebound a bit, I wanted to add to the position. I can’t call bottoms, but after a month or so, it looks like a bottom formed in MO. This is a cash cow that has over 50 years of paying annual dividends. If MO stays under $48, I would probably add another share sometime over the next month or two.
Ares Capital
- This is a rare occurrence, but I purchased a share of ARCC last week (week 75) and this week (week 76). On 8/1, I had an article published on why I was adding to ARCC (can be read here). ARCC is strictly an income investment for me, and ARCC generates income in spades. Its next ex-dividend date is 9/14/22 with a 9/30/22 payout date. ARCC’s dividend track record is hard to replicate, and the special dividends are an added bonus on top of the 53 consecutive quarters of unchanged or growing dividends. I wanted to grab more of ARCC prior to it going ex-dividend and I will probably add another share before 9/14.
PIMCO Dynamic Income Fund
- PDI was a fund which was deep in the red for me. I had made the decision that I would dollar cost average my way down, and I have now purchased 7 shares of PFI in the Dividend Harvesting portfolio. This is a monthly dividend beast, paying a $2.65 annual dividend which is an 11.97% annualized yield. PDI has rebounded off its lows, and I am just slightly in the red. I plan on continuing to add to PDI and reinvesting the dividends.
The Global X Alternative Income ETF
- ALTY is an interesting fund from Global X, and it’s really a hybrid. In its top 10 holdings, you will find several Global X ETFs and companies such as Southern Company (SO), Enterprise Products Partners (EPD), and Icahn Enterprises (IEP). I really like the fund’s portfolio and it gives me access to certain K-1 investments without having to file a K-1.
Week 77 Gameplan
I really like New York Community Bank (NYCB), and Medical Properties Trust (MPW) at these levels. I may add to these positions and then grab another share of PDI and ARCC to try and get them closer to generating 1 share annually through reinvesting their dividends.
Conclusion
The Dividend Harvesting portfolio is generating weekly dividend income through 584 individual dividends annually. I couldn’t be happier as my 3 investment goals of generating a 4-5% yield, mitigating downside risk, and generating capital appreciation in the low single-digits are being achieved. The Dividend Harvesting portfolio has closed in the black 89.47% of the weeks since it was started. Thank you for continuing to read this series, and please leave your comments and questions below. Week 80 is quickly approaching, and I am looking for suggestions as it’s reader suggestion week.
Be the first to comment