

Lemon_tm
Overview
In this series of articles, I will be reviewing Dividend Champions from a specific industry and selecting stocks as long-term buys, current holds, or stocks to avoid based on a variety of financial and valuation metrics. More information regarding the Dividend Champions list can be found here.
I believe that one of the best ways to improve is by looking back and reviewing your past work. For the first 4 parts of this series, I reviewed the successes/failures from my original articles in 2017 and using those reviews to update the metrics used to have a more reliable indicator of future returns. You can click on these links to see Part 1, Part 2, and Part 3 of this series.
For Part 5, my first idea was to look at my original article from 2017 as it was the last entry of the original series and it ranked 7 stocks within the Industrial Equipment and Supplies industries. However, looking at the current Dividend Champions list, these stocks now are included across multiple industries (‘Electronic Equipment, Instruments and Components’, ‘Machinery’, ‘Electrical Equipment’, and ‘Trading Companies and Distributors’). Because of this, I don’t think it makes sense to rank these stocks in the same way today.
Instead, for this and future parts of this series, I will be applying the updated metrics and scoring system (determined through parts 1 and 4 of this series) and using that to rank Dividend Champions in other industries. For this article, I will be looking at the six Dividend Champion stocks in the Water Utilities industry and they include:
- American States Water (AWR)
- Artesian Resources (ARTNA)
- California Water Service Group (CWT)
- Essential Utilities (WTRG)
- SJW Group (SJW)
- The York Water Company (YORW)
Updating The Scoring System
In my original articles from 2017, I used the following metrics to rank stocks: Revenue Growth, Earnings Growth, ROA, ROE, ROIC, Dividend Yield, Dividend Growth, PE Ratio, and Price to Book Value.
I will be using a similar ranking system as I used 5 years ago with a few tweaks based on the review of results from the first four articles of the original series of articles. These updates include:
- Revenue/Earnings Growth – The time frame of these 2 metrics will be shortened from 5 years to 3 years to place more importance on recent growth
- Dividend Growth – This metric will be weighted so that its impact on the total score is reduced by 50%.
- PE Ratio – In the original article, I ranked the stocks based on the trailing PE ratio. For this new series of articles, I will be using its normalized PE ratio to help determine the company’s long-term value.
- Price to Book Value – This metric will be weighted in the same manner as dividend growth
In addition to these updates, I will be adding two additional metrics from YCharts to the rankings of these stocks:
- Fundamental Score – additional details on this score can be found here.
- Momentum Score – additional details on this score can be found here.
Starting in Part 3 of this series of articles, I have also started applying the same weight to the ROA, ROE, and ROIC metrics that have been applied to the Dividend Growth and Price to Book Value metrics.
The New Metrics
Revenue Growth
This chart shows the revenue growth of each stock over the past three years.
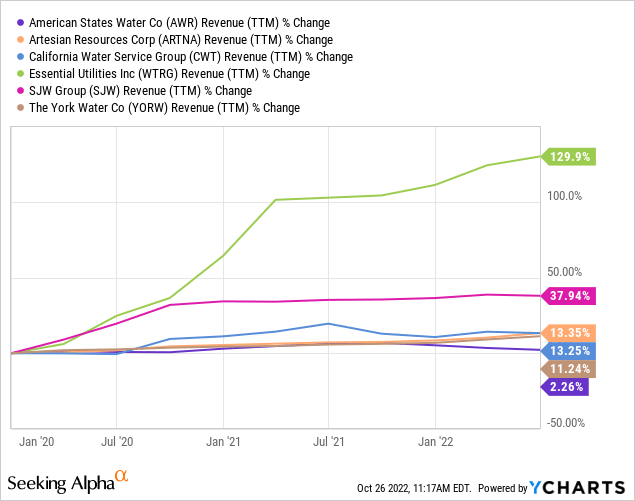
Essential Utilities has seen the highest revenue growth over the past three years by a wide margin, while American States Water has seen the lowest growth during this time period.
Earnings Growth
This chart shows the earnings growth of each stock over the past three years.
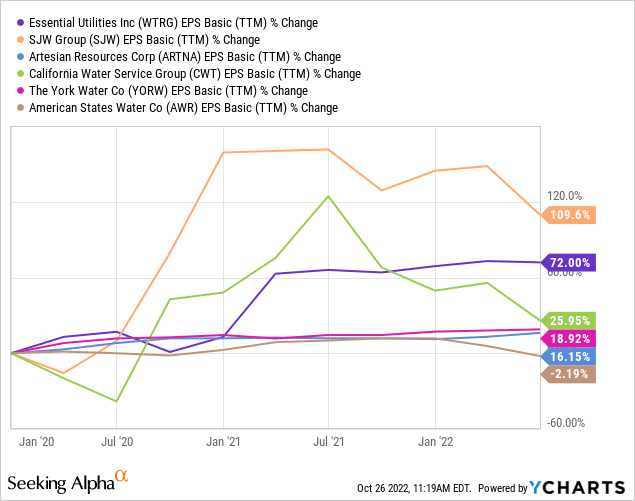
In terms of earnings growth over the past three years, SJW Group leads the group, while American States Water once again ranks at the bottom being the only stock to have seen a decline in earnings during this time period.
Return on Assets
This chart shows the current ROA value of each stock.
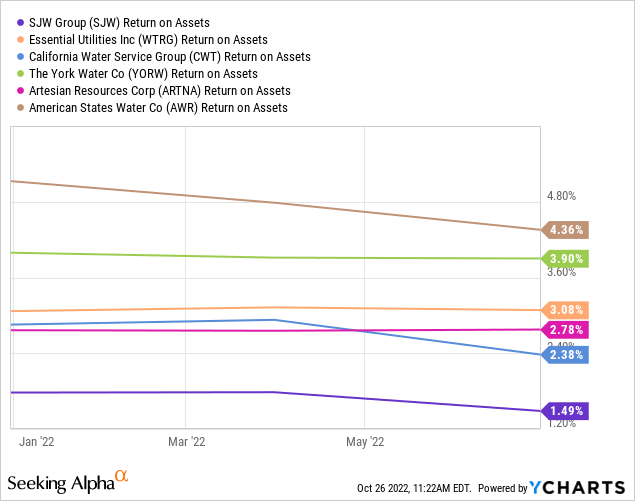
While American States Water has seen the lowest revenue/earnings growth over the past three years, it currently maintains the highest ROA value. SJW Group has the lowest ROA value at 1.49%.
Return on Equity
This chart shows the current ROE value of each stock.
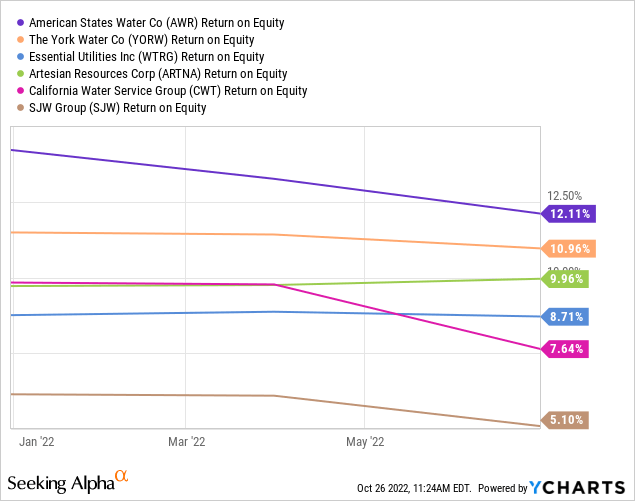
The rankings of ROE are nearly identical to the ROA values with American States Water once again having the highest value and SJW Group having the lowest value.
Return on Invested Capital
This chart shows the current ROIC value of each stock.
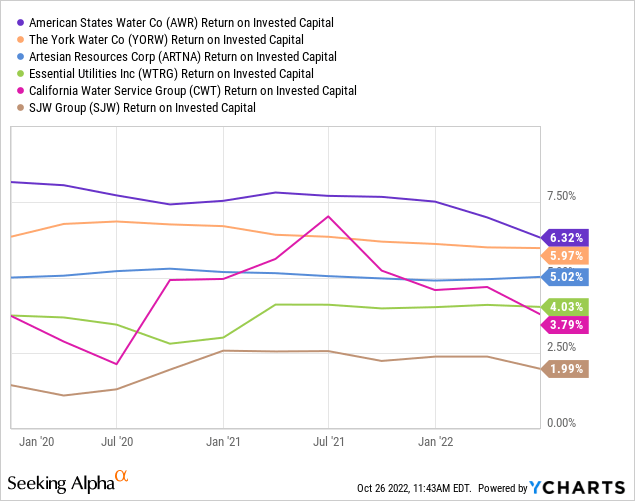
The ROIC rankings follow the same order as the ROE rankings for the six stocks.
Dividend Yield
This chart shows the current dividend yield of each stock.
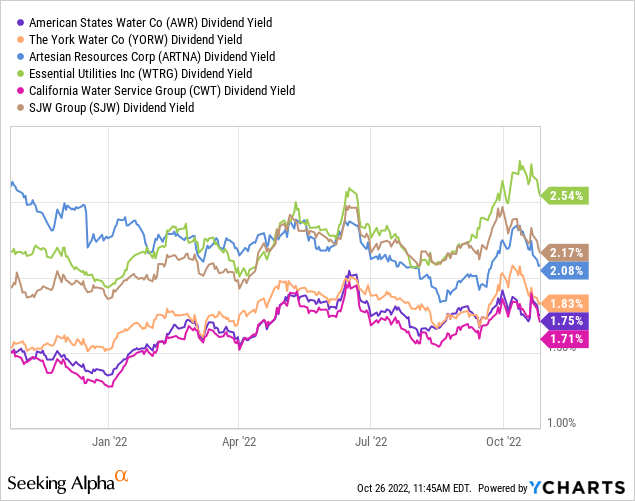
The dividend yields of these six stocks are fairly close with the highest yield and lowest yield being less than 1 percentage point away from each other. Essentia Utilities currently has the highest yield at 2.54% and California Water Service has the lowest yield at 1.71%.
Dividend Growth
Listed below is each stock ranked in order of its 5-year dividend growth rate.
- SJW Group – 10.68%
- American States Water – 8.75%
- Essential Utilities – 6.99%
- California Water Service – 6.58%
- The York Water Company – 4.00%
- Artesian Resources – 3.27%
Normalized P/E ratio
This chart shows the normalized P/E ratio of each stock.
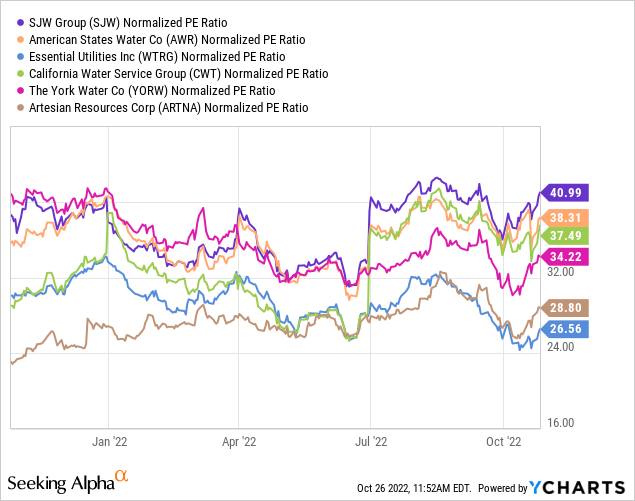
Based on this valuation metric, Essential Utilities appears to be the most attractively valued stock and SJW Group appears to be the least attractively valued.
Price to Book Value
This chart shows the price to book value of each stock.
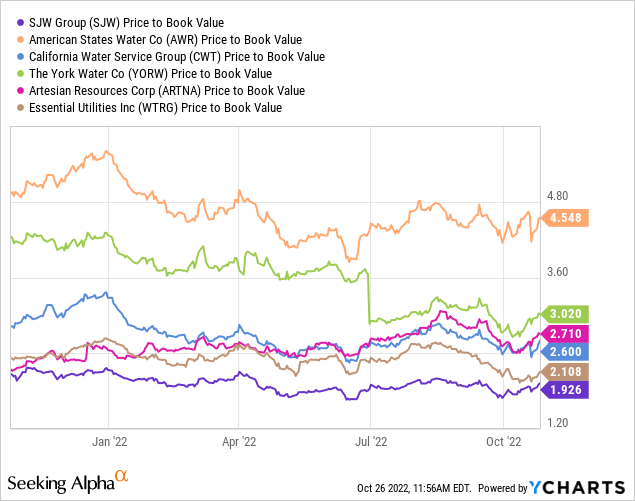
While SJW Group had the highest normalized P/E ratio, it has the lowest Price to Book value compared to the other stocks. American States Water has the highest Price to Book value.
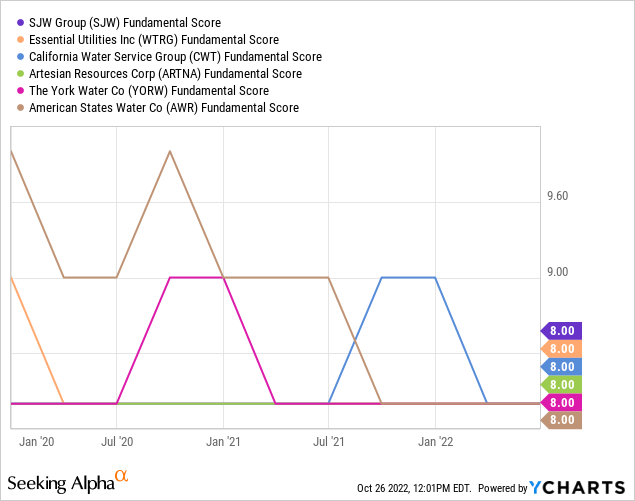
Fundamental Score
In terms of fundamental scores, every single one of the six stocks all have a fundamental score of 8 as you can see in the chart below.
Momentum Score
Unlike the fundamental scores, in which each of the six stocks all had the same value, there is a fairly wide margin in the momentum scores of the six stocks, as seen below.
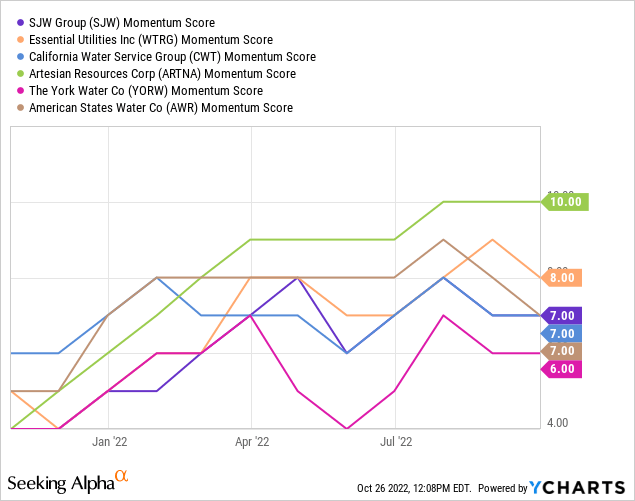
Looking at the chart, you can see that Artesian Resources has the highest momentum score of 10, while The York Water Company has the lowest score of 6.
Score Rankings
In the table below, you will see the 6 stocks and their rankings across each of the metrics outlined above. The stocks are sorted in terms of total overall scores.
| Revenue Growth Ranking | Earnings Growth Ranking | ROA Ranking | ROE Ranking | ROIC Ranking | Dividend Yield Ranking | Dividend Growth Ranking | Normalized PE Ratio Ranking | Price to Book Value Ranking | Fundamental Score | Momentum Score | Total Score | |
| Essential Utilities, Inc. | 6 | 5 | 2 | 1.5 | 1.5 | 6 | 2 | 6 | 2.5 | 8 | 8 | 48.5 |
| Artesian Resources Corporation | 4 | 2 | 1.5 | 2 | 2 | 4 | 0.5 | 5 | 1.5 | 8 | 10 | 40.5 |
| SJW Group | 5 | 6 | 0.5 | 0.5 | 0.5 | 5 | 3 | 1 | 3 | 8 | 7 | 39.5 |
| The York Water Company | 2 | 3 | 2.5 | 2.5 | 2.5 | 3 | 1 | 4 | 1 | 8 | 6 | 35.5 |
| American States Water Company | 1 | 1 | 3 | 3 | 3 | 2 | 2.5 | 2 | 0.5 | 8 | 7 | 33 |
| California Water Service Group | 3 | 4 | 1 | 1 | 1 | 1 | 1.5 | 3 | 2 | 8 | 7 | 32.5 |
Conclusion
The top stock
Looking at the table above, you can see that the stock with the highest overall score is Essential Utilities with a total score of 48.5. This stock ranked first in revenue growth, dividend yield, and normalized P/E ratio.
The bottom three stocks
The score range between the bottom three stocks is only 3 points. These stocks include:
- The York Water Company – Total score of 35.50
- American States Water – Total score of 33.00
- California Water Service – Total score of 32.50
Each of these three stocks ranked lowest in at least two of the reviewed metrics.
American States Water really struggled with revenue and earnings growth, ranking lowest in both and being the only stock out of the six to see negative earnings growth. California Water Service ranked last in each of the ROA, ROE, and ROIC metrics as well as dividend yield. York Water actually performed well in the ROA, ROE, and ROIC metrics but struggled with most of the other metrics ranking last in PE ratio and momentum score.
The remaining two stocks
The remaining two stocks Artesian Resources and SJW Group had final total scores of 40.50 and 39.50 and each performed well in its own way. SWJ has seen impressive revenue/earnings and dividend growth, while Artesian Resources has seen nice returns on assets and equity and was the only stock with a 10 in terms of momentum score.
Final Thoughts
I believe that the top three ranking stocks are solid long-term buy options for investors and should show stronger returns than the other three stocks in this group that ranked lower across the various metrics.
I feel that this is in line with recent news and announcements regarding these stocks. For example, Essential Utilities beat both revenue and earnings estimates in its last quarterly update, while American States Water was recently downgraded to underperform by Wells Fargo. The lowest-ranking stock, California Water Service Group has a current performance warning associated with it here at Seeking Alpha.
As always, I suggest individual investors perform their own research before making any investment decisions. For part 6 of this series, I will be looking at ranking Dividend Champion stocks within the Insurance industry.
Be the first to comment