EUR/USD Rate Talking Points
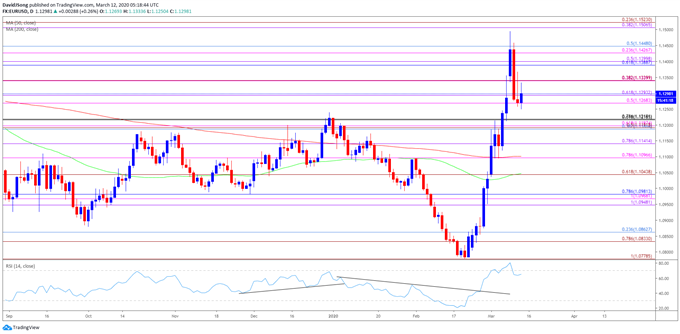
EUR/USD gives back the advance from earlier this week as the European Central Bank (ECB) shows a greater willingness to respond to the coronavirus, and the Euro may face a larger pullback as the Relative Strength Index (RSI) falls back from overbought territory.
EUR/USD Correction Unravels,RSI Shows Sell Signal Ahead of ECB Meeting
The near-term correction in EUR/USD unravels ahead of the ECB meeting as President Christine Lagarde insists that “we stand ready to take appropriate and targeted measures, as necessary and commensurate with the underlying risks.”
The comments suggest the ECB will take additional steps to support the monetary union even though the central bank expands its balance sheet by EUR 20B/month, and the Governing Council may continue to push monetary policy into uncharted territory as President Lagarde tells European lawmakers that the Euro area “will see a scenario that will remind many of us of the 2008 Great Financial Crisis.”
In response, the ECB may rely on non-standard measures to support the economy as the Governing Council remains reluctant to push the main refinance rate, the benchmark for borrowing costs, into negative territory. As a result, President Lagarde and Co. may conduct another round of Targeted Longer-Term Refinancing Operations (TLTROs) in an effort to insulate the monetary union.
At the same time, the ECB may call upon European lawmakers to deliver a fiscal stimulus program as the central bank relies on its unconventional tools to support the monetary union, and EUR/USD may continue to give back the advance from earlier this month as the Relative Strength Index (RSI) falls back from overbought territory.

Recommended by David Song
Forex for Beginners
Sign up and join DailyFX Currency Strategist David Song LIVE for an opportunity to discuss key themes and potential trade setups surrounding foreign exchange markets.
EUR/USD Rate Daily Chart
Source: Trading View
- Keep in mind, the monthly opening range has been a key dynamic for EUR/USD in the fourth quarter of 2019 as the exchange rate carved a major low on October 1, with the high for November occurring during the first full week of the month, while the low for December happened on the first day of the month.
- The opening range for 2020 showed a similar scenario as EUR/USD marked the high of the month on January 2, with the exchange rate carving the February high during the first trading day of the month.
- With that in mind, the opening range for March appears to be showing a similar dynamic as EUR/USD clears the January high (1.2222) and climbs to a fresh yearly high (1.1495).
- However, the near-term correction in EUR/USD may continue to unravel following the failed attempt to close above the Fibonacci overlap around 1.1430 (23.6% expansion) to 1.1450 (50% retracement), with the Relative Strength Index (RSI) highlighting a similar dynamic as the oscillator falls back from overbought territory and flashes a textbook sell signal.
- In turn, a close below the 1.1270 (50% expansion) to 1.1290 (61.8% expansion) region may spur a move towards the Fibonacci overlap around 1.1190 (38.2% retracement) to 1.1220 (78.6% retracement), with the next area of interest coming in around 1.1140 (78.6% expansion).
- Need a move below the 1.1100 (78.6% expansion) to open up the 1.1040 (61.8% expansion) region, with the next area of interest coming in around 1.0950 (100% expansion) to 1.0980 (78.6% retracement).


Recommended by David Song
Traits of Successful Traders
— Written by David Song, Currency Strategist
Follow me on Twitter at @DavidJSong


Be the first to comment