

JHVEPhoto
By Valuentum Analysts
The health care giant Johnson & Johnson (NYSE:JNJ) offers investors a combination of capital appreciation and dividend growth upside potential, and we are big fans of the name. J&J is a Dividend Aristocrat that has increased its annual payout over the past ~60 consecutive years, a feat made possible by its stellar cash flow generating abilities, brand power, and expansive asset base within the realm of health care. Shares of JNJ yield a nice ~2.7% as of this writing.
J&J’s Key Investment Considerations
Image Source: Valuentum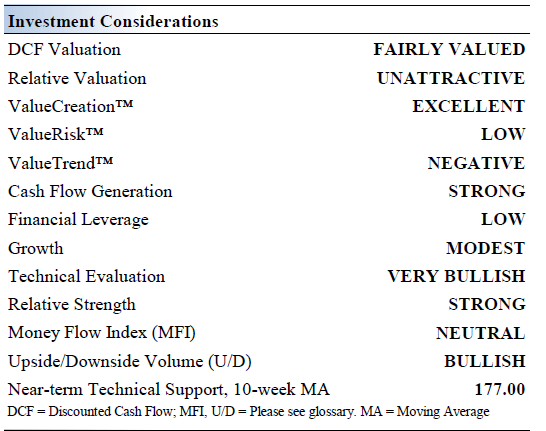
J&J has built one of the most comprehensive health care businesses. The firm’s three core business operating segments are as follows: Consumer Health (which it plans to separate), Pharmaceutical, and MedTech. Its planned separation will mark the end of an era. The company was founded in 1885 and is headquartered in New Brunswick, New Jersey.
Its Consumer Health segment is home to numerous top-tier brands including: TYLENOL, LISTERINE, BAND-AID, PEPCID, NEUTROGENA, NEOSPORIN, and ZYRTEC. The separation of this segment from its other operations is expected to be completed by late 2023.
The company developed a vaccine for COVID-19 that secured regulatory approval from the US FDA and other agencies. However, we do not expect the vaccine to generate needle-moving revenue or profits as it is being sold on a not-for-profit basis. J&J will likely earn goodwill worldwide.
J&J’s TREMFYA was approved by the US FDA in 2020 to treat adult patients with active psoriatic arthritis, and sales have grown at a brisk pace in recent fiscal years. The firm’s other key drugs include DARZALEX (treats certain types of blood cancer), SIMPONI (treats certain types of arthritis), and STELARA (treats moderate to severe active Crohn’s disease).
An overview of the recent financial performance of the various treatments and vaccines included in J&J’s pharmaceutical portfolio. (J&J – 2021 Annual Report)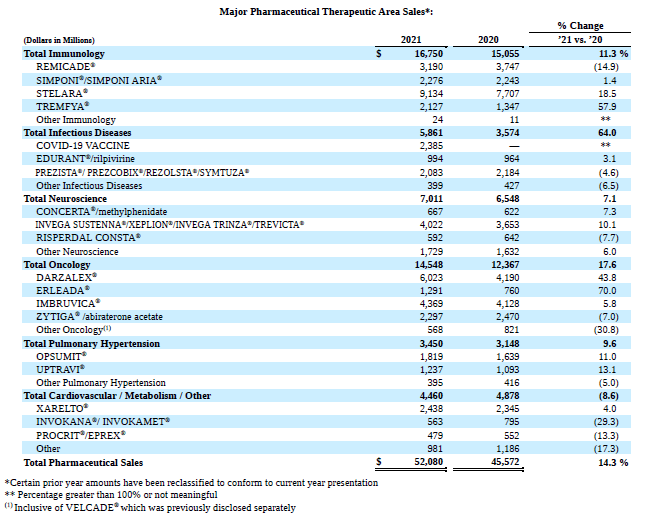
Earnings Update
On July 19, J&J reported second quarter earnings for fiscal 2022 (period ended July 3, 2022) that beat consensus top- and bottom-line estimates. Due to headwinds facing its MedTech segment in the wake of COVID-related lockdowns in China, J&J trimmed its full-year guidance for fiscal 2022, though the company’s underlying business performance remains quite strong.
First, let’s look at J&J’s GAAP performance on a company-wide basis before breaking down the performance of each of its core business reporting segments. On a GAAP basis, J&J’s revenues grew 3% year-over-year to reach $24.0 billion though its diluted EPS dropped by 23% year-over-year to hit $1.80 in the second fiscal quarter. However, please note that its provision for corporate income taxes more than doubled as a percent of sales during this period and that special items also held down its GAAP earnings.
Its GAAP operating income came in at $6.2 billion in the last fiscal quarter, down just 1% year-over-year. J&J’s GAAP gross margin declined by ~50 basis points year-over-year to 67.0% and its core operating expenses (‘selling, marketing and administrative expenses’ and ‘research and development expense’) rose to 41.3% of its net sales (up ~60 basis points year-over-year) in the second quarter.
During the first half of fiscal 2022, J&J generated $8.1 billion in free cash flow (defined as net operating cash flow less capital expenditures) while spending $5.8 billion covering its dividend obligations and $2.6 billion buying back its stock. We are big fans of J&J’s ability to generate substantial free cash flows in almost any operating environment.
J&J is a stellar free cash flow generator which historically have fully covered its dividend obligations with ample room to spare. (J&J – 10-Q SEC filing covering the second quarter of fiscal 2022)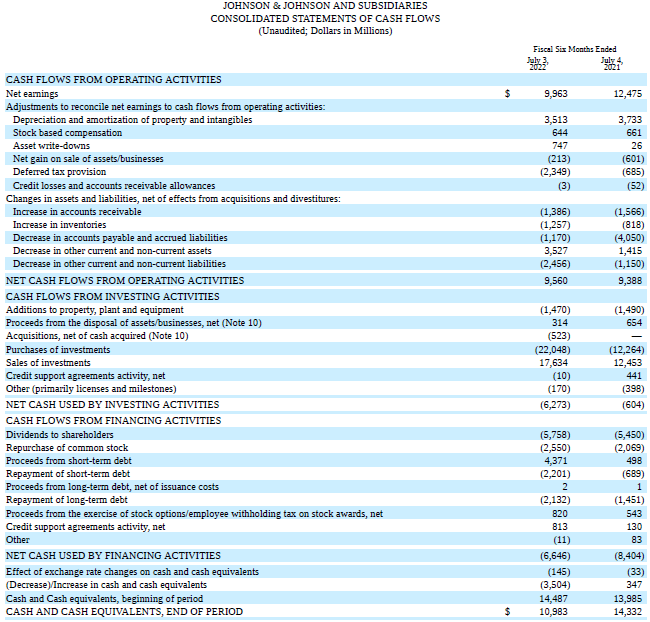
J&J exited the fiscal second quarter with $32.6 billion in cash, cash equivalents, and current marketable securities on hand versus $4.3 billion in short-term debt and $28.3 billion in long-term debt on the books. The company had a largely neutral net cash/debt position (inclusive of short-term debt) at the end of the fiscal second quarter after aggressively improving its balance sheet in recent fiscal years to prepare itself for pending and potential legal liabilities (opioid crisis, talc lawsuits, and other legal liabilities).
In the fiscal second quarter, J&J’s adjusted operational sales jumped higher 8% year-over-year and its adjusted diluted EPS grew by 4% year-over-year during the second quarter (these are non-GAAP metrics). Adjusted operational sales were up 3% year-over-year at its Consumer Health segment. Growth in the segment was supported by its over-the-counter upper respiratory and analgesic products along with its NEUTROGENA branded beauty and skin care products selling well in international markets. Its IMODIUM digestive health branded products also sold well last fiscal quarter.
Pivoting to the company’s Pharmaceutical segment, adjusted operational sales in this area were up 12% year-over-year last fiscal quarter. J&J’s oncology (DARZALEX, ERLEADA) treatments, STELARA treatment (treats Crohn’s disease along with ulcerative colitis, plaque psoriasis, and psoriatic arthritis), and its portfolio of schizophrenia treatments (INVEGA SUSTENNA/XEPLION and INVEGA TRINZA/TREVICTA) were solid revenue generators last fiscal quarter. Additionally, the firm’s COVID-19 vaccine (Ad26.COV2.S) put up decent sales performance, albeit from subdued expectations.
At J&J’s MedTech segment, adjusted operational sales were up 3% year-over-year last fiscal quarter. Its contact lenses, vision surgical products, and electrophysiology products sold well in the second quarter, though J&J alluded to a slowdown in sales in China (citing “COVID-19 related mobility restrictions in certain regions” as a headwind) as holding back its performance at this segment. Here is what management had to say on the issue in response to an analyst’s question during Johnson & Johnson’s latest earnings call:
Again, it gets really difficult to really draw comparisons around procedure volume because we still are dealing with the impact of COVID in the second quarter alone in China. That impacted growth and procedures were down roughly 25% with a little bit improvement towards the last month from what we saw in April and May. — Joe Wolk, EVP and CFO of J&J
As economic lockdowns in China ease up, there is room for upside at J&J’s MedTech segment going forward. However, we caution that potential future economic lockdowns to contain the spread of COVID-19 in the world’s second largest economy remains a key downside risk.
Guidance Update
Pivoting to J&J’s guidance update, the firm reduced its full-year guidance for its reported sales and EPS performance in conjunction with its latest earnings report. It narrowed the range of its adjusted operational EPS guidance but kept the midpoint the same.
J&J now expects its adjusted operating income margin to be broadly flat this fiscal year versus fiscal 2021 levels (previously, the firm was guiding for a ~50 basis point expansion) with management citing “the prolonged impact of inflationary pressures” as the main culprit. The upcoming graphic down below provides an overview of J&J’s current guidance versus its previous forecasts.
J&J’s updated guidance as of the fiscal second quarter. (J&J – Second quarter of fiscal 2022 IR earnings presentation)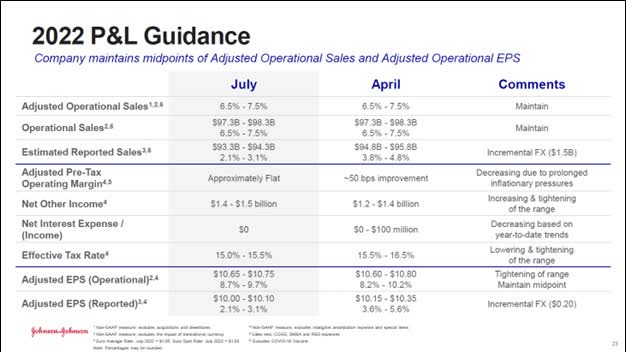
J&J’s Economic Profit Analysis
The best measure of a company’s ability to create value for shareholders is expressed by comparing its return on invested capital [‘ROIC’] with its weighted average cost of capital [‘WACC’]. The gap or difference between ROIC and WACC is called the firm’s economic profit spread. J&J’s 3-year historical return on invested capital (without goodwill) is 34.1%, which is above the estimate of its cost of capital of 8.6%.
J&J has historically been a stellar generator of shareholder value, and we forecast that will continue to be the case going forward. In the upcoming chart down below, we show the probable path of ROIC in the years ahead based on the estimated volatility of key drivers behind the measure. The solid grey line reflects the most likely outcome, in our opinion, and represents the scenario that results in our fair value estimate.
Image Source: Valuentum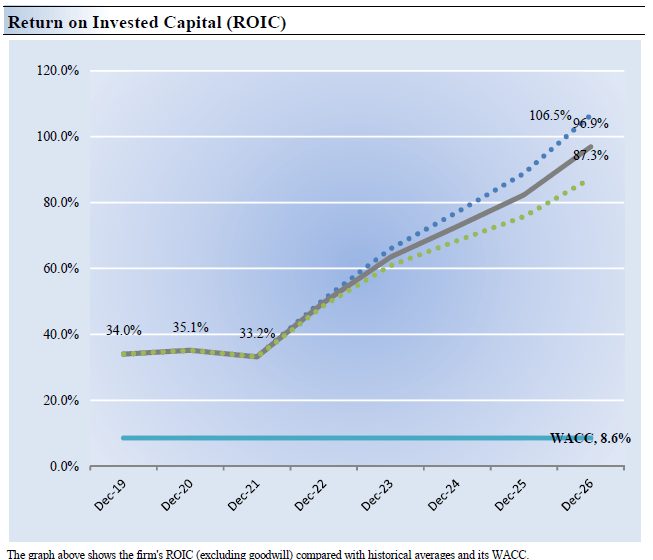
J&J’s Cash Flow Valuation Analysis
Image Source: Valuentum
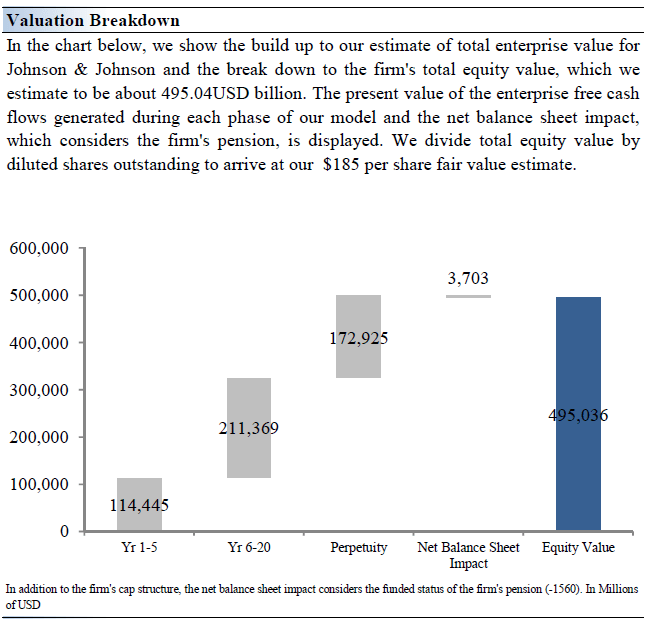
We think J&J is worth $185 per share with a fair value range of $148.00 – $222.00. Our discounted cash flow process values each firm on the basis of the present value of all future free cash flows, inclusive of the company’s net balance sheet considerations.
The near-term operating forecasts used in our enterprise cash flow model covering J&J, including revenue and earnings, do not differ much from consensus estimates or management guidance. Our model reflects a compound annual revenue growth rate of 3.1% during the next five years, a pace that is lower than the firm’s 3-year historical compound annual growth rate of 4.8%.
Our valuation model reflects a 5-year projected average operating margin of 33.9%, which is above J&J’s trailing 3-year average. Beyond Year 5, we assume free cash flow will grow at an annual rate of 2.7% for the next 15 years and 3% in perpetuity. For J&J, we use a 8.6% weighted average cost of capital to discount future free cash flows.
Image Source: Valuentum Image Source: Valuentum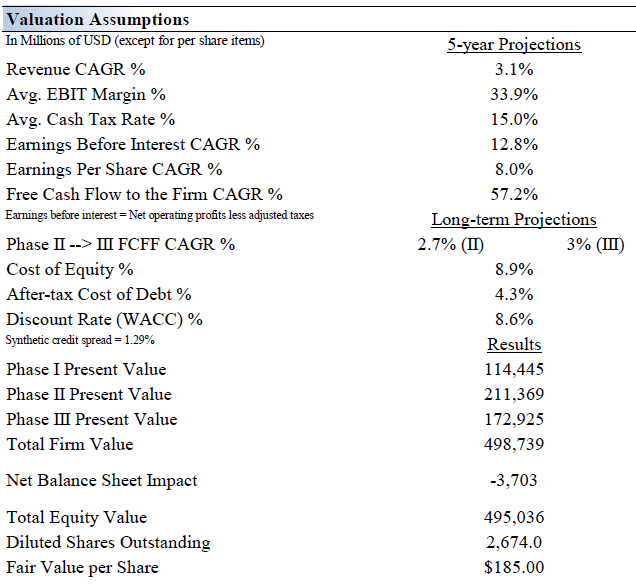
Johnson & Johnson’s Margin of Safety Analysis
Image Source: Valuentum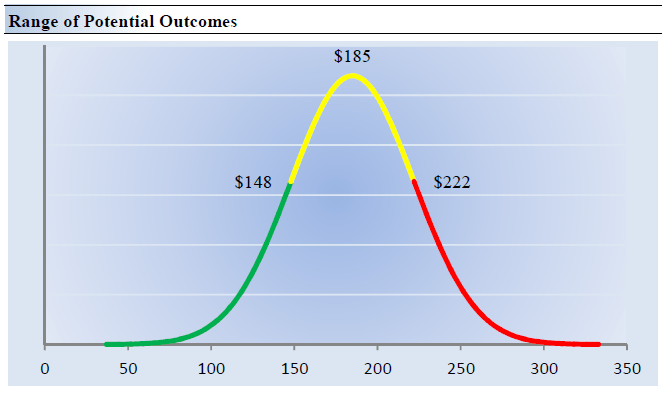
Although we estimate J&J’s fair value at about $185 per share, every company has a range of probable fair values that’s created by the uncertainty of key valuation drivers (like future revenue or earnings, for example). After all, if the future were known with certainty, we wouldn’t see much volatility in the markets as stocks would trade precisely at their known fair values.
In the graphic just up above, we show this probable range of fair values for J&J. We think the firm is attractive below $148 per share (the green line), but quite expensive above $222 per share (the red line). The prices that fall along the yellow line, which includes our fair value estimate, represent a reasonable valuation for the firm, in our opinion.
Concluding Thoughts
Dividend Aristocrat J&J is in a class by itself. Everybody seemingly has come into contact with its brands in one way or another. We like its diversified presence in the healthcare space.
As the firm is in the process of separating its consumer health operations from its pharmaceutical and medical devices operations, J&J’s future will look much different than its past, though for now the company remains a rock-solid free cash flow generator with a healthy balance sheet and a bright growth outlook. The two new entities will likely remain solid free cash flow generators with strong balance sheets and management teams that seek to reward investors.
While J&J has substantial potential legal liabilities to be aware of, management has been steadily bulking up its balance sheet to cover any potential payouts. Looking ahead, we forecast that J&J will keep steadily growing its dividend as it works towards completing its planned breakup.
We also see room for meaningful capital appreciation upside potential at J&J going forward as shares of JNJ are trading moderately below our fair value estimate ($185 per share) and well below the top end of our fair value estimate range ($222 per share) as of this writing. Given that J&J has been firing on all cylinders of late when putting near term headwinds facing its MedTech segment aside, we see room for shares of JNJ to test the top end of our fair value estimate range as market conditions “normalize” after a brutal first half.
This article or report and any links within are for information purposes only and should not be considered a solicitation to buy or sell any security. Valuentum is not responsible for any errors or omissions or for results obtained from the use of this article and accepts no liability for how readers may choose to utilize the content. Assumptions, opinions, and estimates are based on our judgment as of the date of the article and are subject to change without notice.
Be the first to comment