

RobertKacpura/iStock via Getty Images
Oil and gas producer equities are in their third year of a bull market, with shares up substantially from Covid-era lows.
After such a large run-up, many investors are afraid to buy out of fear of having “missed out.” It is helpful in the context of such an environment to identify differentiating factors that may affect individual company performance, beyond the macro and broader sector performance.
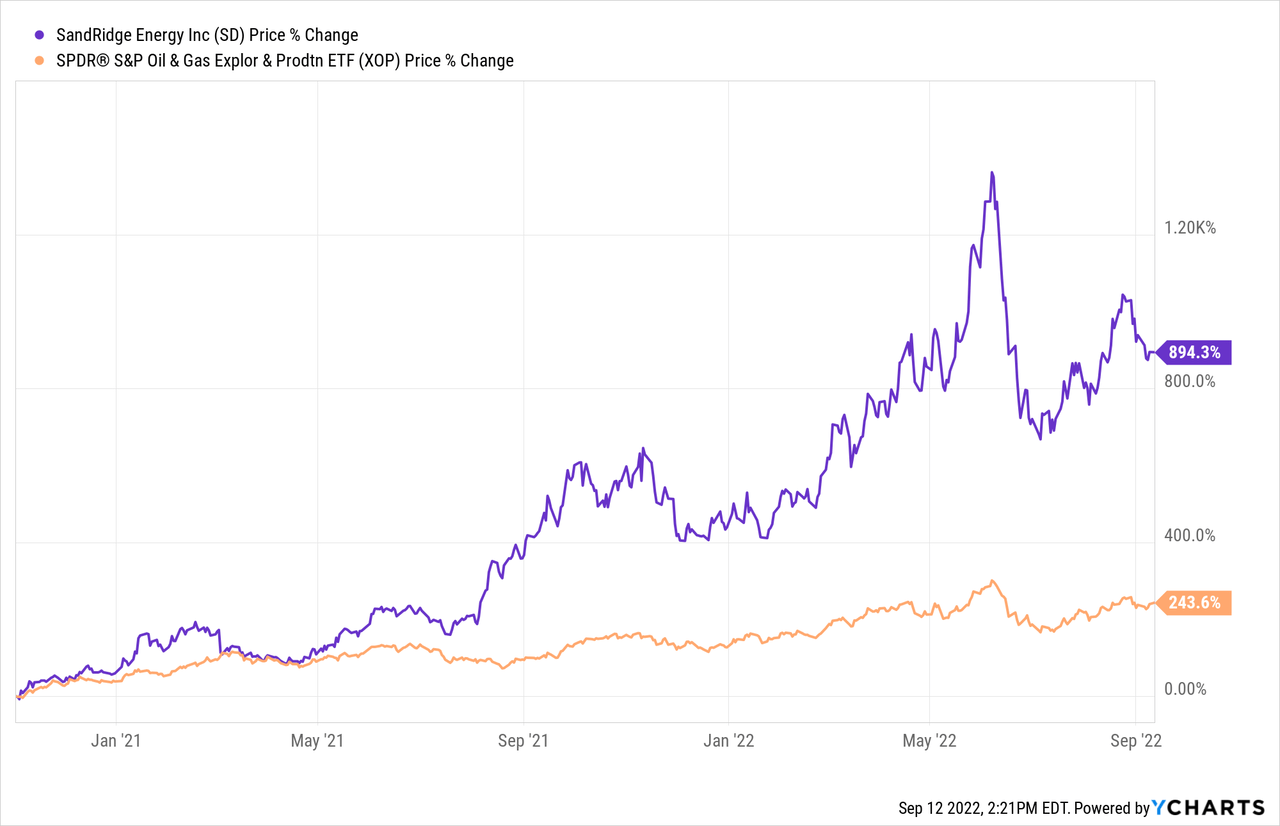
First, it makes sense to look back at what has “worked” so far in this bull market. Company-specific factors have helped identify companies that have substantially outperformed the sector, such as this analysis of SandRidge Energy (SD) and its performance versus the US oil and gas ETF (XOP):
Similarly, Baytex (OTCPK:BTEGF) has significantly outperformed the Canadian oil and gas ETF XEG since my variant view on the company in April 2021:
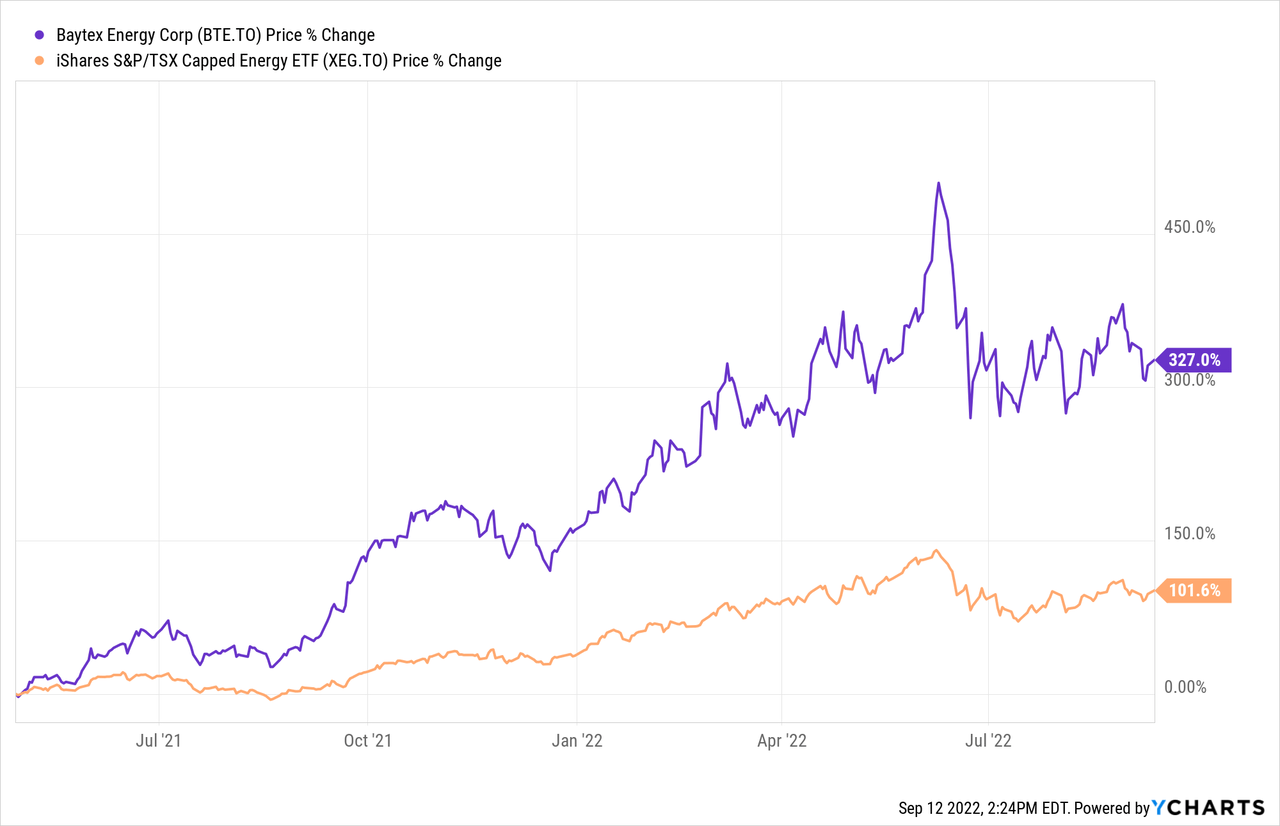
In the case of SandRidge, the liquidation value of non-core assets, a heavily discounted valuation versus peers, and natural gas price upside were the keys to this outperformance. In the case of Baytex, better than expected well results that were not yet priced in were the key to its outperformance.
A transaction in the news today is a reminder that there is another factor that could drive similar variant performance: acquisitions. The return on deployment of capital is an important driver of share price performance over time, as famously discussed by Warren Buffett and others.
The transaction is the acquisition of Deltastream, a privately held Clearwater oil producer in Canada, by publicly traded Tamarack Valley (TVE.CA). Tamarack is buying approximately 19,000 barrels per day of oil and gas production for $1.425 billion, or $75,000/boepd. This is a high number compared to a number of other recent acquisitions and offers a powerful contrast with another deal I wrote about recently, Journey’s (JOY.CA) acquisition of assets from Enerplus (ERF).
Relevant O&G Upstream Acquisition Metrics
$/BOEPD
There are a number of different potentially relevant metrics to measure the attractiveness of an acquisition in the oil and gas industry. The simplest is to compare how much production is purchased versus the purchase price. This reflects the likely cash flow metrics of the transaction, assuming similar sales margins. In this case, Tamarack paid $75,000/boepd and Journey paid $26,364/boepd.
$/PDP Value
The next relevant measure in assessing an O&G acquisition is the engineer-assessed value of production, typically starting with the proved developed producing (PDP) value and then considering “probable” and “possible” reserve values. Tamarack interestingly did not include such metrics, while Journey shared that it paid about 70% of PDP value. Considering the much higher price per barrel equivalent of production, it is likely Tamarack paid a premium to PDP value.
Cash Flow Multiple
Another relevant measure is purchase price to cash flow, estimated by the acquirer. Tamarack does not disclose the run-rate cash flow of the asset, but estimates it paid 2.9x its forecast cash flow for 2023, without disclosure or consideration of the capital expenditures necessary to grow production to the 23,000 boepd forecast to generate that cash flow. The “net” price might be substantially higher, if that capital expenditure were to be included. Journey claimed it paid less than 2x the run-rate cash flow of the assets purchased.
% Oil, Liquids and Natural Gas
Another measure is the % of production that is oil versus gas. Oil garners a higher price in Canada currently than natural gas, on a barrel equivalent basis. Tamarack bought an asset that is “93% liquids” (or oil along with natural gas liquids, which are lower value than oil), while Journey bought assets that are 71% liquids. While relevant, the variance in product mix is already factored into the cash flow multiples for the acquisitions, with Journey’s under 2x and Tamarack’s 2.9x, “pro forma” for 2023 and undisclosed capital expenditures.
Decline Rate
Tamarack does not disclose the decline rate of the asset it acquired. Since Deltastream grew its production rapidly over the past few years, the decline rate is likely high, which could be a reason for not sharing it. This would be consistent with a low PDP value compared to cash flow multiple, as a higher declining asset has less “area under the curve” of production in which to generate cash flow. Journey shares a decline rate of 12%, with an even lower oil production decline rate of 10%.
Asset Retirement Obligations
Tamarack does not mention asset retirement obligations in its announcement. In this case, it is likely because those liabilities are low because Deltastream’s wells were mostly drilled in the last few years. Journey cites an LMR (liability management ratio) of 4.5x, reflective of the lower decline, higher liability to asset value nature of the assets it purchased.
Summary
Journey paid a lot less than Tamarack in its acquisition. Tamarack bought a large asset in the “most economic” development area of Canada, in a likely highly competitive sales process. Journey bought assets 1/5 the size, scattered across southern Alberta, in a sales process that had been telegraphed for years and may not have been particularly competitive. On almost all relevant metrics, Journey paid far less than Tamarack did, which may result in a much higher return on capital metric for Journey’s deal than Tamarack’s over time.
This may be reflected in further outperformance of Journey’s shares versus Tamarack’s and the broader competitor set, as Journey continues to acquire less “sexy” assets at compelling metrics. Tamarack is now the largest Clearwater producer, holding the biggest position in the highest return oil development play in Canada. Journey continues to aggregate scattered assets across numerous oil and gas fields. My preference is for more 2x cash flow acquisitions with ultra-low production decline rates, and my sense is that over time, this will be increasingly reflected in Journey’s financials and share price performance.
Be the first to comment