


bankrx/iStock via Getty Images
Investment Thesis
The iShares Core Dividend ETF (BATS:DIVB) reduced its expense ratio to 0.05% from 0.25% in October, providing an immediate yield and total returns boost for shareholders and cementing it as an alternative to the more successful iShares Core Dividend Growth ETF (DGRO). This article compares the two ETFs, demonstrating that while the total shareholder yield approach results in higher volatility, DIVB achieves higher growth and profitability with a lower valuation. In my view, dividend investors wanting an alternative to a broad market ETF like SPY should add DIVB to their watchlist, and I look forward to explaining why in more detail below.
ETF Overview
Strategy Discussion
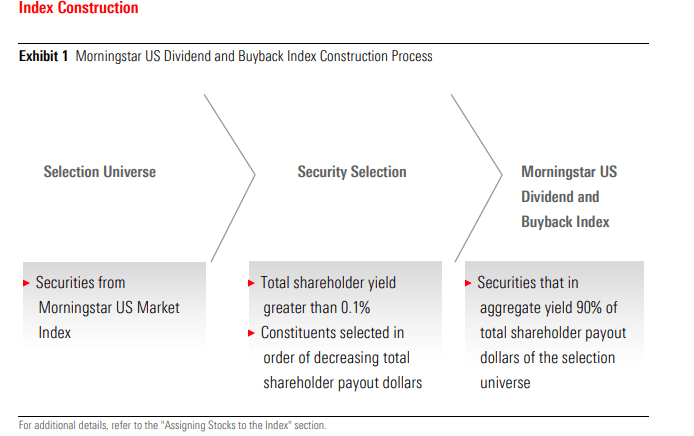
DIVB tracks the Morningstar U.S. Dividend and Buyback Index, selecting the top 90% of companies from the broad Morningstar U.S. Market Index with shareholder yields greater than 0.10%. The expense ratio is 0.05%, and the selection process is detailed below.
Morningstar
The resulting number of selections is large. The universe is essentially any company with a market capitalization above $5 billion, and 70% of these companies pay a dividend. Include non-dividend-paying companies that repurchased shares over the last two years, and DIVB becomes a well-diversified fund. Last month, DIVB’s expense ratio fell to 0.05% from 0.25%, a sign it’s attempting to compete with funds like the SPDR S&P 500 ETF (SPY).
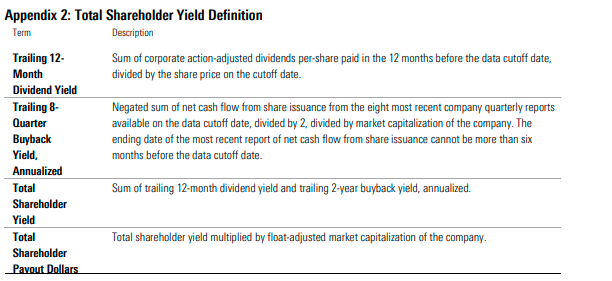
The Index defines total shareholder yield in its rulebook. Weighting constituents by total shareholder payout dollars prioritizes larger companies regardless of their shareholder yields. The benefit of this approach is that household names like Apple (AAPL) and Microsoft (MSFT) still qualify. The disadvantage is a lower dividend yield. DIVB’s trailing dividend yield is 1.96% compared to 2.27% for DGRO and 1.54% for SPY. However, the 0.20% fee reduction will improve DIVB’s figure, so the two look competitive on a go-forward basis.
Morningstar
Sector Exposures and Top Ten Holdings
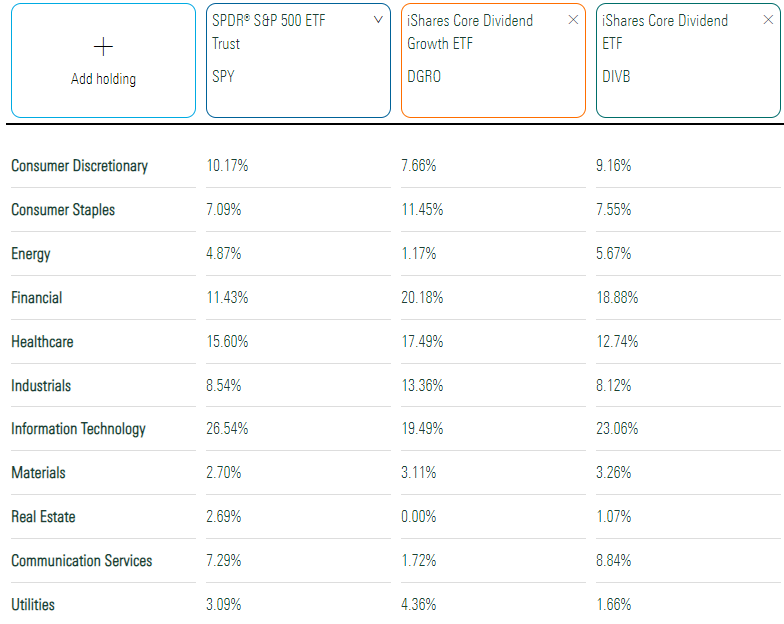
DIVB’s sector exposures are listed below alongside SPY’s and DGRO’s. Like DGRO, Morningstar lists DIVB in the Large Value category, but in practice, it functions closer to a Large Blend ETF like SPY. DIVB has 23.06% exposure to the Technology sector and 8.84% exposure to the Communications Sector, higher than DGRO and many other dividend-oriented ETFs. However, exposure to the Financial sector, a favorite for value investors, remains high at 18.88%.
Morningstar
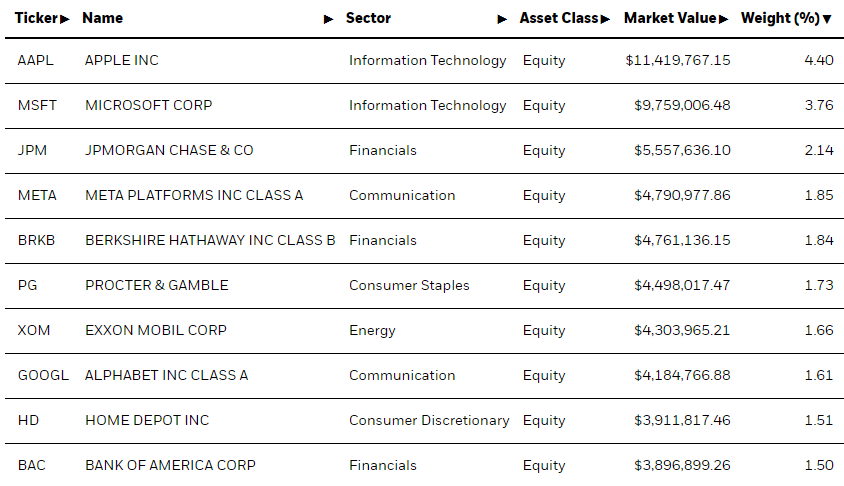
DIVB’s top ten holdings include Apple (AAPL), Microsoft (MSFT), JPMorgan Chase (JPM), Meta Platforms (META), and Berkshire Hathaway (BRK.B). The total exposure to these ten stocks is 22%, or 23.58%, if you include both share classes for Alphabet (GOOGL, GOOG). At this level, DIVB is slightly better diversified than SPY (26.24%).
iShares
Performance
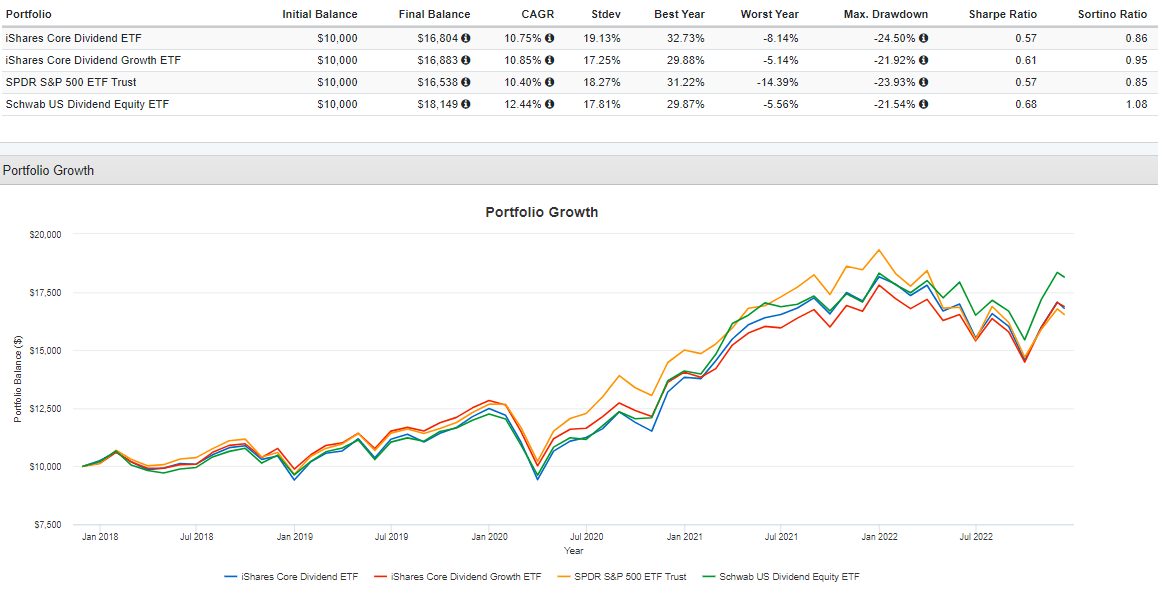
DIVB’s performance since December 2017 has been competitive, earning an annualized 10.75% vs. 10.85% and 10.40% for DGRO and SPY. I’ve also included Schwab U.S. Dividend Equity ETF (SCHD), up an annualized 12.44%, in the graph below. However, I caution that the investment objectives of DIVB and SCHD differ. The inclusion only highlights how high-dividend ETFs have outperformed recently.
Portfolio Visualizer
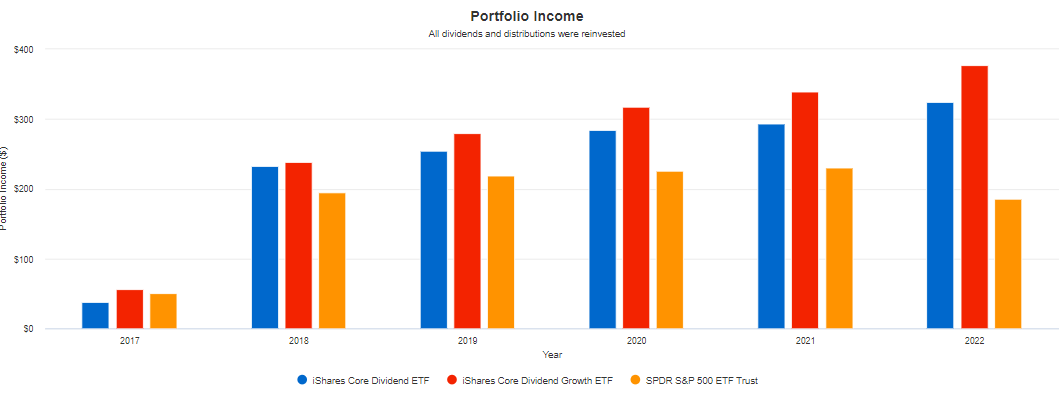
DIVB’s historical dividend growth was weaker than DGRO’s, as indicated in the graph below. Annual portfolio income on a $10,000 initial investment was close in 2015, but in 2022, DIVB remains firmly behind ($325 vs. $377). Part is attributed to the previously higher expense ratio, but my fundamental analysis will provide a clear picture of what to expect moving forward.
Portfolio Visualizer
ETF Analysis
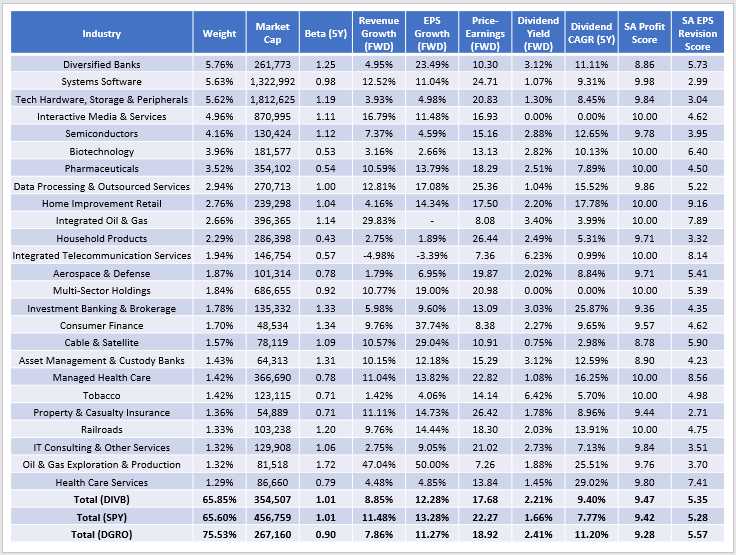
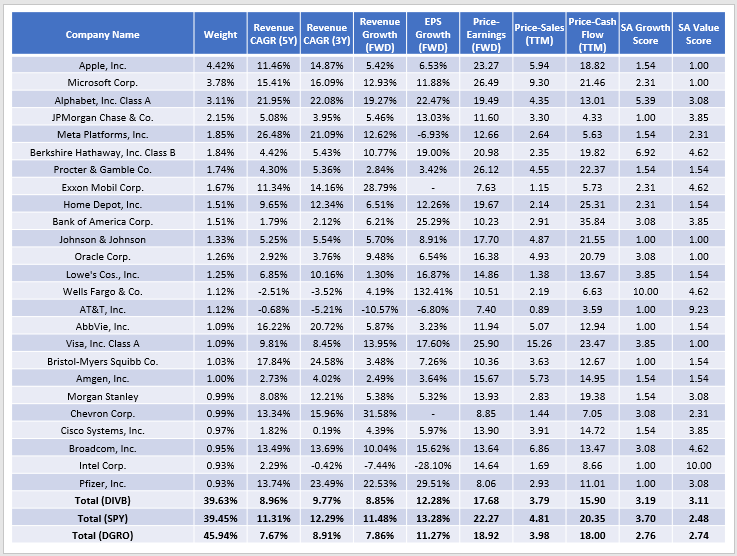
The following table highlights selected fundamental metrics for DIVB’s top 25 industries, a reliable way to measure diversification. These industries represent 65.85% of the portfolio. Similarly, SPY’s top 25 industries total 65.60%, while DGRO’s is 75.53%. As its name suggests, DIVB is a core holding for dividend investors, possibly intended to replace SPY.
The Sunday Investor
In addition to its concentration, DIVB’s current holdings earn a 9.47 Profitability Score from Seeking Alpha on an adjusted ten-point scale. This score is better than SPY’s and DGRO’s (9.42 and 9.28) and suggests the total shareholder yield approach is an excellent screen for quality. All but one of DIVB’s top 25 holdings have an “A+” Profitability Grade from Seeking Alpha. The lone exception is Morgan Stanley (MS) and its “A” Grade. 86/340 holdings have Profitability Grades of “B+” or below, but they total only 8.37% of the portfolio. Profitability is crucial for long-term passive investors, so these results are terrific.
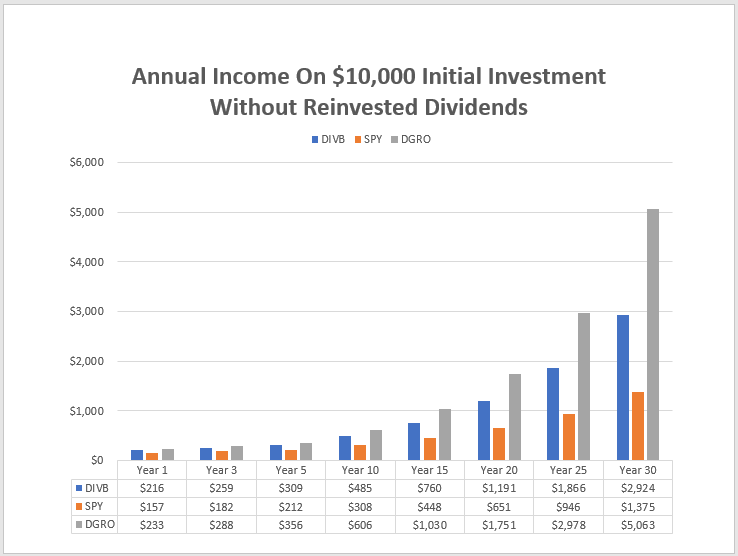
One downside is that DIVB’s 1.01 five-year beta aligns with the market, whereas DGRO’s 0.90 five-year beta is closer to what most dividend ETFs offer. Conservative investors will miss this downside protection, but if their time horizons are long enough, their portfolio income will grow substantially higher than SPY. Still, the resulting income is much less than what DGRO offers.
The Sunday Investor
The earlier table indicated that DIVB was a compromise between SPY and DGRO on estimated sales and earnings growth, but it trades at a cheaper valuation (17.68x forward earnings). The following table highlights these advantages in greater detail by company.
The Sunday Investor
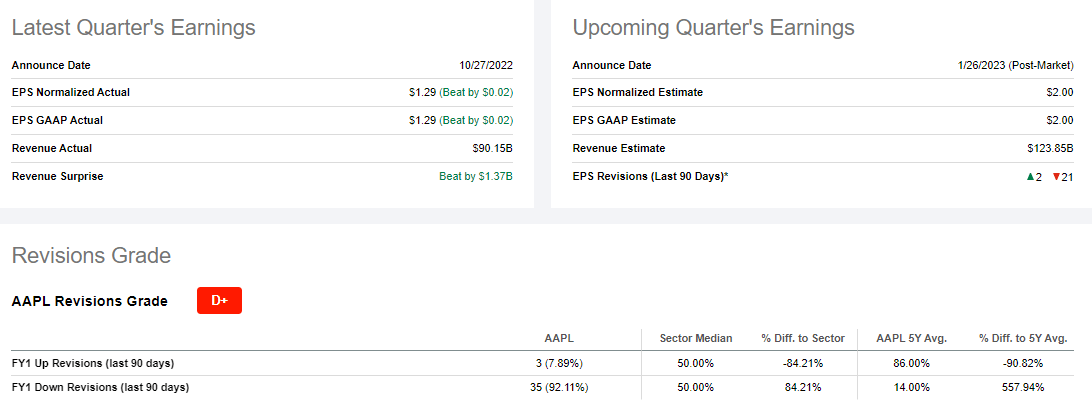
DIVB is estimated to grow sales and earnings by 8.85% and 12.28% next year. While the sales growth rate is 2.63% less than SPY, the earnings growth rate is just 1.00% behind because of DIVB’s high exposure to Financials. Several companies like Bank of America (BAC) and Wells Fargo (WFC) have excellent earnings growth rates and are poised to outperform should the Federal Reserve achieve its “soft landing” objective. In addition, DIVB has less exposure to mega-cap stocks that have seen their growth estimates plummet. Just three months ago, Apple’s estimated earnings growth rate was 25.19% compared to 6.53% today. Seeking Alpha’s EPS Revision Grade captures this negative sentiment, highlighting how 92.11% of analysts have downgraded the next fiscal year’s earnings over the last 90 days.
Seeking Alpha
As mentioned, DIVB trades at an attractive 17.68x forward earnings, but it’s also the cheapest on trailing sales (3.79x) and trailing cash flow (15.90x). Seeking Alpha’s Growth and Valuation Scores for the three ETFs reflect these results nicely.
Investment Recommendation
DIVB’s 0.05% expense ratio is now a selling point, and why my outlook on the fund has improved. As a result, more money will go into dividend investors’ pockets each quarter, and those with a long enough time horizon should be able to create a solid future income stream if they choose. However, DIVB is not a typical dividend ETF, as its 1.01 five-year beta figure suggests no downside protection in a bear market. I prefer a portfolio beta closer to 0.90, and more high-dividend value stocks included. Still, DIVB is superior to DGRO on growth and valuation, and assuming dividend growth isn’t one of your objectives, DIVB belongs on your watchlist for market ETF alternatives.
Be the first to comment