

Povozniuk
Investment Thesis
With the high dividend and low volatility factors dominating most of 2022, it’s no surprise the Global X SuperDividend U.S. ETF (NYSEARCA:NYSEARCA:DIV) has emerged as a leader in the dividend ETF space. DIV and its 6.5% forward yield are up 5% over the last year, making it worth revisiting this special fund that many analysts, including myself, were bearish on previously. Today’s article will focus on DIV’s dividend safety, its inflation-friendly sector composition, and how I expect it will perform going forward. This article will also compare it with another high-dividend and low-volatility ETF with a lower yield but may offer a better chance at a higher total return.
DIV ETF Overview
Strategy
DIV tracks the Indxx SuperDividend U.S. Low Volatility Index, selecting 50 equal-weighted high-yielding dividend common stocks, REITs, and MLPs trading on U.S. stock exchanges. The Index Methodology is linked here, but I’ve summarized the most important parts below:
- minimum $500 million market capitalization
- minimum $1 million average daily turnover over the last six months
- securities must have a beta less than 0.85
- securities with yields below 1% or above 20% are excluded
- securities should have paid dividends consistently for two consecutive years
- current year dividend growth should be greater than or equal to 50%
- securities are ranked by dividend yield, with the top 50 selected
- sector exposures are capped at 25%, and MLP exposure is limited to 20%
The Index selects 50 low beta securities that have experienced tremendous dividend growth over the last year. It’s more likely this growth won’t come from large-cap stocks since they’re more stable, which leaves us with the usually-more-volatile small- and mid-caps. A small effort is made to avoid yield traps by excluding securities with dividend yields above 20%, but this is inconsequential. Of the ~1,500 dividend-paying securities with market capitalizations above $500 million, only three have yields above 20% (GOGL, IVR, ZIM). IVR and its 22.70% yield still managed to sneak into the Index because selections were based on January data. In short, DIV investors are at risk of falling into yield traps.
Performance
DIV’s performance since its March 2013 inception has been poor. Consider how it matched up against ten other high-dividend ETFs with sufficient history.
The Sunday Investor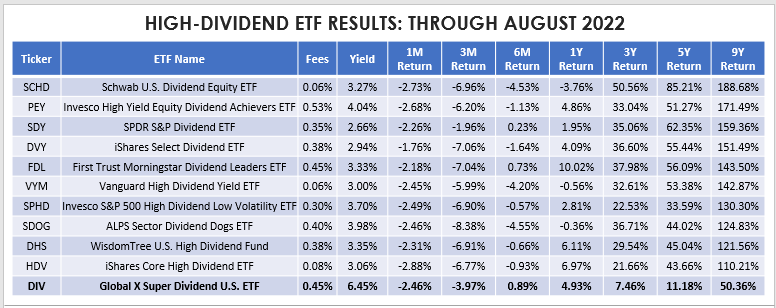
DIV ranks at the bottom, with a total return of just 50.36% over the last nine years through August 2022. With a 0.45% expense ratio, it’s also one of the more expensive ones to own, but the 6.45% yield is the clear draw. I believe DIV’s lack of protection against yield traps is a crucial reason for this poor performance. Also, the highest-yielding stocks are traditionally the most volatile, which helps explain why we don’t see this metric stand out when comparing it with Vanguard’s small- and mid-cap value ETFs (VBR, VOE).
Portfolio Visualizer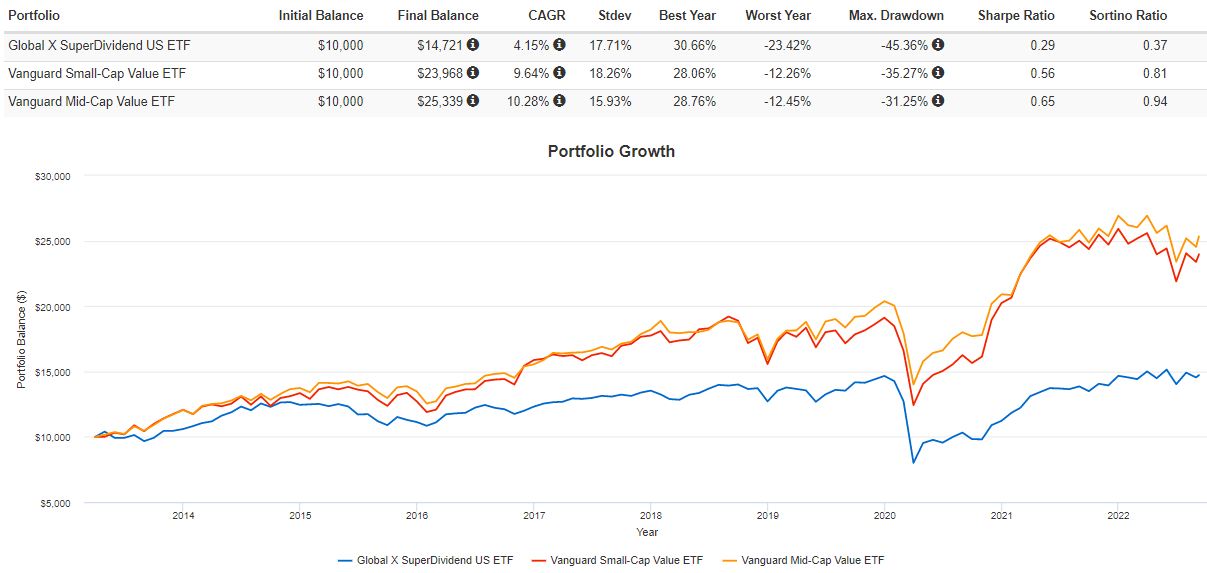
Despite the poor track record, I don’t want to get too caught up in past performance because DIV’s criteria appear extremely sensitive. DIV’s latest annual report lists annual turnover rates of 67%, 59%, 57%, 125%, and 82% from 2017-2021. The portfolio changes regularly, and DIV’s 4.93% gain over the last year places it fourth-best among 65 dividend ETFs I track. Therefore, I think a closer look at the current portfolio is warranted.
ETF Analysis
Assigning a benchmark to DIV is challenging. Global X’s literature sometimes refers to the S&P 500 as its benchmark, despite selecting very few large-cap stocks for reasons discussed previously. The Invesco S&P 500 High Dividend Low Volatility ETF (SPHD) appears to follow the same strategy as DIV, but its market capitalization is twice as large. VBR and VOE select from a similar universe, but each yield less than 2%. Nevertheless, the table below lists the sector exposures for all ETFs, showing that DIV currently overweights Energy (22.31%) and Utilities (18.80%).
Morningstar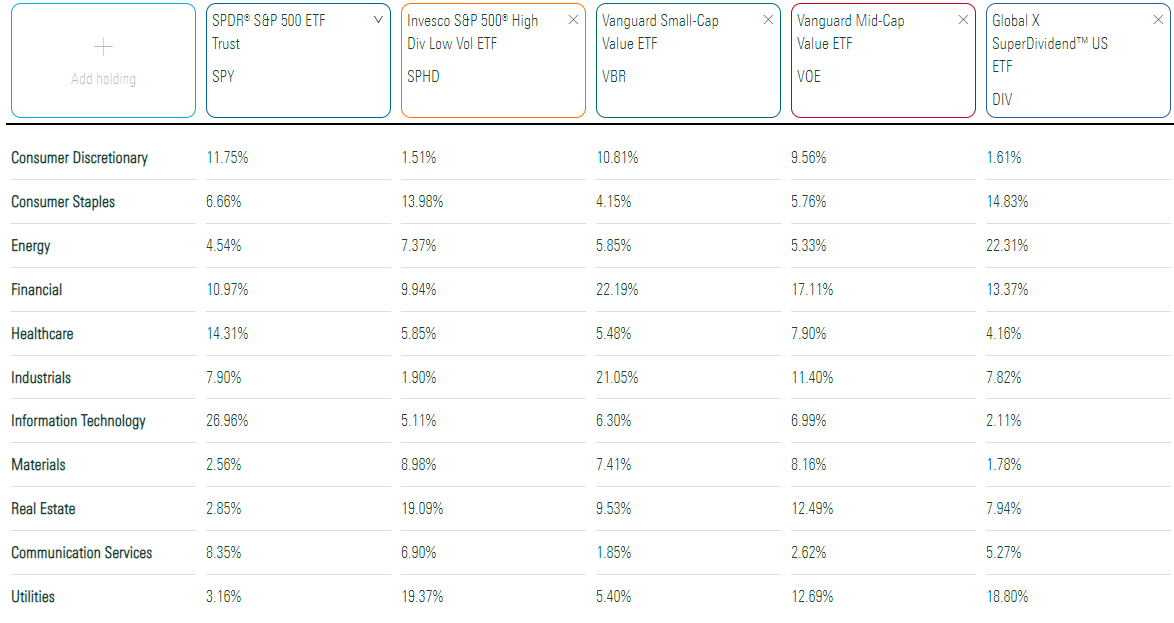
SPHD currently yields 3.70%, and even though that’s nearly 3% less than DIV, it’s about as high as you’ll get for a high-dividend/low-volatility ETF. I’ve compared DIV’s fundamentals for its top 25 holdings with SPHD in the table below, which helps explain the key trade-offs.
The Sunday Investor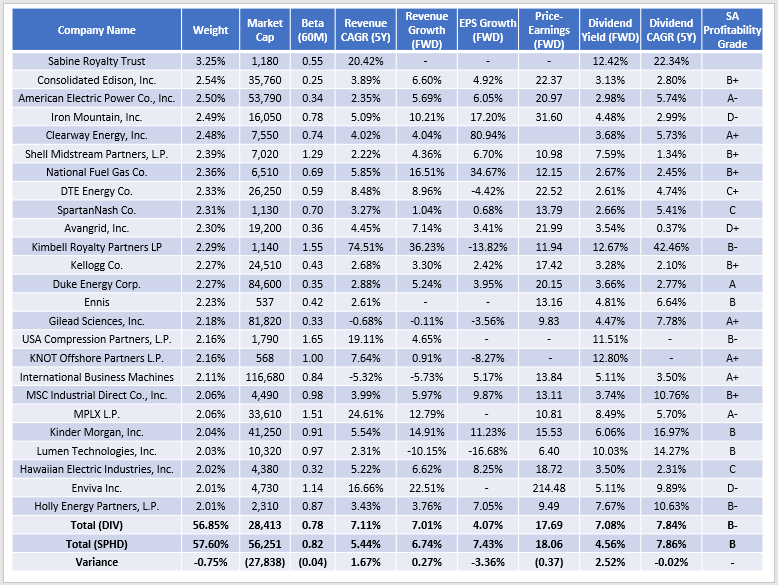
DIV and SPHD are equal-weighted ETFs with 50 holdings, so it’s no surprise to see a near-identical concentration in the top 25. I mentioned how DIV has a market capitalization of about half of SPHD, but this table reveals how that figure is skewed by a few prominent names like Duke Energy (DUK) and International Business Machines (IBM). DIV and SPHD have median market capitalizations of $4.7 billion and $33.2 billion, so I think DIV acts closer to a small-cap dividend ETF.
DIV has a five-year beta of 0.78, which is higher than I expected. Notice how nearly all holdings are below the 0.85 thresholds, except for limited partnerships like Shell Midstream Partners (SHLX) and Kimbell Royalty Partners (KRP). I couldn’t find anything in the Index methodology document indicating special treatment for LPs, but they certainly add to the portfolio’s risk. They’ve also been a reason for DIV’s outperformance YTD, as illustrated in the chart below.
Seeking Alpha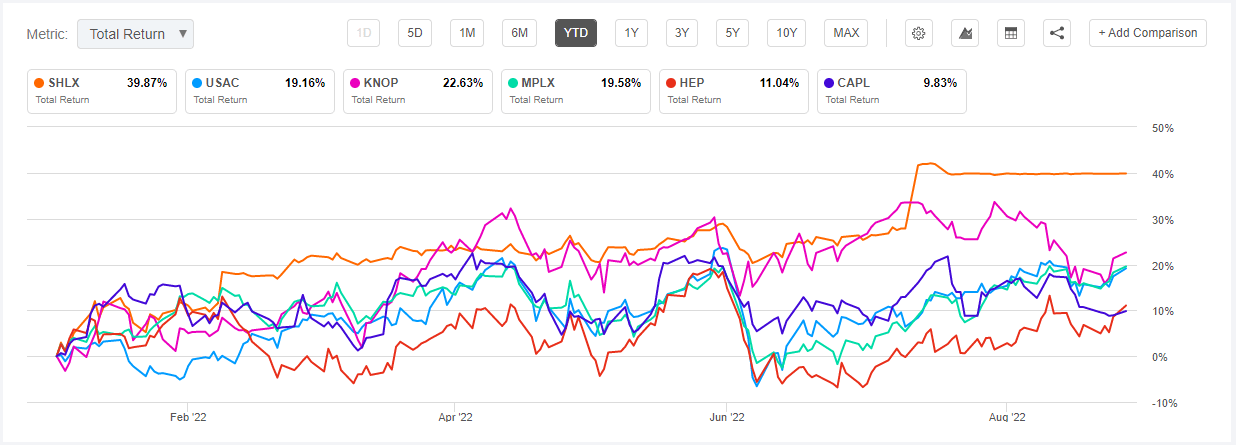
The earlier table highlights DIV’s estimated five-year sales growth rate of 7% is in line with analyst estimates. Sales growth is about 1-2% better than SPHD, but estimated EPS growth is more than 3% lower. These figures suggest that the recent dividend growth these companies experienced over the last year can’t continue. Most high-dividend investors understand that, but I want to clarify that DIV likely won’t be a good dividend growth ETF. Seeking Alpha gives it a “D” and “F” grade for its three- and five-year dividend growth rates but an “A” for its 5.95% trailing yield.
Seeking Alpha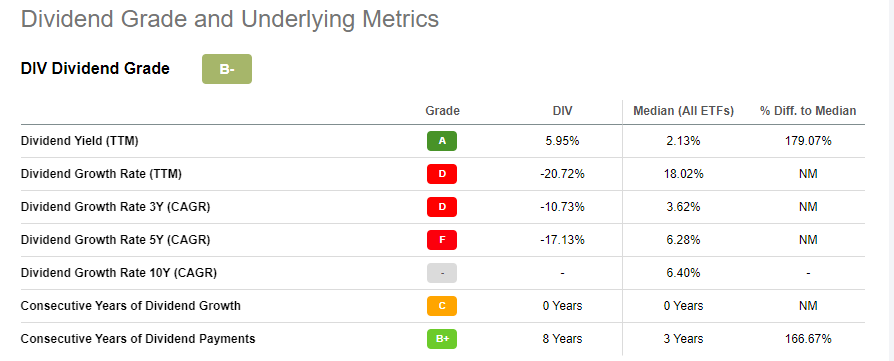
The holdings table summary shows DIV has a weighted-average 7.08% forward dividend yield. I believe this is a more accurate estimate of what investors can expect to receive before fund expenses. This calculation and the annualized rate based on the most recent $0.1080 monthly payment put the yield closer to 6.50%.
Finally, I want to highlight how a few select industries are responsible for DIV’s solid returns. For example, Oil & Gas Storage & Transportation stocks total 12.59% of the ETF and are up 10.25% on average YTD. SBR and KRP, the two E&P holdings, are up 80.10% YTD and 151.55% over the last five years. With oil prices leading to inflation, a risk to DIV is if inflation falls backward and prices continue to trend downward. DIV won’t reconstitute until the end of February 2023, so it could be a risky six months ahead.
The Sunday Investor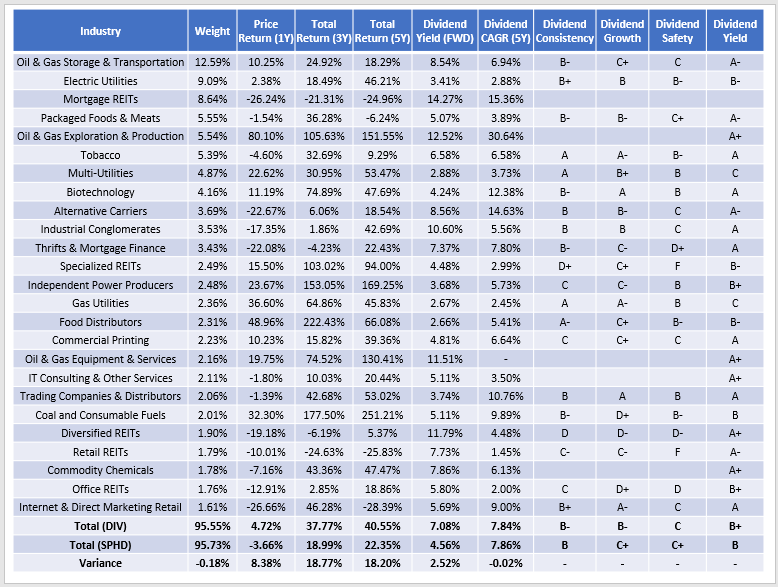
The plus side is that DIV’s dividend grades aren’t nearly as bad as I expected. The weighted-average safety grade is “C,” far better than the “D” and “F” shown earlier. The other three grades for consistency, growth, and yield are competitive with SPHD, which I assumed would be the safer play. Now, I’m not so sure.
Investment Recommendation
DIV is one of only a handful of pure U.S. equity ETFs that can deliver a yield of approximately 6.50%, and I think it can maintain that if oil prices don’t sink. The ETF relies heavily on the Energy sector, but since it won’t reconstitute until the end of February, investors risk seeing their distributions and capital dry up. I think 22% exposure to the sector is too much, but if you can keep your total portfolio exposure in the 10% range, DIV may be a suitable inflation hedge.
Nevertheless, holding DIV over the long run isn’t a great choice. Its methodology doesn’t screen out many yield traps and only selects companies after they’ve grown their dividends by 50% or more. Given current analyst sales and earnings growth projections, it’s unlikely to offer much future dividend growth, and income investors relying on stable monthly distributions may be disappointed. That said, compared with SPHD, its fundamentals look reasonably strong, and current shareholders might want to keep holding on to see how the year shakes out. Overall, my outlook on DIV has improved, and I am rating DIV as a hold.
Be the first to comment