

M. Suhail/iStock Editorial via Getty Images
It’s been a rough year thus far for the market (SPY), and while Dine Brands (NYSE:DIN) has held up better than the average stock, it’s still down 17% for the year and has hardly been a sanctuary. This softness can be attributed to industry-wide headwinds that have worsened, with brands battling labor/commodity inflation and now a potential dip in demand due to rising gas prices. This is not an ideal backdrop for DIN, even if it does have a mostly franchised model and two iconic brands. However, with much of this negativity looking like it’s priced into the stock at ~9x FY2023 earnings estimates, I would view any pullbacks below $57.50 as low-risk buying opportunities.
IHOP Menu (Company Presentation)
Q1 Results
Dine Brands released its Q1 results last month, reporting quarterly revenue of $230.4 million, a 13% increase from the year-ago period. This was driven by a more than 10% increase in franchise revenue to $161.2 million (Q1 2021: $141.0 million) and a ~10% increase in company-owned restaurant revenue ($39.4 million vs. $36.0 million). Digging into the results closer, the company noted that both Applebee’s and IHOP enjoyed positive same-store sales in the period of ~14% and ~18%, respectively. The improvement was related to increased traffic and a higher average check related to menu price increases (~6% at Applebee’s), successful promotions, and a larger number of items in off-premise orders.
Dine Brands – Quarterly Revenue (Company Filings, Author’s Chart)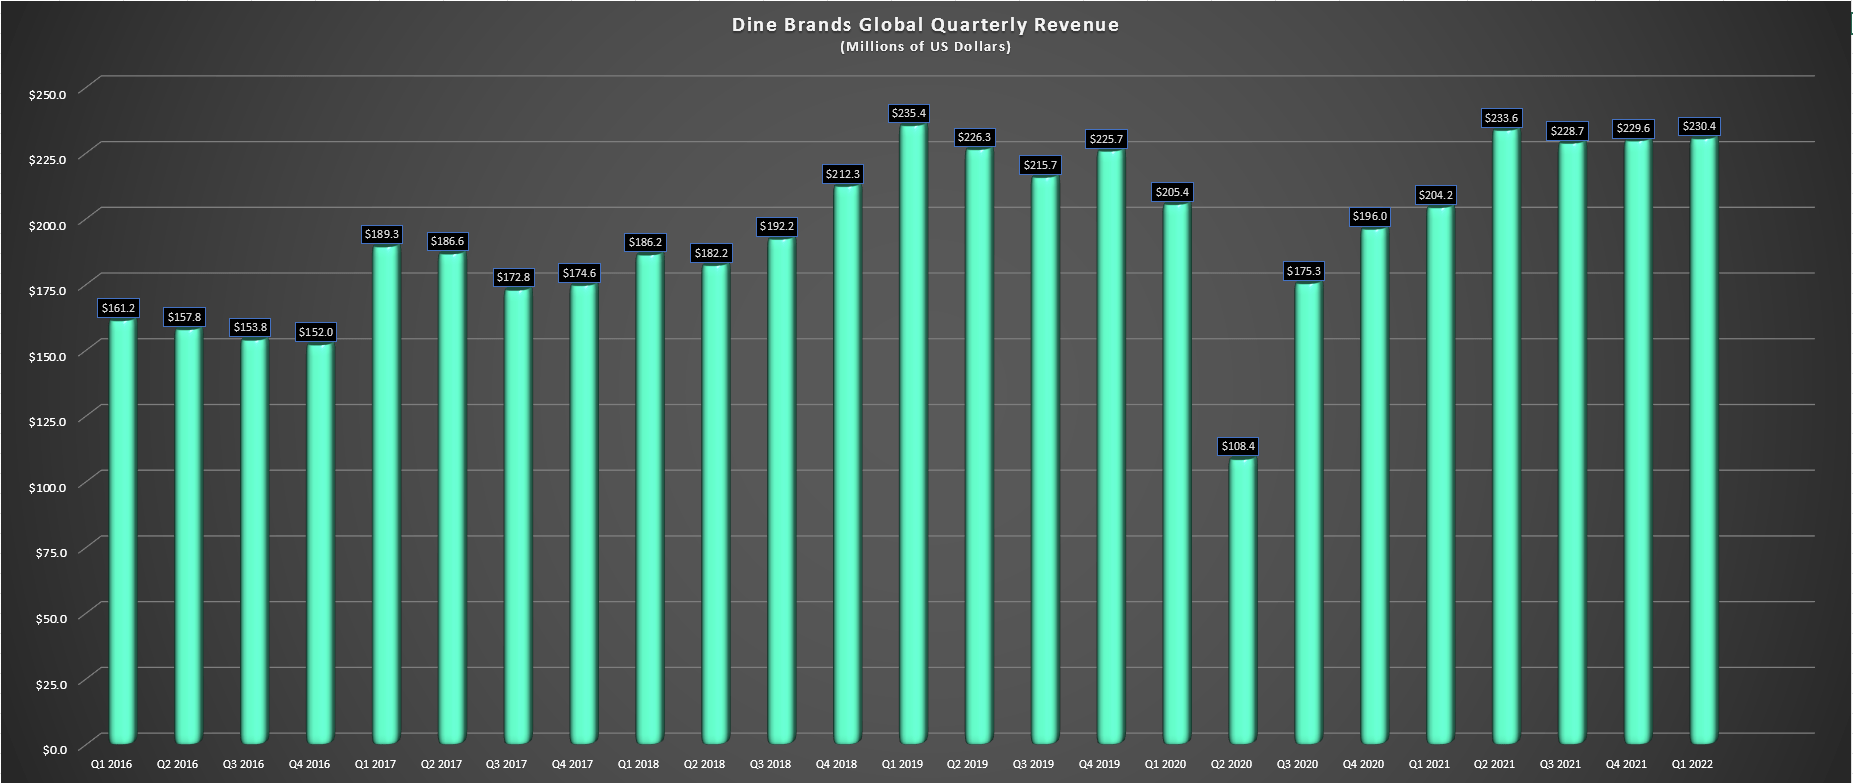
Encouragingly, Applebee’s has increased its average unit volumes [AUVs] from $2.2 million in 2017 to $2.6 million in 2021; it’s seeing a younger crowd (~80% of guests are Gen Z, millennial, and Gen X), and saw strong weekly sales in March (~$57,600). At IHOP, off-premise has remained at double pre-COVID-19 levels (~$8,900 weekly) without cannibalizing on-premise sales, providing a nice boost to weekly sales. It also unveiled a loyalty program with its new website and mobile app: the International Bank of Pancakes. This will allow guests to collect pan coins (pancake currency), which guests can redeem for menu items and non-food items in future visits.
IHOP Restaurant (Company Presentation)
Given that it’s still early days for this roll-out, it’s unclear whether this will significantly boost sales and drive more frequency. However, the move to loyalty programs has been paying off nicely for several other brands thus far. Unfortunately, the company is still working to return to pre-COVID-19 staffing levels, with staffing at 90% of capacity nationwide. However, considering the Omicron headwinds in the quarter and where staffing sits, which is still a drag on sales (91% of IHOPs open for standard operating hours), the sales performance in Q1 was solid.
Industry-Wide Headwinds
Given the solid Q1 results, some investors might be wondering why the stock has struggled since the report on May 4th. I believe this can be attributed to the fact that the market is forward-looking, and while the satisfactory sales performance in Q1 was good to see, the industry isn’t out of the woods yet by any means. In fact, inflation continues to tick higher, with wholesale food prices sitting at 40+ year highs, and the labor market hasn’t improved much, with the industry still ~6.4% below pre-pandemic levels from a staffing standpoint.
Wholesale Food Prices (BLS, National Restaurant Association)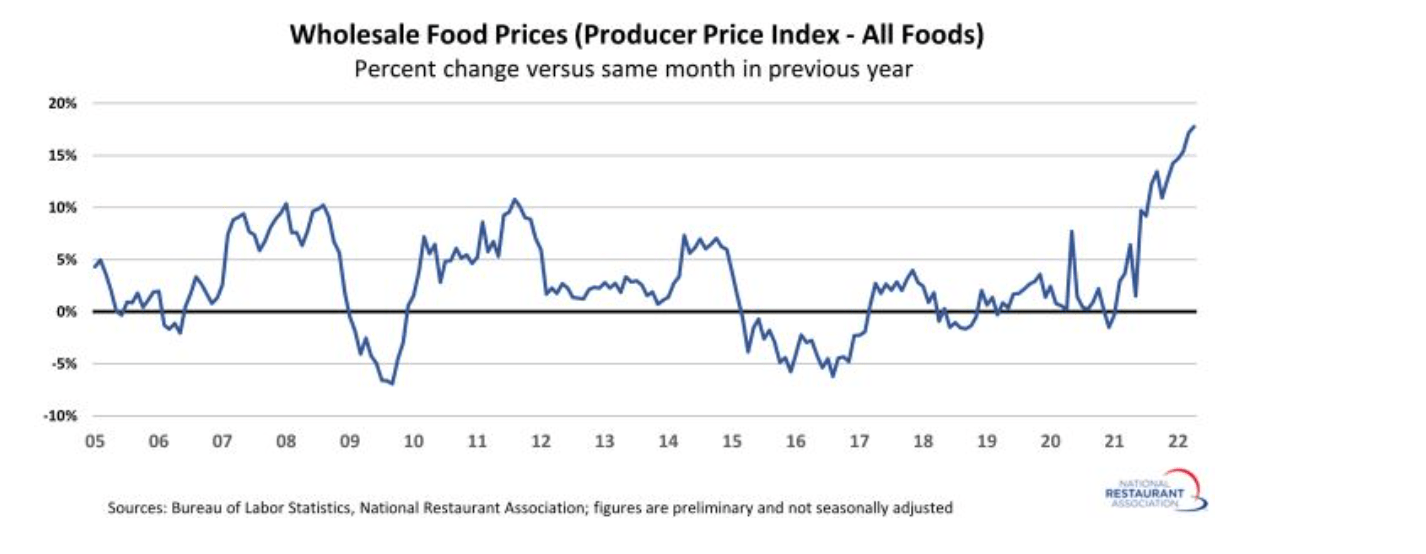
Given the tight labor market and that many other retailers continue to raise their minimum wages to ensure they can fully staff their stores, there looks to be upside pressure on labor costs for the foreseeable future. In addition, food and packaging costs aren’t letting up, leading to tighter margins for restaurant operators. The good news is that Applebee’s has a 98% franchised model, which is well above that of its peers like BJ’s Brewhouse (BJRI), Cracker Barrel (CBRL), and Cheesecake Factory (CAKE); hence it’s not seeing the direct hit from a margin standpoint. In fact, its position is industry-leading among casual dining brands (shown below). Dine Brands has just 69 company-owned Applebee’s within a system of ~3,400 restaurants (IHOP + Applebee’s).
Dine Brands – Percentage of System Franchised (Company Presentation)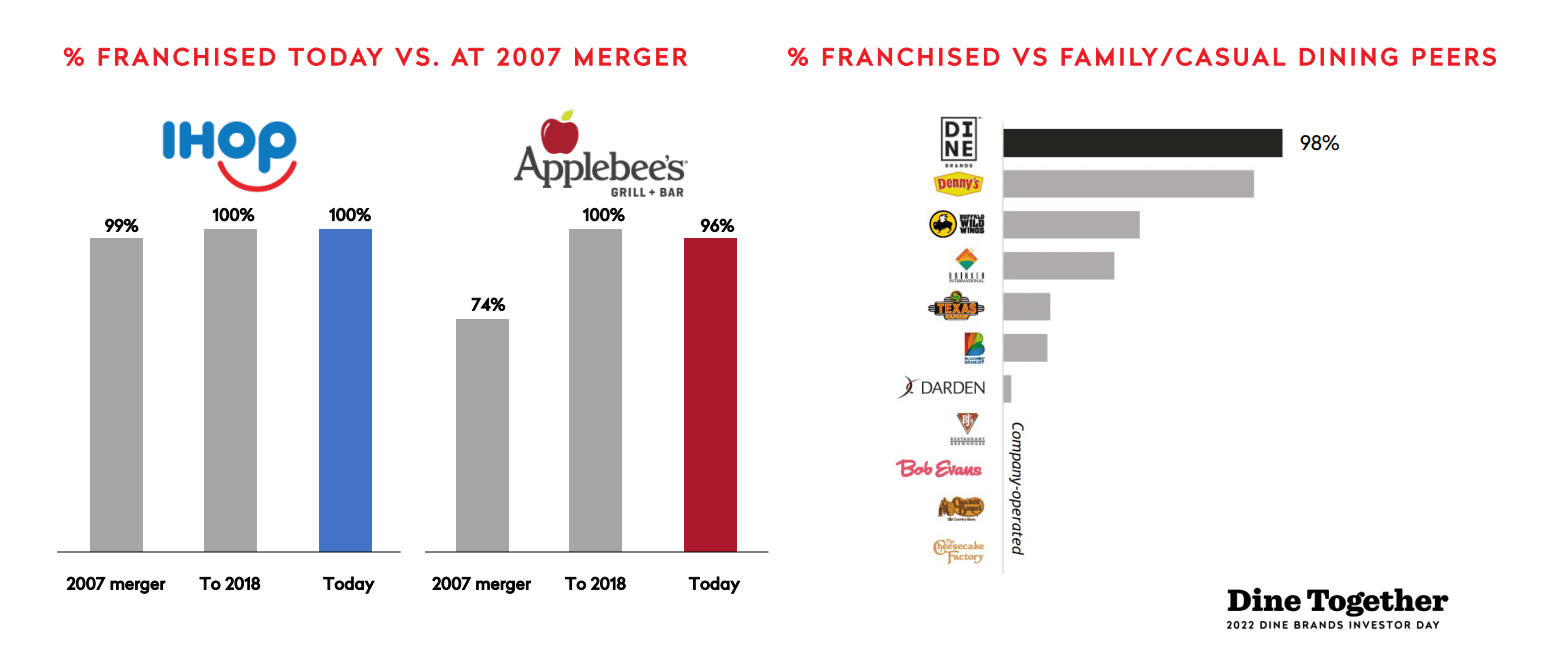
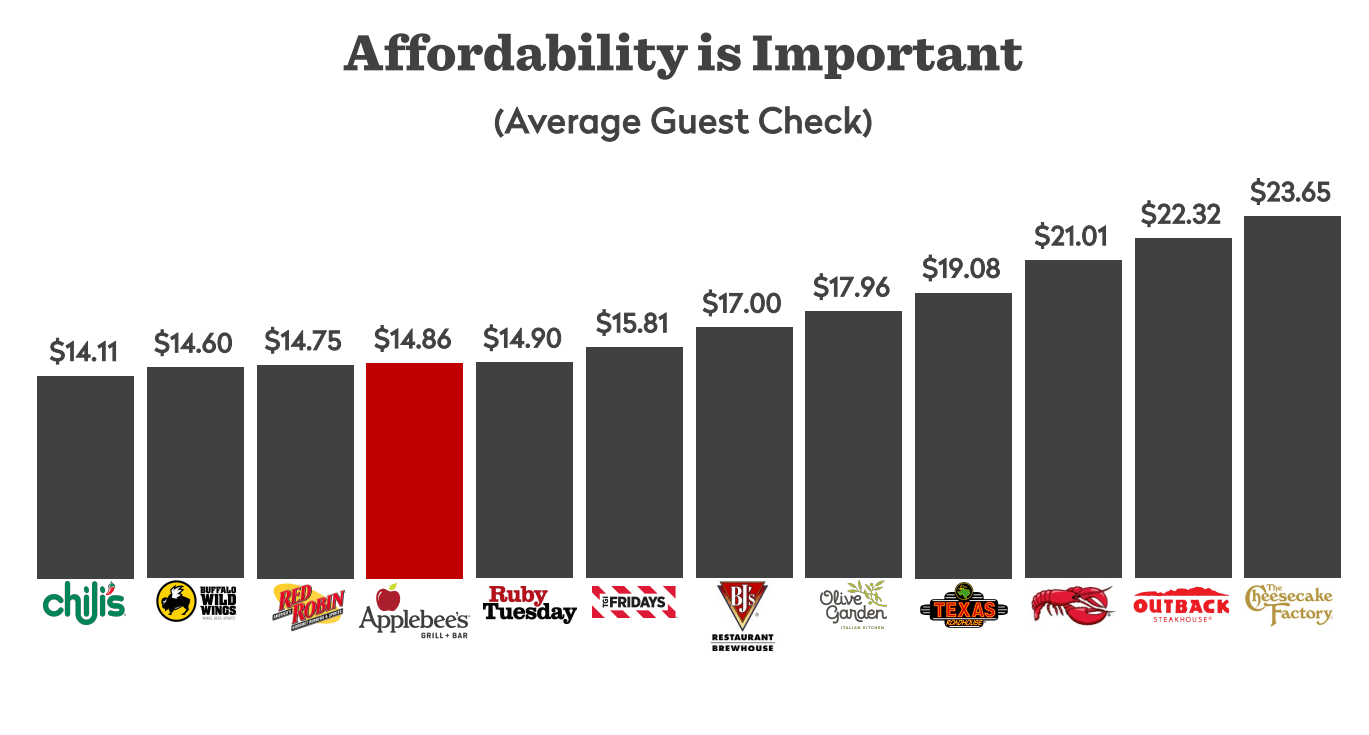
However, while Dine Brands will see less direct margin impact from inflationary pressures than its peers, it isn’t immune to a shrinking discretionary budget, which looks like what we’re seeing currently. The most recent dip in savings rates can be attributed to rising food and gas prices. With gas prices hugging the $5.00/gallon level, this should directly impact traffic for casual dining brands as some consumers look to curtail expenses. Fortunately, in the case of Dine Brands, Applebee’s is a clear winner from a value proposition standpoint, and while it’s still not cheap (~$15.00 average check) relative to traditional quick-service like McDonald’s (MCD), it is quite affordable.
United States Personal Savings Rate (TradingEconomics.com) Average Check – Casual Dining Brands (Company Presentation)
Based on this leading value proposition, one could argue that while Dine Brands could see a dip in traffic as consumers feel the pain of higher gas/grocery prices and higher mortgage payments, it might fare a little better than peers like Red Lobster and BJ’s Brewhouse. Hence, although Dine Brands has been punished along with the sector and a dip in traffic looks inevitable, it does appear a little better positioned to get through this hump. One key metric to watch will be check management even if we don’t see a dip in traffic, with a possibility that some guests opt to drop a drink (1 vs. 2) or an appetizer from their usual visit.
So, is this challenging operating environment priced into the stock yet?
Valuation
Looking at the below chart, we can see that Dine Brands has historically traded at ~14.2x earnings, and it currently trades at just ~10.5x earnings at a share price of $63.30 (FY2022 annual EPS estimates: $6.03). Normally, this would suggest that the stock is a Buy, given that it’s trading at a deep discount to its historical multiple while also paying an attractive dividend yield (~3.20%) relative to the industry average, boosting total return potential. However, the headwinds faced by the industry currently are near unprecedented, suggesting that using historical multiples to value the stock might be a little presumptuous. Instead, I think a more conservative earnings multiple to use is a 15% discount to its historical multiple: 12.1x earnings.
Dine Brands – Historical Earnings Multiple (FASTGraphs.com)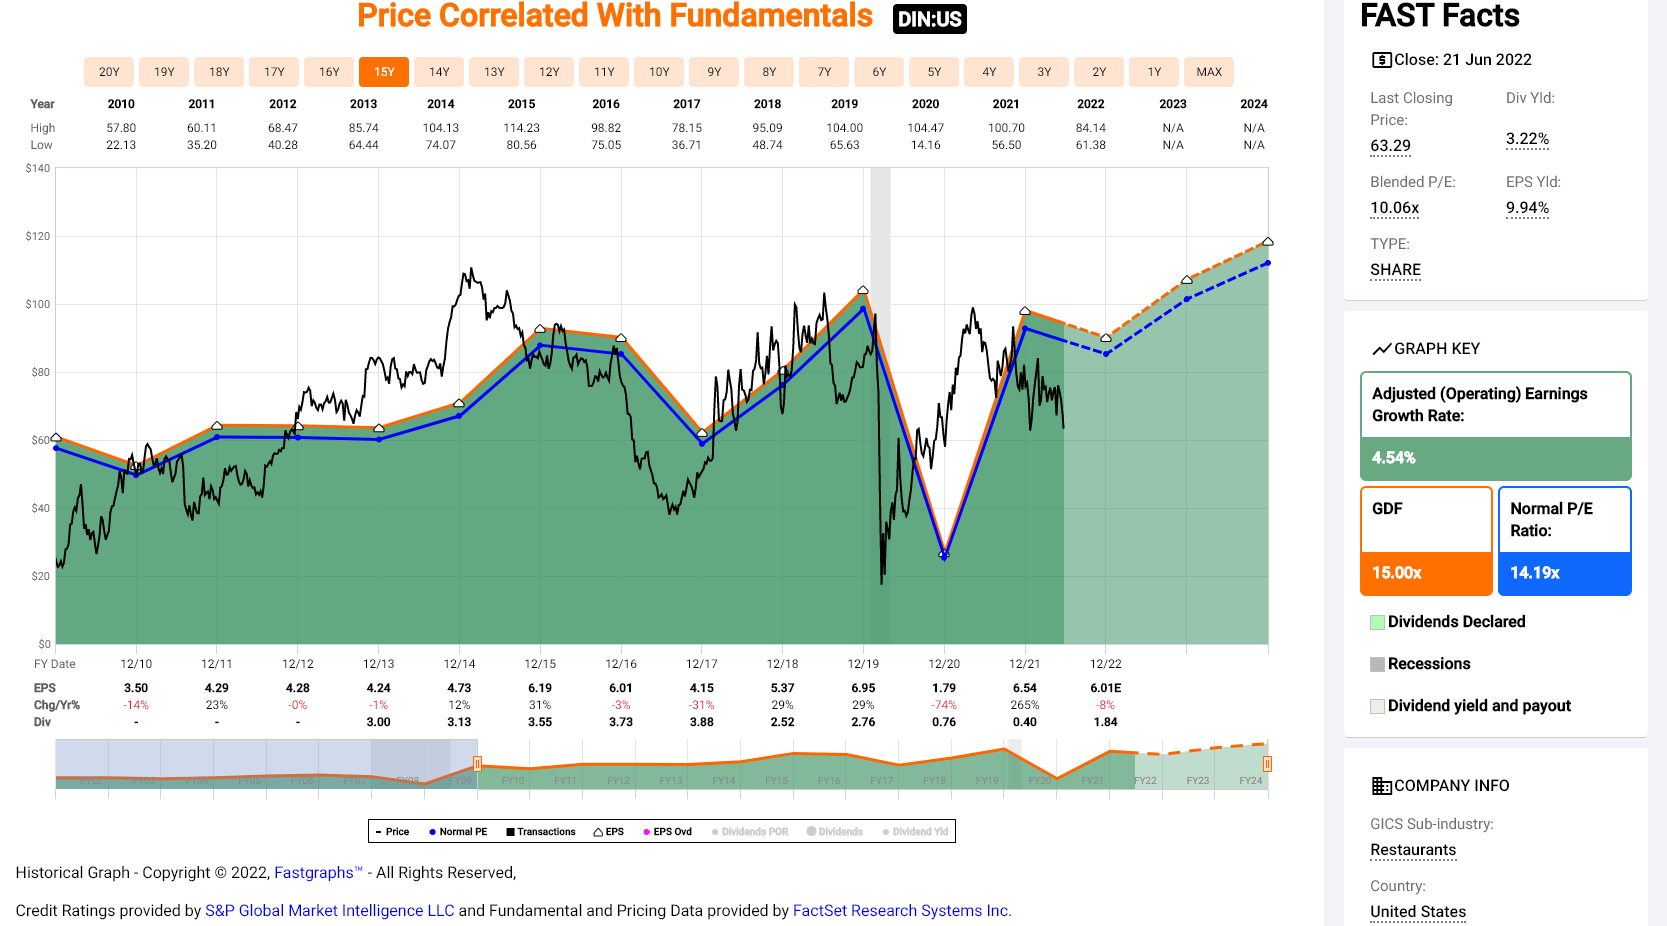
Based on a more conservative multiple of 12.1x earnings and FY2023 annual EPS estimates of $6.82, I see a fair value for the stock of $82.50, representing a 30% upside from current levels, or a ~33% total return. While this offers meaningful upside, I prefer at least a 30% discount to fair value to justify entering new positions. After applying this discount, Dine Brands’ low-risk buy zone from a valuation standpoint comes in at $57.80. This doesn’t mean that the stock can’t go higher, but the $57.80 area is what I would consider being a low-risk buy zone, with a low likelihood of double-digit drawdowns.
Technical Picture
Moving over to the technical picture, Dine Brands has broken below its previous support in the $70.00 region, and its next strong support level doesn’t come in until $60.60. This area represents previous resistance from 2020, and key resistance areas will often transform into new support. Meanwhile, the stock has no meaningful resistance until $81.20, nearly 30% above current levels. So, with less than $3.00 in potential downside to support and $17.90 in potential upside to resistance, the reward/risk ratio for Dine Brands is the most favorable it’s been since Q2 2020.
DIN Daily Chart (TC2000.com) S&P-500 Weekly Chart (TC2000.com)
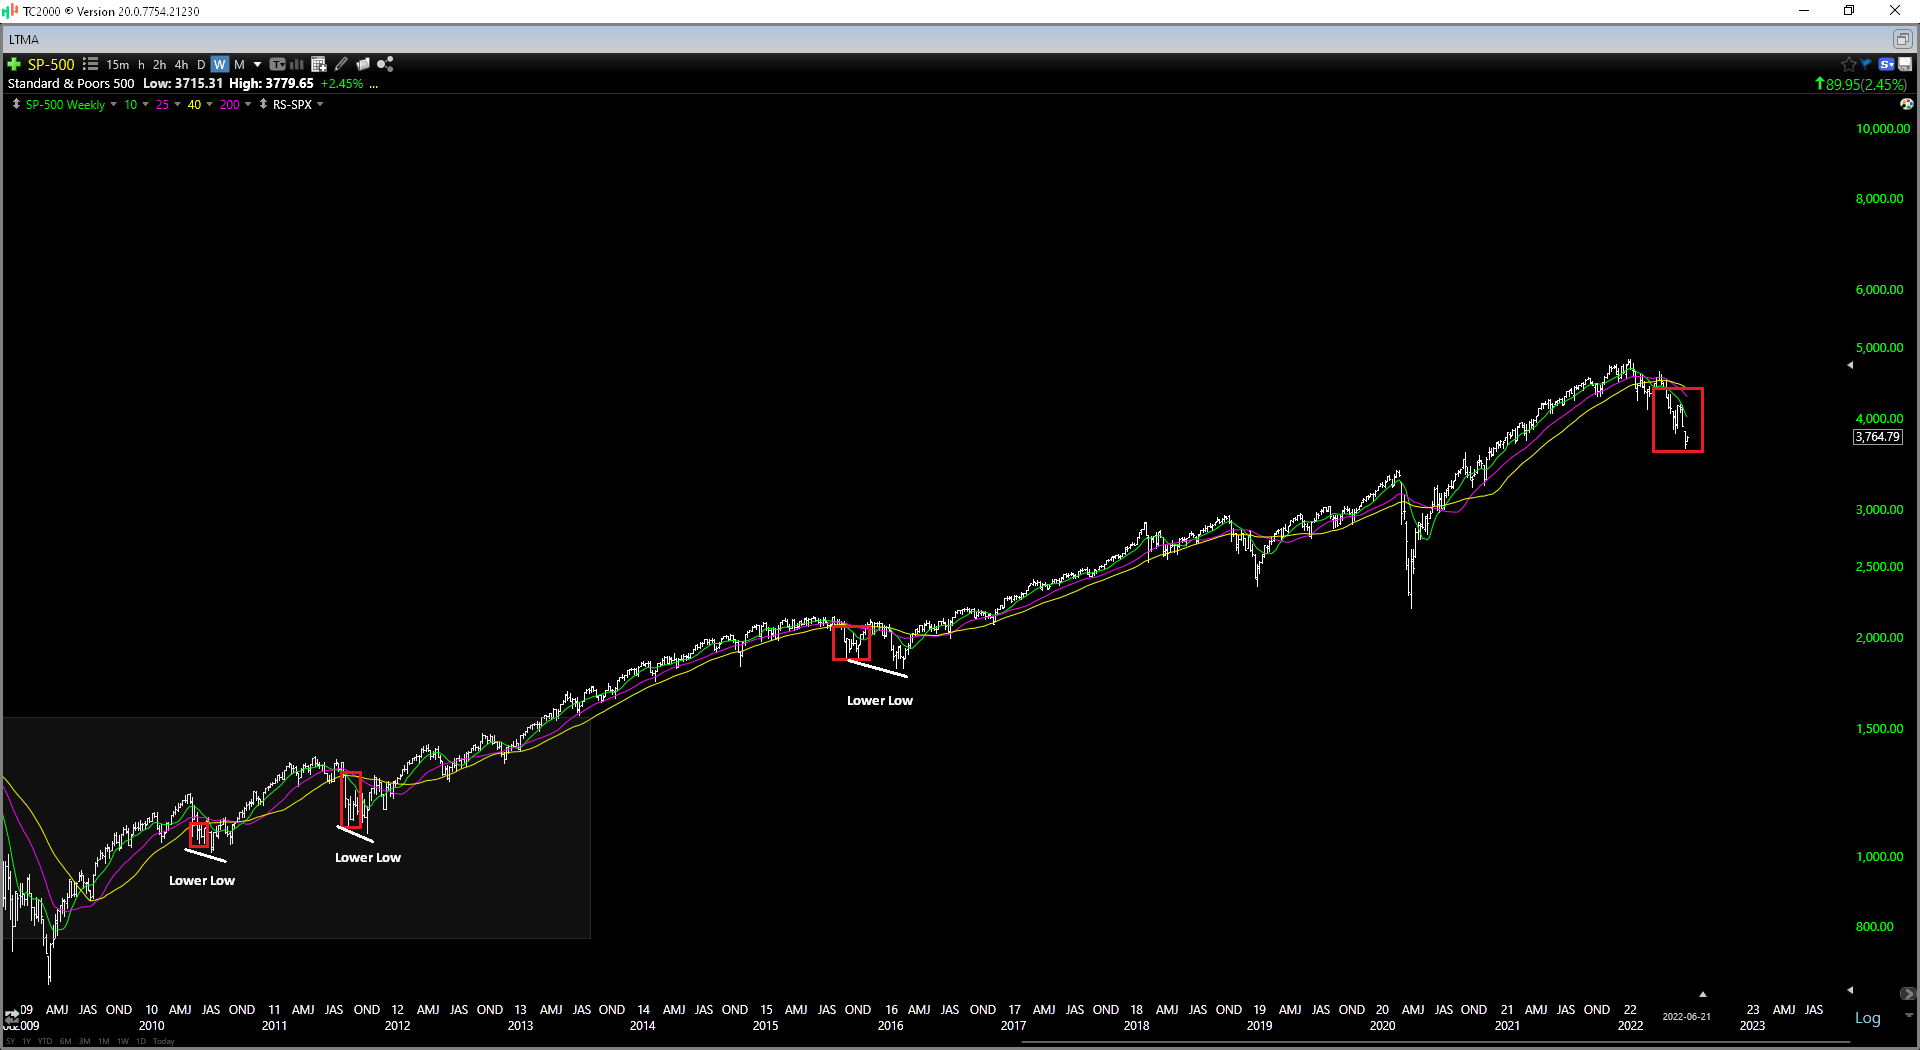
Having said that, the S&P-500 remains below all of its key moving averages, and while this hasn’t precluded sharp rallies in the past, we often see a lower low following a rally that leads to capitulation (2010, 2011, 2016). This may not be the case this time, but given the higher-risk technical backdrop, I believe it makes more sense to leave buy orders below key support levels, hoping to pick up stocks on a shake-out below support vs. buying at obvious support. For this reason, the more attractive buy point is $57.50, where DIN would be 5% below its expected support zone.
Summary
Given the negative sentiment for the industry, it’s possible Dine Brands has already bottomed, and waiting for lower prices could lead to a missed opportunity. However, unless buying industry leaders (top-3 names within a given industry), I prefer not to chase stocks and only buy at the right price, especially if we are in a cyclical bear market. Therefore, while I see a decent setup for Dine Brands at $63.00, I have adjusted my buy orders to $57.50. For now, I continue to favor Restaurant Brands International (QSR), which also trades at a deep discount to fair value, but could be more insulated than DIN if we do head into a recession.
Be the first to comment