

mtcurado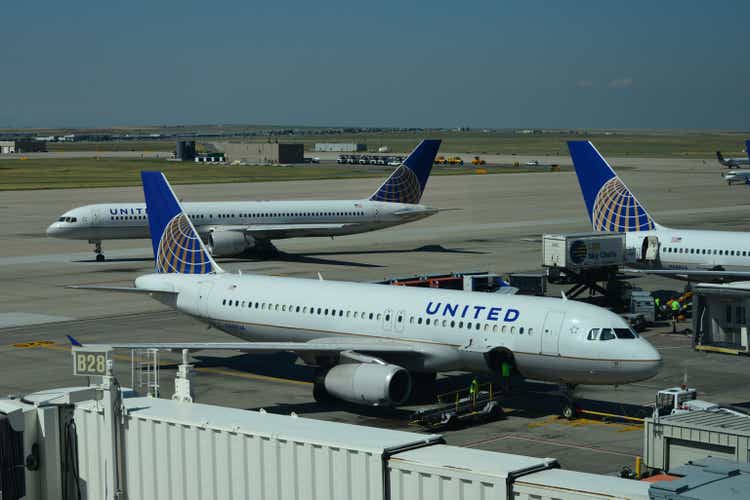
On Tuesday, December 13th, United Airlines Holdings (NASDAQ:UAL) announced a major overhaul of its aircraft fleet in the coming years by agreeing to purchase as many as 200 new Boeing (BA) aircraft. Seeking Alpha Contributor Dhierin Bechai wrote a piece in October here explaining United’s aging fleet and the need for upgrades.
The stock quote opened dramatically higher with the overall market on positive CPI news but then was hit by massive selling. Shareholders, both new and old, might be asking themselves why did UAL’s price tank.
It appears the likely addition of billions in debt (potentially $5 to $10 billion into 2032, depending on cash flows over many years to replace 200 of over 800 planes in its fleet) and/or issuance of new dilutive shares to pay for the Boeing planes may have struck a chord with forward thinkers, especially as the probability of recession during 2023 is getting harder to ignore.
Unfortunately for shareholders, United Airlines has a history of performing quite poorly during recessionary periods. For me, UAL’s wicked price decline of -7% on the day (reversal of -10% intraday) may be a warning for weaker prices coming in the first half of 2023.
A Worth Less Pick During Recessions
The primary ownership issue I have with UAL in December is recessions are not kind to passenger airlines. For businesses and consumers, travel is often a discretionary spending choice. When economic times are tough, trip demand typically implodes, and airlines are one of the first to suffer on Wall Street. Effectively, airline business models are deeply cyclical for profitability. High (capital spending intensive) debt loads with rising interest expenses are compounded by climbing labor wages and high energy costs at the end of a typical economic cycle. Then, a plunge in demand for flying services squeezes margins. Large operating losses occur at the tail end of recessions.
Wall Street forecasters get blindsided by the recession and income estimates from 6-12 months prior prove laughably inaccurate. If you are hoping to have time and the wherewithal to get out of your airline investments before stuff hits the fan, you may be quite disappointed with yourself next year.
I have been explaining the Treasury yield curve inversion problem and its successful prediction (cause) of recession historically through numerous articles starting in October. My latest November story on the topic is linked here. Another excellent article from several days ago on recessionary developments is linked here, written by SA Contributor Jon Wolfenbarger.
My view is enough evidence of an approaching recession exists that waiting another day to sell your United Airlines position mirrors the gameshow “Press Your Luck.” Moving forward, a Whammy could hit any day and begin to drain your brokerage account worth. Tuesday’s -10% UAL reversal is proof-positive of what may lie dead ahead.
During February 2006, the current United Airlines Holdings enterprise emerged from bankruptcy. (United entered bankruptcy during the original Technology Bust recession of 2002.) When we review two recessionary spans, including the 2007-09 Great Recession and the 2020 COVID-related pandemic shutdown of passenger air traffic, United Airlines has been hit hard by economic downturns. Below is a 16-year graph of price changes for the company, with U.S. GDP contractions shaded in grey.
YCharts – United Airlines, Price Change with Recessions in Grey, Since February 2006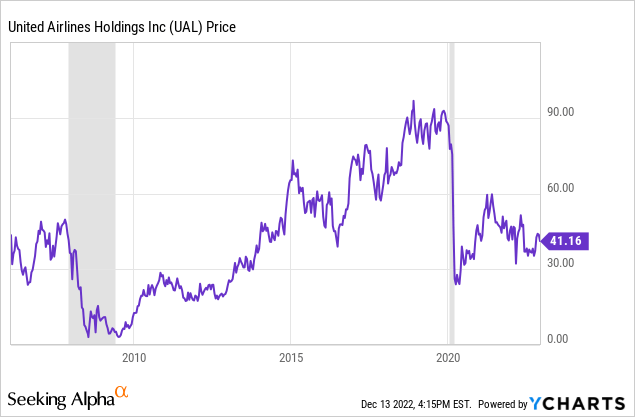
A close-up review reveals absolutely rotten performance during the previous recessions. The Great Recession implosion of -90% between late 2007 and the middle of 2009 is exactly the type of drop smart investors try to avoid at all costs. Below I have graphed UAL’s total returns, including any dividends, against the S&P 500 index.
YCharts – UAL vs. S&P 500, Total Returns, Recession in Grey, July 2007 to July 2009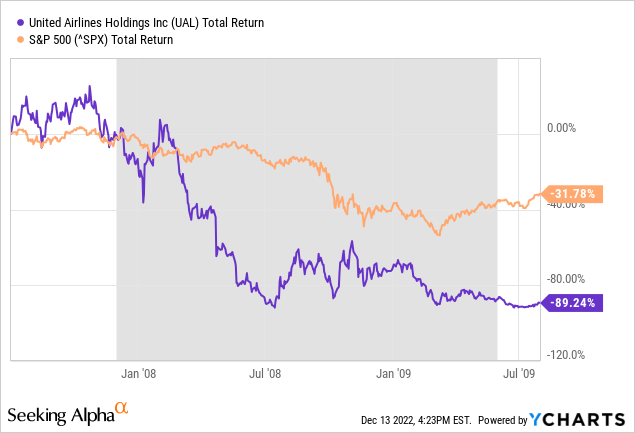
The 2020 pandemic wipeout of nearly -80% in value was not much better. Plus, airlines were not able to reopen operations in a normal manner all year. So, it remained a name to avoid well after the official recession in GDP ended. To be honest, even with the uptick in traffic during 2022, the company is still operating at large losses (-$2 per share over the trailing 12 months) with -$33 per share in losses reported since 2019.
YCharts – UAL vs. S&P 500, Total Returns, Recession in Grey, January to December 2020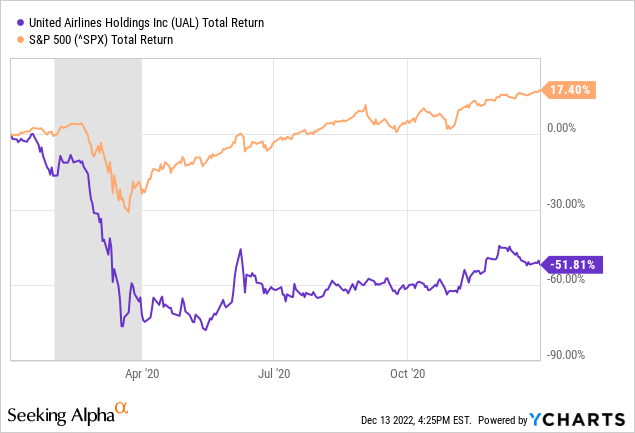
Fading Momentum
My biggest gripes with the United Airlines chart pattern are fading momentum and trading volume. I cannot find much to get excited about in the summary of its technical backdrop. In particular, I have boxed in orange below the slide in upside momentum, represented by volume stats (on the daily chart of changes). The November and early December circumstances witnessed the lowest trading volume since the early days of the pandemic in January 2020.
Price has struggled all year to make any headway. Plus, some of my favorite momentum indicators like the Accumulation/Distribution Line and Negative Volume Index have been sliding. This picture is typical of stocks with lackluster investor demand.
StockCharts.com – UAL, Daily Price & Volume Changes, with Author Reference Point, Since June 2021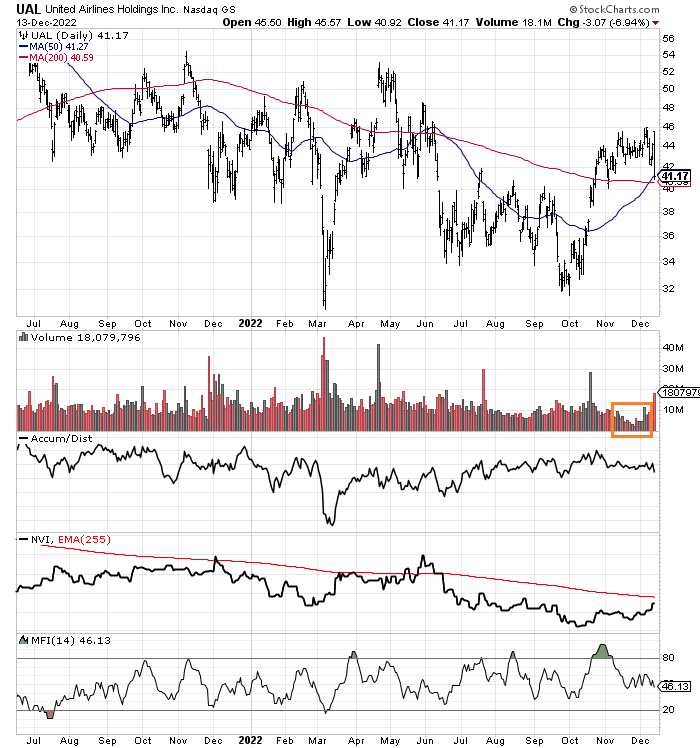
The late 2007 peak in price had a similar looking chart to today. A few months of low trading volume pinpointed the top. Balance Volume and the Negative Volume Index were each unable to make any real headway going into the Great Recession.
StockCharts.com – UAL, Daily Price & Volume Changes, with Author Reference Point, July 2006 to July 2008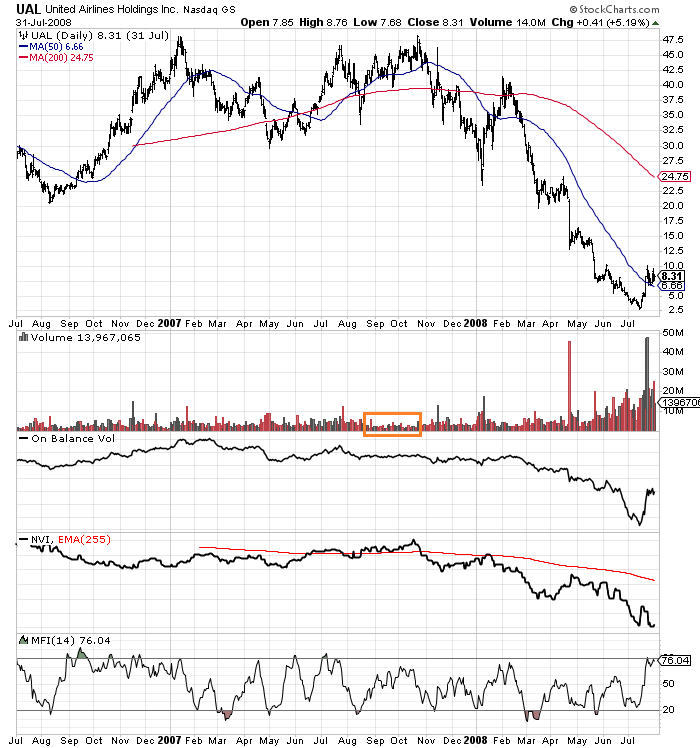
Interestingly, UAL has not been able to fully recover from the horrific 2020 operating environment during the pandemic. Government bailouts for airlines, added debt in the tens of billions, and heavy share issuance have kept the corporation afloat. For investors, today’s $41 quote remains less than half of highs in the upper-$90s during 2018-19.
In 2019, months of low trading volume action (boxed in orange on the weekly chart below) were part of the topping process. On Balance Volume, trends were also flat to weak. The blue line represents UAL’s 2-year moving average of price, which has proved incredible resistance yet to be meaningfully breached.
StockCharts.com – United Airlines, Weekly Price & Volume Changes, with Author Reference Points, 5 Years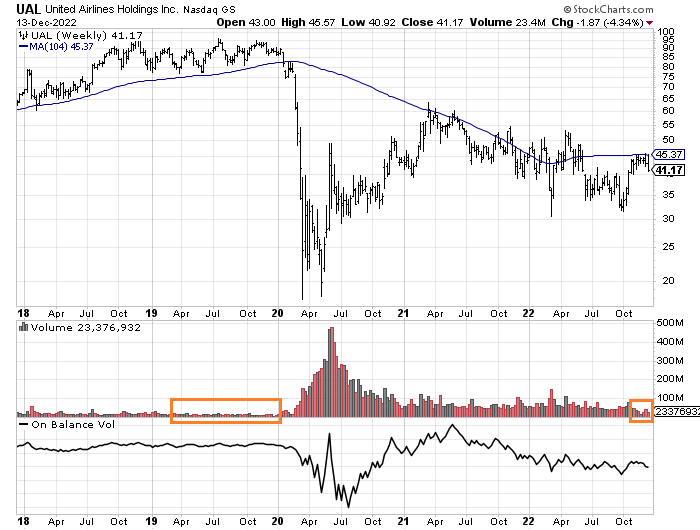
Final Thoughts
Wall Street analysts are calling for a better 2023 in operating profitability. The problem is a recession could easily crash earnings into negative territory again for a fourth straight year. Net financial debt (total debt minus cash) vs. operating cash flow has been stretched to modern record levels since 2020 (using data back to the early 1990s before the 2002-06 bankruptcy). And, the purchase of new planes in future years will make it even more difficult to pay bills (raising debt levels), especially if a prolonged recession occurs in 2023-24 (reducing cash flow and income generation).
YCharts – United Airlines, Net Financial Debt vs. Trailing Operating Cash Flows, Since 1993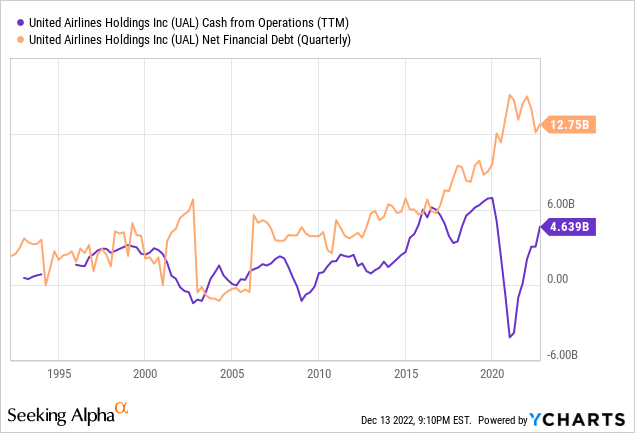
In my research, there are too many variables working against an investment in United Airlines. Extended leverage during a recession is a recipe for disaster, by itself. Adding insult to injury, any effort to buy new planes without strong existing cash flow is a risky financial exercise.
I rate UAL as a Sell/Avoid in portfolio construction. If a recession was not our immediate future, I would still rate United Airlines between an Avoid and Hold selection. Air travel traffic is not guaranteed to grow, even if COVID-19 disruptions are over. What if the 2022 recovery in travel and leisure numbers was more based on pent-up pandemic demand (previously shut-in), not to be repeated in 2023? In that case, United will find it quite difficult to hit current Wall Street expectations of $2 to $3 in EPS.
Further, I am not optimistic on the whole airline sector as we enter recession. Competitor/peer airline stocks also fell hard on Tuesday and are facing many of the same fundamental operating issues set to squeeze profit margins in 2023. I wrote a bearish take on Boeing weeks ago here, as fanciful plane orders usually get delayed or cancelled when industry declines in passenger traffic arrive. In the end, a reevaluation of aircraft “orders” made a year or two ago is inevitable in today’s market because of sharply rising interest costs on debt. Unfortunately for Boeing shareholders, the company is carrying record debts and still struggling to reach profitability after the pandemic.
Of course, if the economy can somehow survive the new year without entering a steep recession, breaking the mold of past inverted bond market yield curves and spending contractions caused by rampant inflation, while ignoring possible new black swan economic events soon, UAL’s stock quote could drift somewhat higher. My best-case economic scenarios are projecting price may still trade closer to $60 per share, while worst-case deep recession modeling could send United Airlines well under $10. Using risk-adjusted analysis, I would rather deploy new capital into “defensive” company setups with P/Es in the 10x to 15x range, paying dividend yields of 3% to 4% annually.
Thanks for reading. Please consider this article a first step in your due diligence process. Consulting with a registered and experienced investment advisor is recommended before making any trade.
Be the first to comment