

undefined undefined/iStock via Getty Images
Investment thesis: The (NYSEARCA:DIA) is currently a hold. Since it’s comprised of larger, well-established companies, it should hold its own in the current environment. But there are growing recessionary signs, which all equity traders should keep in mind.
The DIA, which is issued by State Street Global Investors, is designed to mimic the Dow Jones Industrial AverageSM:
The SPDR® Dow Jones® Industrial AverageSM ETF Trust seeks to provide investment results that, before expenses, correspond generally to the price and yield performance of the Dow Jones Industrial AverageSM (the “Index”)
Here are the index’s 10 largest holdings:
DIA 10 largest holdings (State Street Global Investors)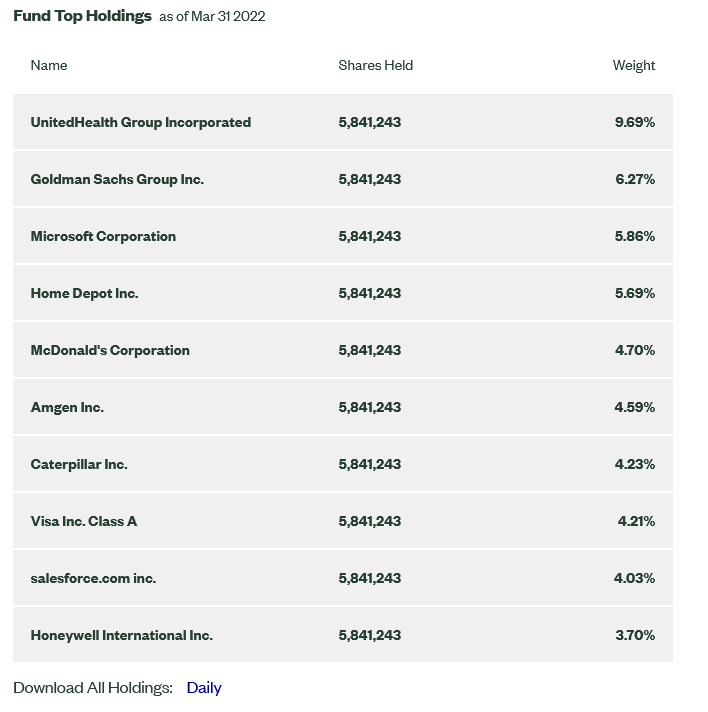
The Dow (as it is more popularly called) is a bit of an anachronism at this point. When it started, there were fewer publicly-traded companies, and the US economy was far more concentrated. Now, an index of only 30 companies seems out of place and somewhat limited. Yet, the Dow is still widely cited in the financial press, meaning it is still relevant.
My standard method of analyzing an index-tracking ETF is to first look at the macroeconomic backdrop to determine if the economy is expanding or contracting. Then I compare the ETF’s performance to that of its index-tracking peers followed by a look at the charts.
This analysis will utilize the long-leading, leading, and coincidental indicator methodology developed by Arthur Burns and Geoffrey Moore.
Long-leading indicators
M2 and BBB yields (FRED)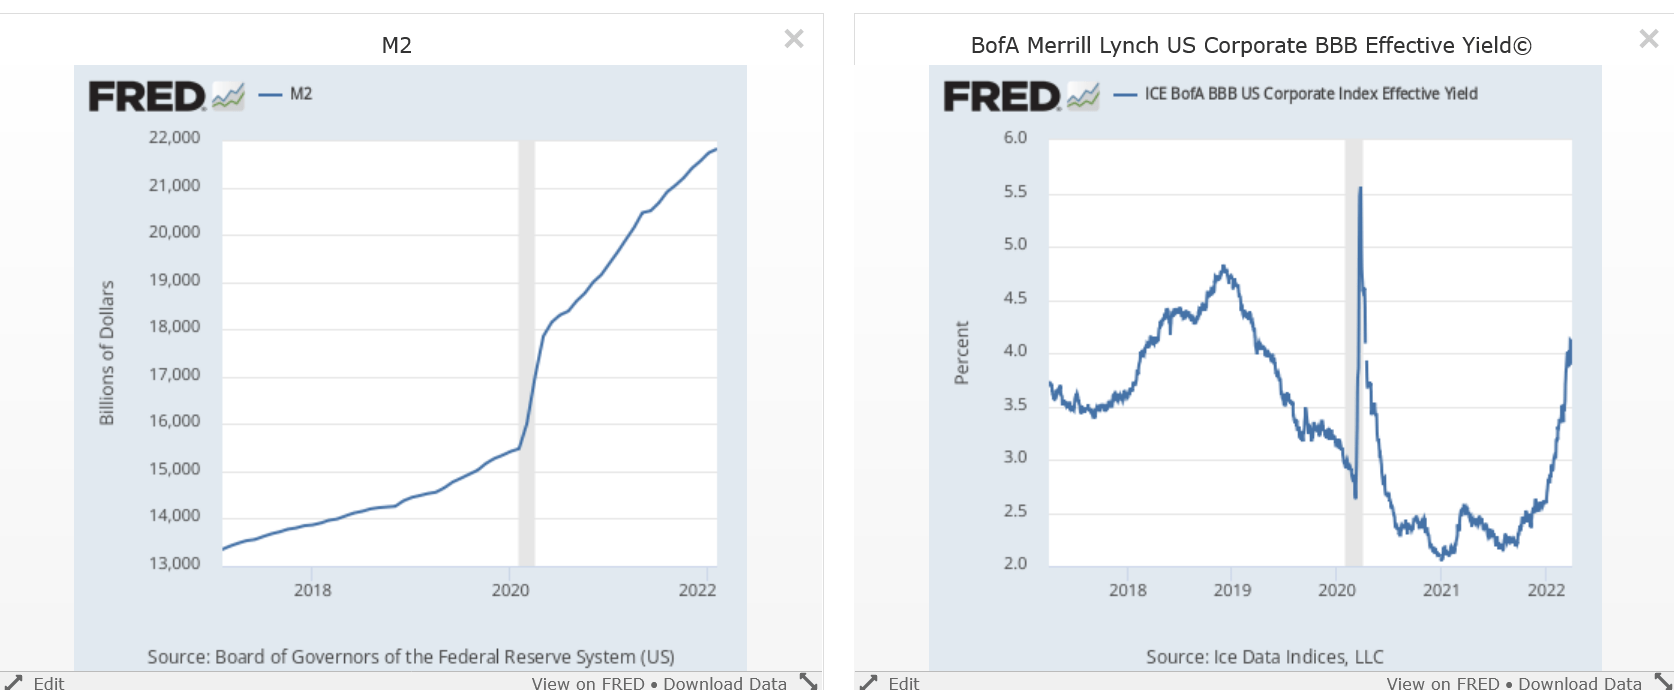
While M2 continues to increase (indicating there is ample liquidity), BBB yields are rising, which is bearish.
Corporate profits are in good shape:
The numbers are in: 2021 was the most profitable year for American corporations since 1950.
Profits surged 35% last year, according to data published on Wednesday by the Commerce Department, driven by strong household demand, which was underwritten by government cash transfers during the pandemic. In all four quarters of the year, the overall profit margin stayed above 13%, a level reached in just one other three-month period during the past 70 years.
First quarter earnings are projected to continue growing, but at a slower pace:
Earnings Growth: For Q1 2022, the estimated earnings growth rate for the S&P 500 is 4.8%. If 4.8% is the actual growth rate for the quarter, it will mark the lowest earnings growth rate reported by the index since Q4 2020 (3.8%)
Leading Indicators
Durable goods and goods excluding aircraft (FRED)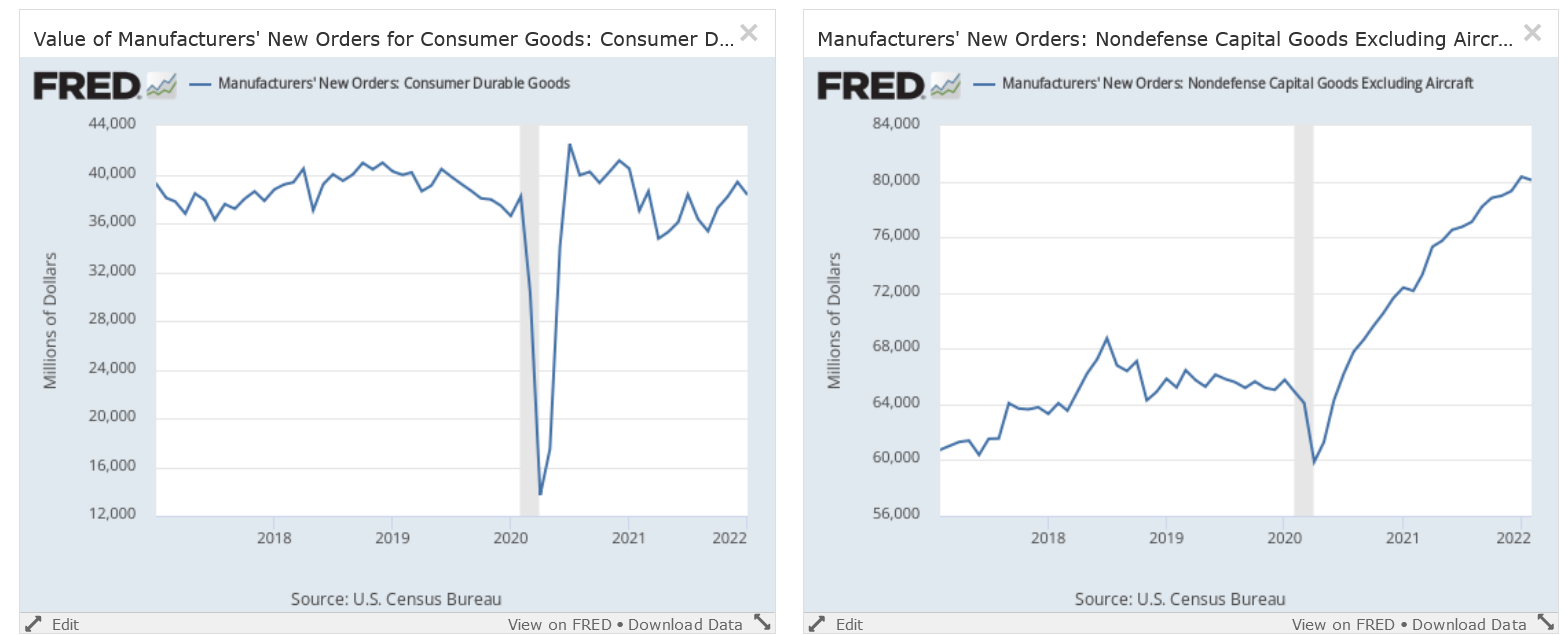
Total durable goods orders (left) quickly rebounded after the recession and have been trending sideways since. Durable goods ex-transportation (right) recently dipped after a very strong expansion.
1-unit building permits and average weekly hours of employees (FRED)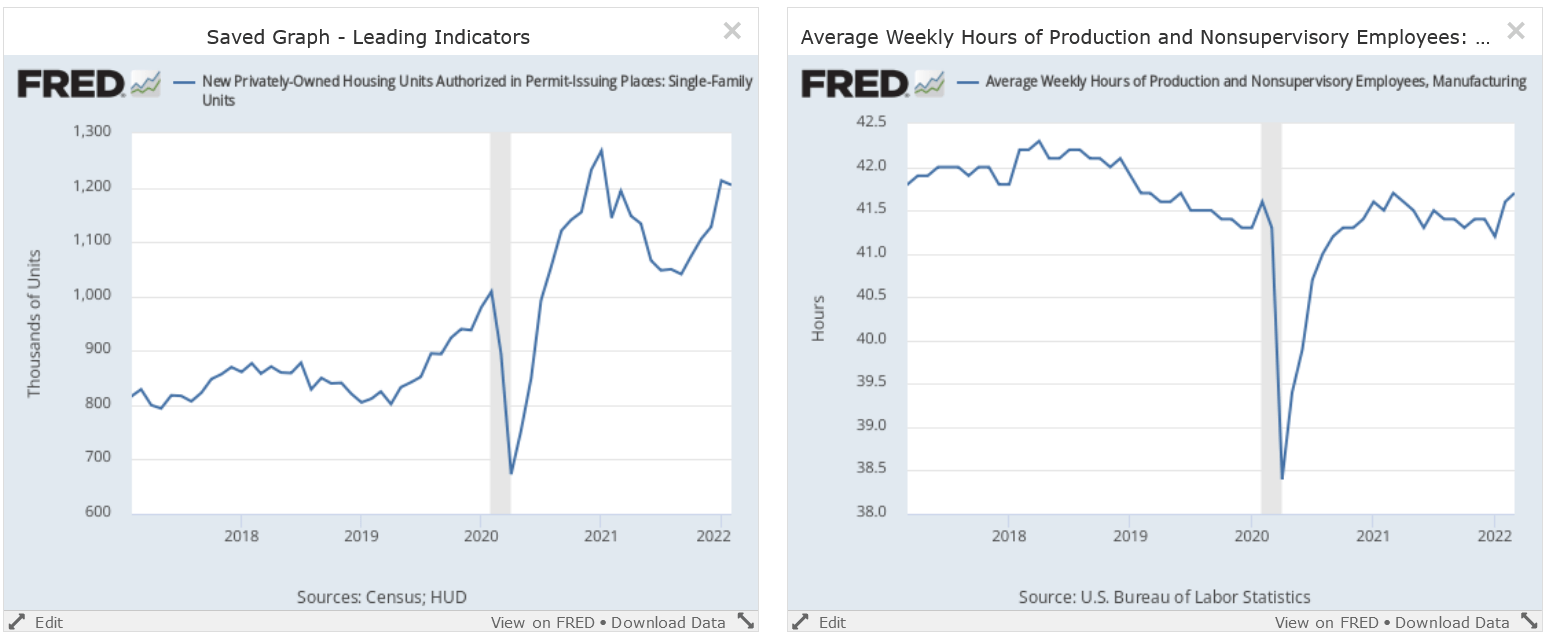
1-unit building permits (left) are near a 5-year high, while the average weekly hours of production workers (right) is near a high for this expansion.
Commercial paper less federal funds and 4-week moving average of initial unemployment claims (FRED)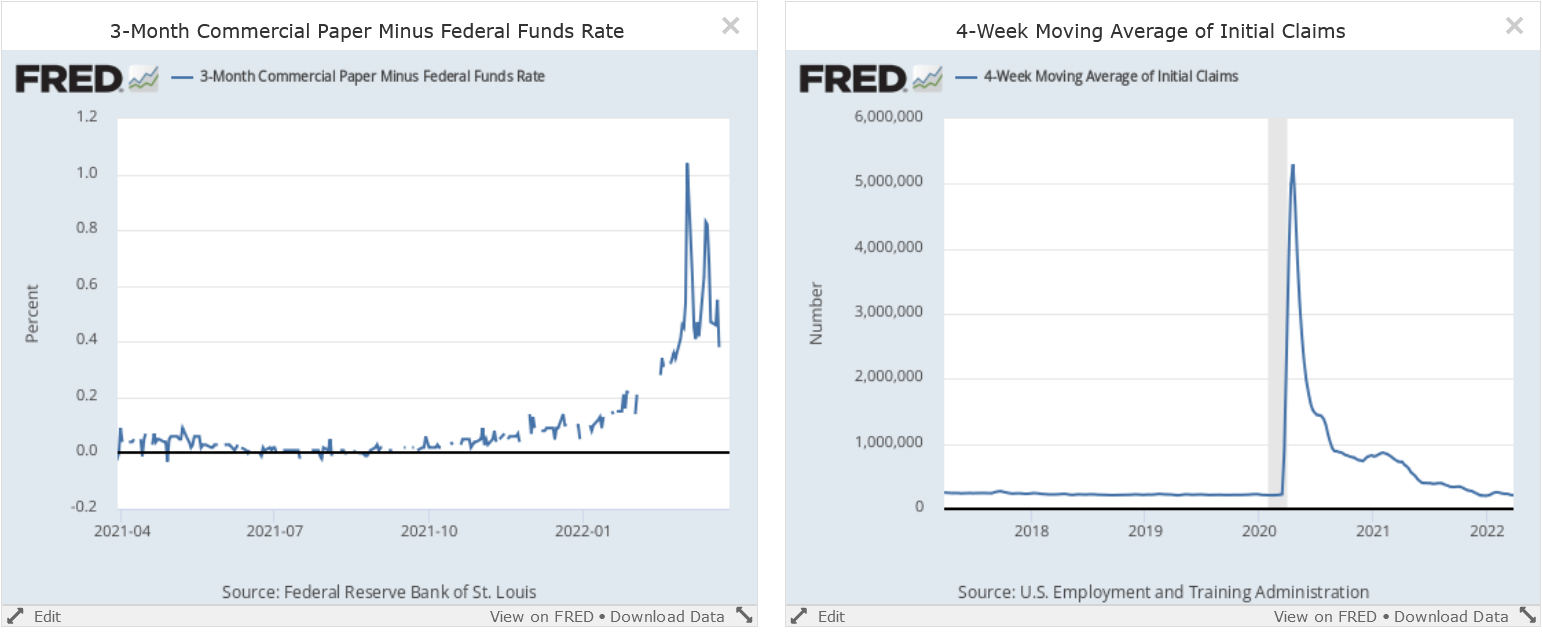
The 3-month commercial paper rate has recently widened versus the fed funds rate. The 4-week moving average of initial unemployment claims (right) has returned to low levels.
10-year-2-year treasury spread (FRED)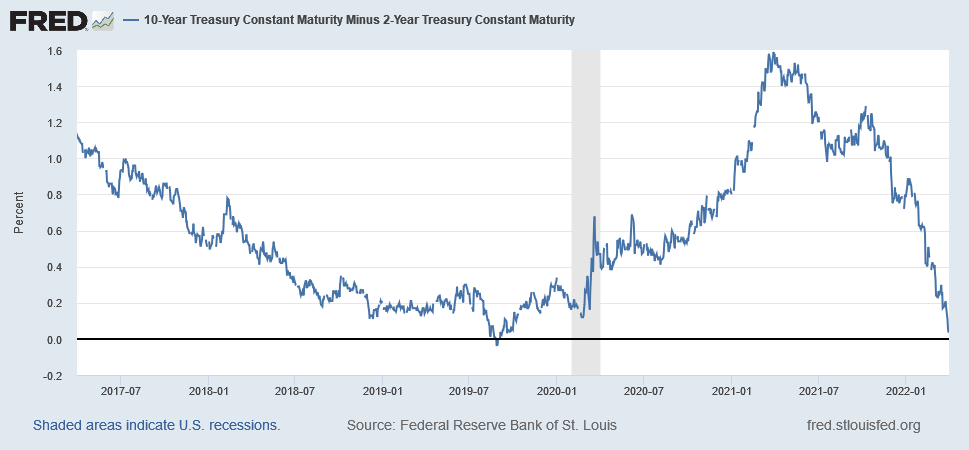
The 10-year-2-year spread continues to tighten.
S&P 500 (FRED)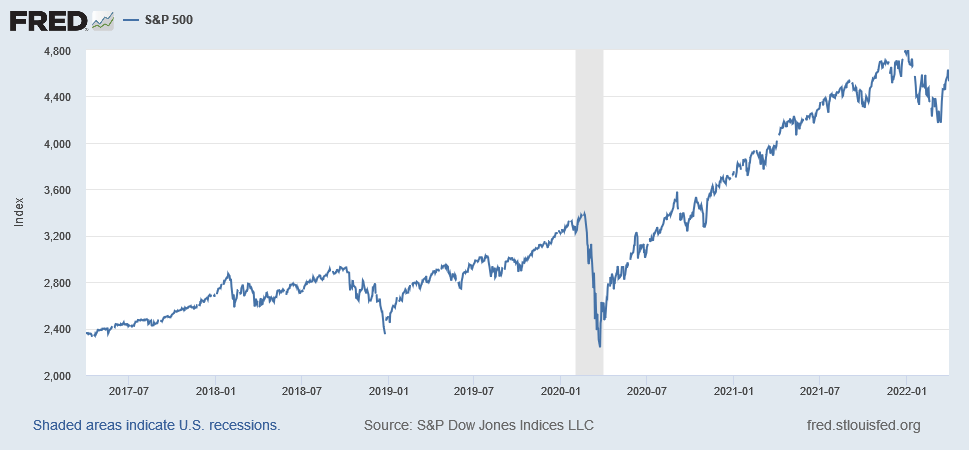
The S&P 500 peaked earlier this year.
Coincidental Indicators:
4 coincidental indicators (FRED)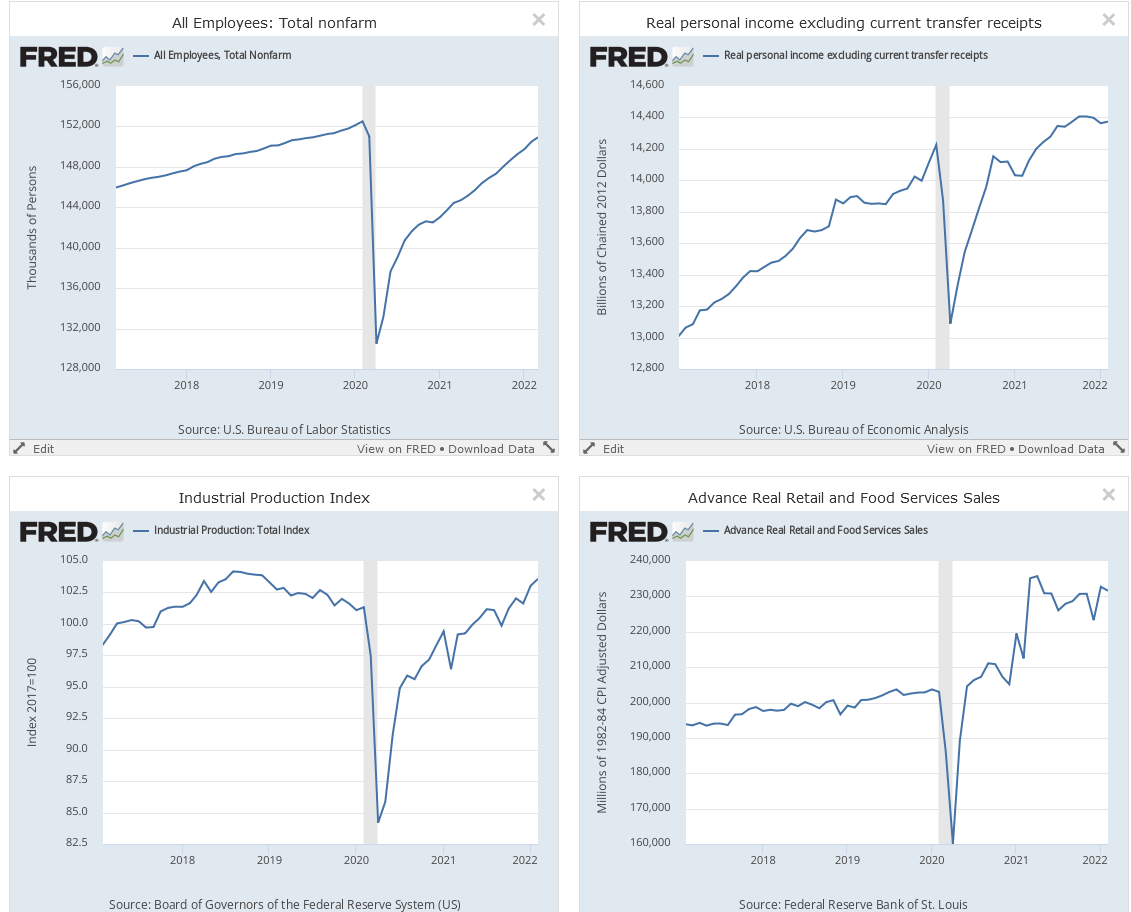
All four coincidental indicators continue to expand.
The following table organizes the data:
Long-leading, leading, and coincidental indicators (FRED; author’s calculations)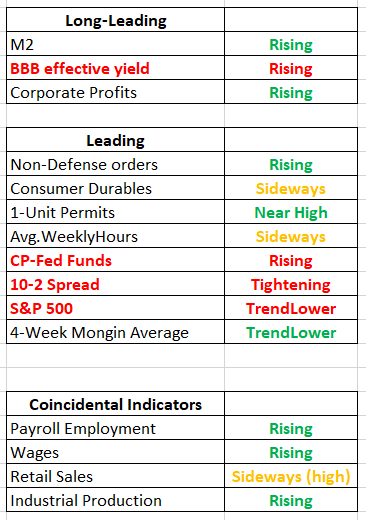
The non-financial data is still positive. But there are signs of concern in the financial data. This is usually what happens before a recession: the credit markets tighten, and the yield curve inverts. And this is before we add in the tightening Fed variable, which is also bearish.
Adding it all together, there are reasons to be concerned going forward.
Next, let’s compare the DIA’s performance to that of its other index-tracking ETFs, which are the IWC, IWM, IJH, SPY, QQQ, and OEF (seven total):
| Week | Month | 3-Month | 6-Month | 1-year | |
| DIA’s relative performance | 5th | 4th | 1st | 3rd | 4th |
Data from Finviz.com
The DIA’s performance has been middle of the road.
Finally, let’s take a look at the charts:
DIA weekly and daily (FRED)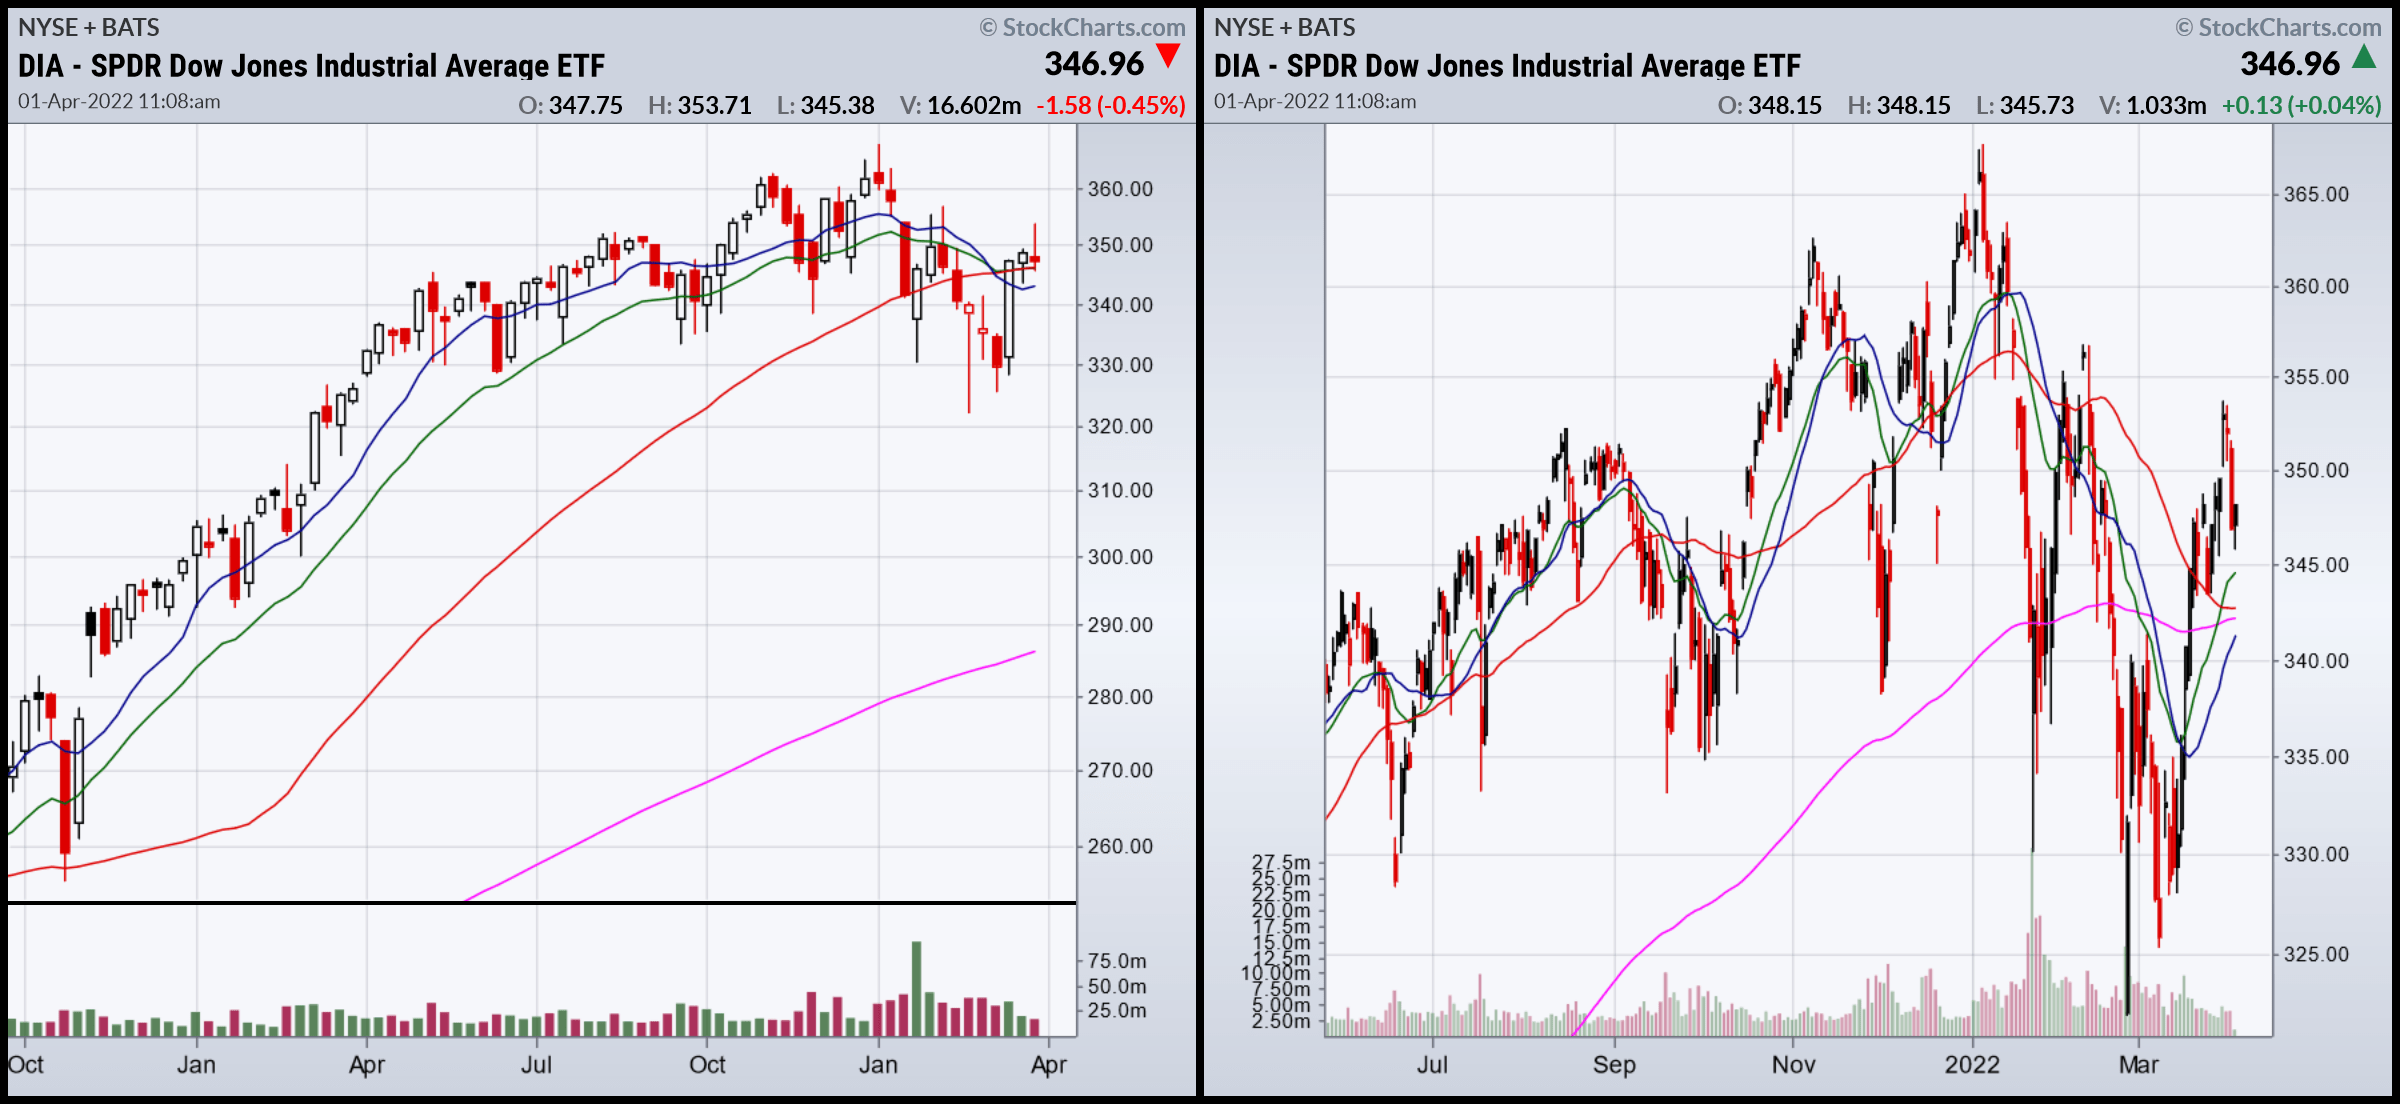
The weekly chart (left) shows that the DIA has been trading more or less sideways since last summer. The daily chart (right) adds some detail but also shows that there’s a fair amount of volatility.
The overall tone of the market has clearly shifted to larger caps. But it’s not all peaches and cream; traders are becoming more concerned about the Fed’s hawkish posture and credit market tightness. The DIA is currently a hold because it fits into the larger-cap movement that we’re currently seeing in the market. But don’t add to an existing position right now — there are simply too many variables that could send the market lower.
Be the first to comment