

PM Images
Investment Thesis
The iShares Core Dividend Growth ETF (NYSEARCA:DGRO) offers nearly 10% annual dividend growth, diversifies across 99 GICS industries, and has a cheap 0.08% expense ratio. These features make it most appropriate for long-term investors, particularly younger ones desiring large dividend payments later in life. However, my rating is only a hold because it lacks much downside protection, and I’m uncertain which way the market will lean over the next few months. This article reviews these pros and cons in more detail, and I hope to provide insights into two other dividend ETFs that look fundamentally stronger.
ETF Overview
Strategy and Company Snapshot
DGRO tracks the Morningstar US Dividend Growth Index and reconstitutes annually in December. Key requirements are for U.S. companies to have five years of consecutive dividend growth, dividend payout ratios less than 75%, and a positive consensus earnings forecast.
An additional screen I like is excluding the top 10% of companies by yield. Not only do I think this helps from a total returns perspective, but it should also improve dividend growth. High-yielding stocks are often that way for a reason, and persistent poor results due to lagging sales and earnings are usually early warning signs for a dividend cut. One final noteworthy screen is that companies’ distributions must be qualified, meaning you won’t find any REITs in DGRO. In my view, this hurts the ETF from a diversification perspective, but it’s a problem quickly solved by adding a cheap, low-cost fund like the Vanguard Real Estate ETF (VNQ) to portfolios.
The following table summarizes DGRO’s sector allocations and the top five holdings in each sector. This snapshot covers 54% of the ETF, which I believe is more helpful than presenting the fund’s top holdings. The most concentrated industries with meaningful weights are Consumer Discretionary, Consumer Staples, and Health Care, which total 36%. However, these 15 holdings represent 24%, so I recommend scanning these stocks to ensure you’re comfortable with most of them before buying DGRO.
The Sunday Investor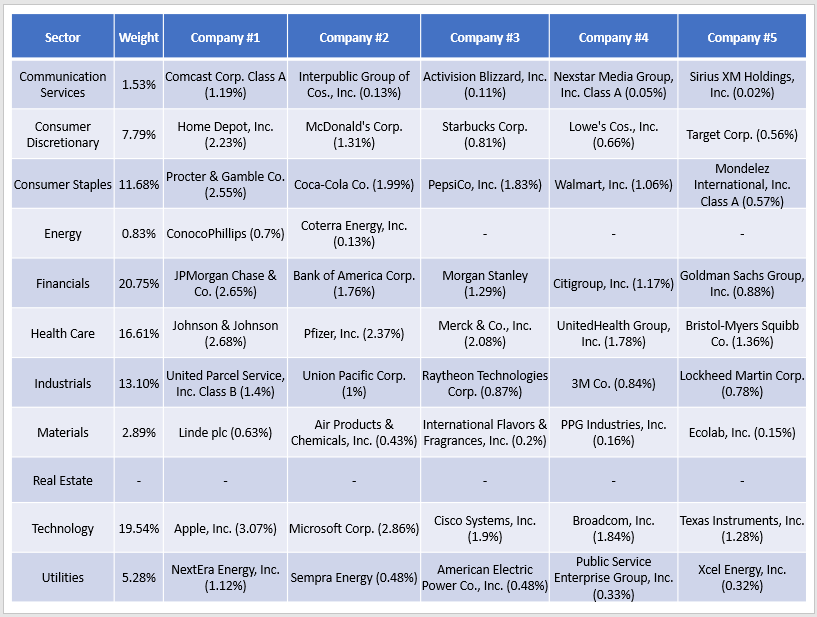
Apple (AAPL) and Microsoft (MSFT) are the two largest holdings because the Index is indicated dividend dollar weighted with a 5-3-50 capping rule. This means constituents are weighted according to the total dividends paid, calculated by the product of a company’s outstanding shares, free float factor, and annualized dividend per share. Apple and Microsoft have an advantage because of their size, but ultimately, this weighting scheme drives down the yield. Currently, DGRO yields just 2.15%.
I believe the capping rule aims to offset this effect to make the Index better diversified and more attractive to yield-focused investors. The 5-3-50 rule follows a B-A-C format, with A representing the maximum weight of any security at each quarterly rebalancing (i.e., 3%). I believe the remaining parts mean that the sum of the uncapped weights of securities above 5% can’t be more than 50%. To see the impact, I calculated these uncapped weights and made the following observations if a rebalancing were to occur today.
1. Apple, Microsoft, Johnson & Johnson (JNJ), and JPMorgan Chase (JPM) have uncapped weights of 4.08%, 5.11%, 3.28%, and 3.21%.
2. All four companies would have their weights capped at 3%. Since the weighted-average forward yield for these stocks based on uncapped weights is 1.75%, this rule slightly improves DGRO’s yield.
3. The B-C rule doesn’t apply and barring any significant turnover of higher-yielding companies, I can’t see it having any impact in the future.
Performance
Since its launch in June 2014, DGRO has gained an annualized 10.80% compared to 10.70% for the SPDR S&P 500 ETF (SPY). You can see that around the pandemic, SPY pulled ahead because of its higher exposure to Technology stocks. For the same reason, DGRO caught back up. YTD through September 15, DGRO has declined 12.08% compared to 17.26% for SPY and is generally a less-volatile ETF. All great stuff if you’re looking for market-like returns with a bit of safety.
Portfolio Visualizer
64 U.S. Dividend ETFs are trading today, but only 29 have at least the same track record as DGRO. Here are performance, yield, and five-year dividend growth metrics for all these ETFs.
The Sunday Investor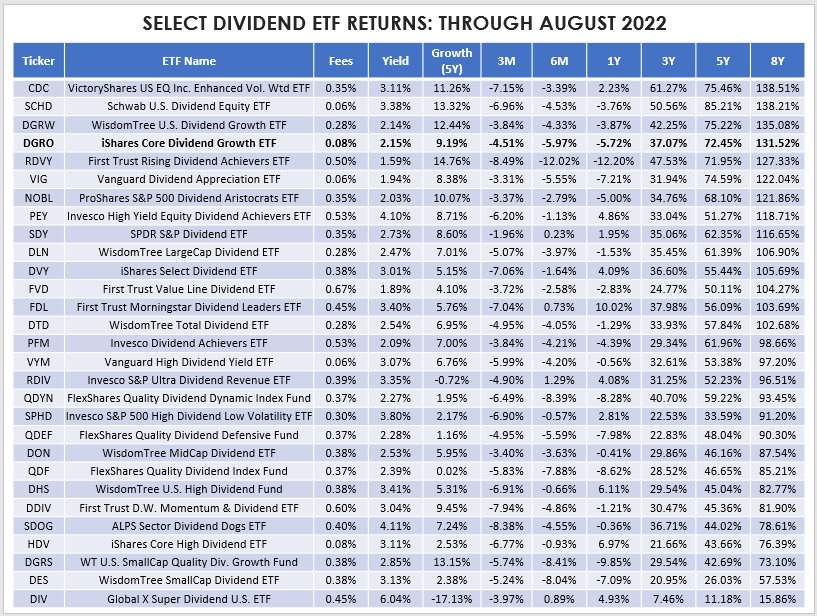
Over the last eight years, DGRO’s 131.52% return was 4th best behind CDC, SCHD, and DGRW. Its 9.19% five-year dividend growth rate is 8th best, but its 2.15% trailing dividend yield is 7th worst. Hypothetically, if returns, dividend growth, and dividend yield are equally important to you, CDC ranks the best. If you also want to consider fees, SCHD wins, closely followed by the Vanguard Dividend Appreciation ETF (VIG).
Over the last twelve months, DGRO declined by 5.72%, which was the 7th worst. ETFs like FDL, HDV, and DES gained between 6-10% due to their higher Energy and lower Technology sector exposures. I believe sector and industry composition are the most crucial factors total return investors should consider. If Energy prices remain elevated and Vanguard’s long-term projections for U.S. growth stocks materialize, there’s no reason to think DGRO will be a top performer as we advance.
Unfortunately, this reality means the lowest-cost ETFs may underperform. However, I don’t think this means you need to sell DGRO. Assuming you’re still into the accumulation phase, slowly adding low-cost sector ETFs can help you get to a more balanced sector allocation. Recall how DGRO needs help with Communication Services, Energy, Materials, and to some extent, Utilities. XLC, XLE, XLB, and XLU currently yield 1.14%, 3.41%, 2.17%, and 2.65%. XLE and XLU would be helpful in a persistently high inflationary environment and should also boost your portfolio’s yield in the meantime.
ETF Analysis
Dividends
Seeking Alpha provides a Dividend Scorecard for each ETF. I find it most useful for funds like DGRO because the portfolio’s composition tends to be similar over time. It’s a bit like using technical analysis on an ETF. There’s likely not much value in analyzing previous price movements when today’s constituents are entirely different. However, DGRO’s annual portfolio is consistently in the 20-30% range, so I think these Grades have value.
Seeking Alpha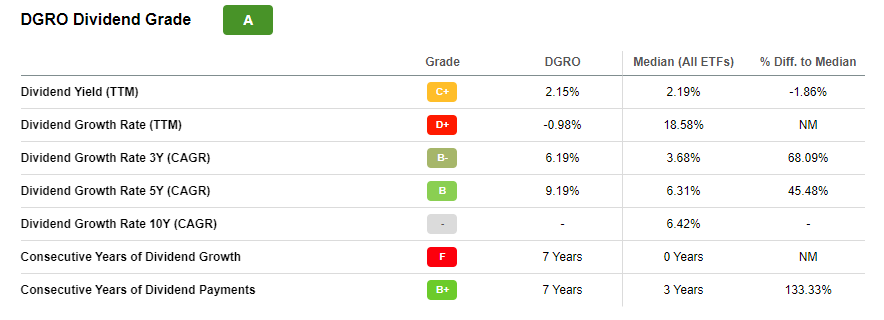
DGRO receives an overall A grade but scores relatively poorly on dividend yield and mediocre on dividend growth. Keep in mind that these grades are not specific to dividend ETFs. However, of the 44 dividend ETFs that have traded for at least five years, DGRO’s five-year dividend growth rate of 9.19% was only the 20th best. Investors should look at dividend potential rather than historical growth, starting with a fundamental analysis of its current constituents. Therefore, let’s first look at the top 25 holdings to understand what to expect.
DGRO Analysis: Top 25 Holdings
I’ve compiled a set of statistics for DGRO’s top 25 holdings below. When assessing the likelihood of future dividend growth, I look to see if a company’s historical growth is sustainable through consistent sales and earnings growth and how much its constituents push the payout ratio. These metrics and several others on diversification, volatility, valuation, and profitability are listed below. Given their strong rankings described earlier, I’ve done the same for SCHD and CDC.
The Sunday Investor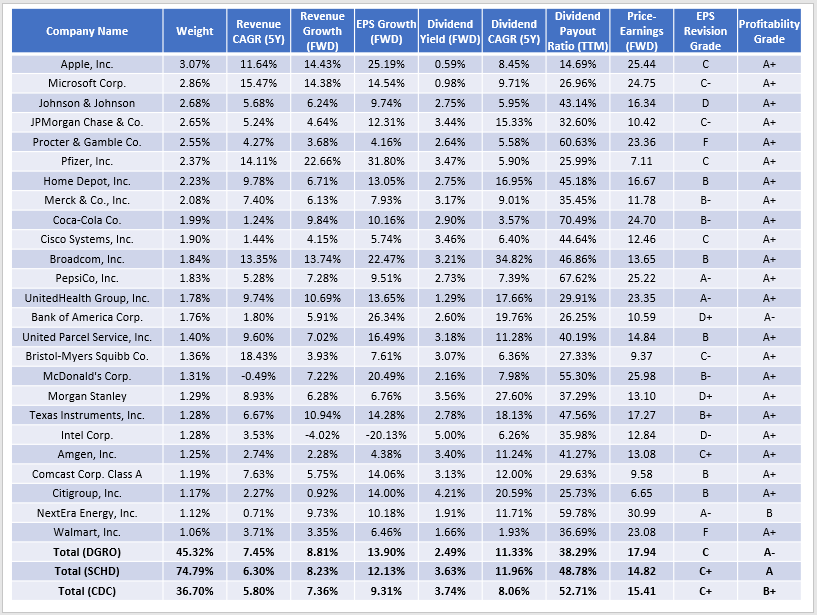
From a sales and earnings per share growth perspective, DGRO looks to be the strongest, with 8.81% and 13.90% estimated growth rates over the next twelve months. Combined with its weighted-average 38.29% dividend payout ratio, I don’t think DGRO is at much risk of its growth stalling. Double-digit growth, consistent with its five-year track record, seems achievable. Seeking Alpha’s net A- Profitability Grade indicates some potential weakness, but that’s coming primarily from Regional Bank and Electric Utilities stocks that I think are in good shape over the short term. Regional banks could fall significantly if the Federal Reserve miscalculates and causes a recession, but I don’t think it’s worth worrying too much about that now.
I was surprised to see DGRO has a 2.49% weighted-average yield, suggesting next quarter’s dividends should be larger than usual. Based on September 18 prices, that means a quarterly dividend payment of about $0.30. It’s not much, but hopefully will be some comfort to shareholders who have seen their distributions decline in the last two quarters. If prior years are any indication, DGRO should go ex-dividend sometime next week, so it may be worth holding onto until then in case you were considering selling.
Valuation is one metric where DGRO falls short relative to SCHD and CDC. DGRO trades at 17.94x forward earnings, which is 5.38 points less than SPY. However, low P/E dividend ETFs have the most momentum. To illustrate, consider how the average high-dividend ETF trades at an 8.22x forward earnings discount to SPY and has outperformed by 6.55% in the last six months. Large-cap dividend ETFs, including DGRO, trade at a 5.98 point discount and only outperformed by 3.76%.
Finally, both SCHD and CDC have stronger EPS Revision Grades (C+ vs. C), suggesting more positive sentiment on Wall Street. Furthermore, DGRO’s weighted-average sales surprise last quarter was just 2.00%. SCHD, CDC, and SPY had sales surprises of 3.10%, 7.59%, and 2.30%, respectively. CDC stands out because it holds 19 Utilities stocks (27.39% total weight) with an average 17.56% average sales surprise last quarter. A hypothetical equal-weight portfolio of these stocks, rebalanced monthly, is up 7.82% YTD compared to 12.08% and 10.46% declines for DGRO and SCHD.
Portfolio Visualizer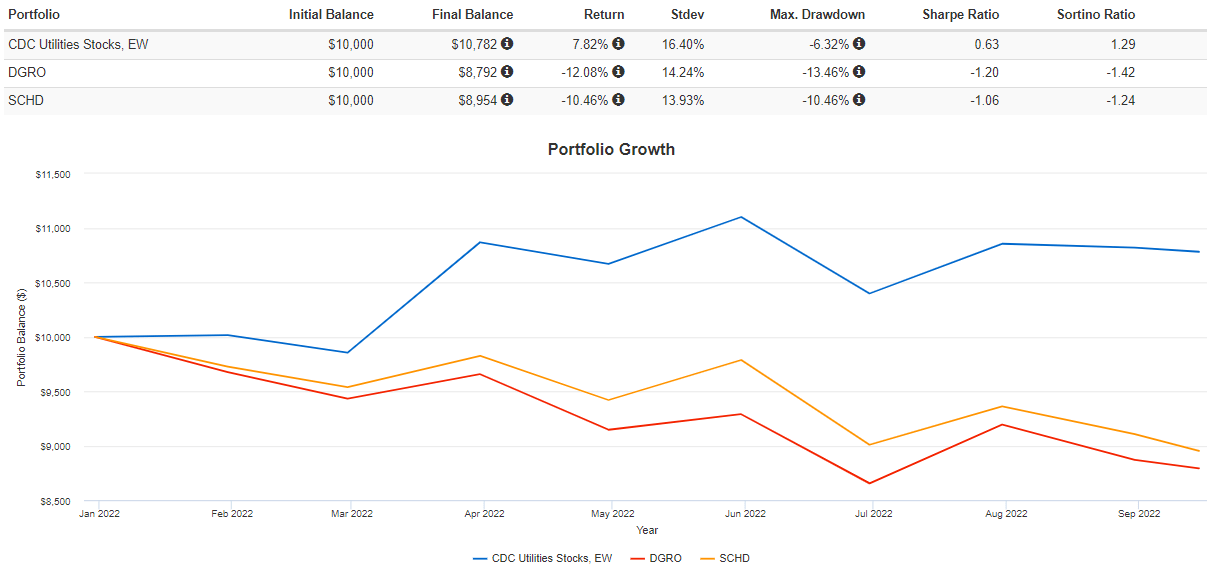
I covered the Utilities Select Sector SPDR ETF XLU earlier this year, and I hope you can take the time to read my thesis explaining the complex relationship between Utilities stock returns and interest rates.
Filling In The Gaps
Finally, I want to clarify that it’s not my goal to leave DGRO shareholders dejected but instead point them in the right direction regarding the industries they can target to complement DGRO’s shortcomings. DGRO is a nice start but lacks meaningful exposure to several industries that offer excellent protection in market downturns and can improve your portfolio’s dividend yield and growth features.
To illustrate, I’ve compared DGRO’s composition against SCHD and CDC and identified the most underweight industries. These industries and median statistics for U.S. equities with market values above $5 billion are below.
The Sunday Investor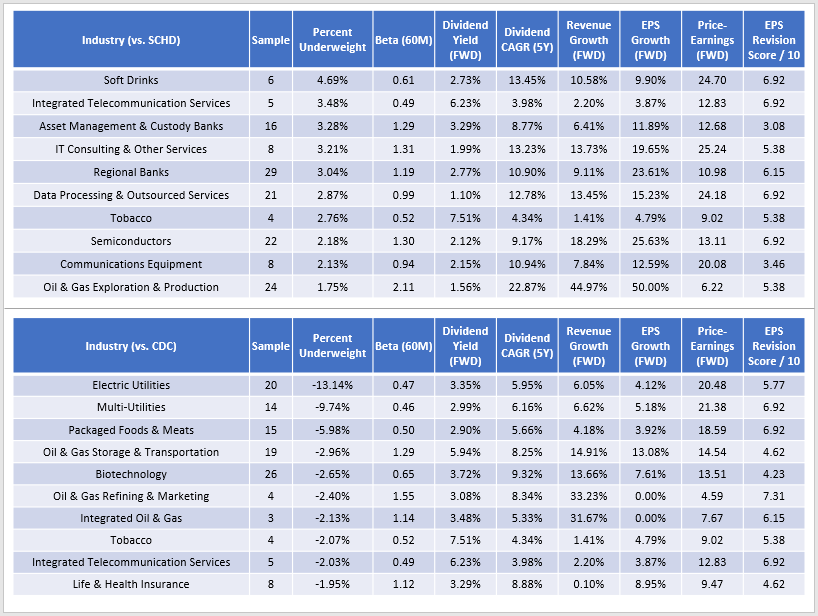
SCHD holds Soft Drink companies PepsiCo (PEP) and Coca-Cola (KO), and investors can improve their portfolio’s dividend yield and growth by owning those two companies. Semiconductors are trading at just 13.11x forward earnings and could help you capture additional growth. Finally, Oil & Gas E&P stocks are probably one of the best hedges against persistently high inflation.
CDC looks to be a much better complementary holding to DGRO, as it underweights Electric Utilities and Multi-Utilities by a combined 22.88%. These additions will improve your portfolio’s yield but won’t do much from a dividend growth perspective. It may be easier to add XLU, as I previously suggested. Remarkably, there aren’t many dividend growth opportunities in CDC, so if that’s your focus, I wouldn’t bother paying the higher 0.35% expense ratio.
Investment Recommendation
DGRO is a solid dividend ETF that should continue delivering double-digit annual dividend growth for the foreseeable future. Nearly all constituents are highly profitable, have enough anticipated sales and earnings growth to support future dividend increases, and aren’t limited by high dividend payout ratios. Combined with a low 0.08% expense ratio, it makes sense why this ETF has amassed nearly $10 billion in assets under management.
Current shareholders understand DGRO sacrifices yield for growth but, given the downward trend in quarterly distributions, are no doubt disappointed. To those shareholders, I believe you’ll see a higher quarterly payment next week, as its constituents are priced to deliver payment of approximately $0.30 per share. Several factors can influence an ETF’s distributions, but my analysis shows that the forward yield looks close to 2.40%.
In conclusion, I don’t think DGRO is your best option today, as SCHD and CDC look to have better fundamentals. However, that doesn’t mean you should sell DGRO if you already own it. Deploying capital to underweighted sectors using low-cost ETFs is the easiest route. Or, if you’re looking to improve your portfolio’s dividend yield and growth features efficiently, I hope you can use the information in this article’s final table to find a suitable addition. Thank you for reading, and I look forward to reading your comments below.
Be the first to comment