

onurdongel
Introduction
The Oklahoma City-based Devon Energy Corp. (NYSE:DVN) reported second-quarter earnings on August 1, 2022.
Important note: This article is an update of my preceding article published on February 23, 2022. I have followed EOG on Seeking Alpha since 2017, with 6 articles published and counting.
DVN Map US assets Presentation (DVN Presentation)
Also, the fundamentals referenced here about EOG Resources (EOG) came from my recent article published on September 7, 2022. I recommend reading this article by clicking here.
1 – 2Q’22 results Snapshot
Devon Energy announced better-than-expected adjusted earnings of $2.59, over 3.3 times higher than in the year-ago quarter. GAAP earnings for the second quarter were $2.93 compared to $0.38 per share in the year-ago period.
The total revenues were a record of $5.526 million, significantly higher than the same quarter a year ago ($2,417 million). The recent merger with WPX Energy has especially lifted results since January.
The second-quarter production of 616.2K Boep/d is up from 608K Boep/d in 2Q21. Oil production averaged 300K Boep/d. The increase was due to solid contributions from Delaware and Williston Basin assets.
CEO Richard Muncrief said in the conference call:
By all measures, the second quarter was another excellent performance for Devon as our business continued to strengthen and build momentum. Our quarterly results were highlighted by our Delaware-focused operating plan that delivered production above our guidance expectations. Capital was below budget, margins expanded and we paid record high cash payouts to shareholders. We also took important steps to strengthen the quality and depth of our asset portfolio.
DVN 2Q22 Highlights Presentation (DVN Presentation)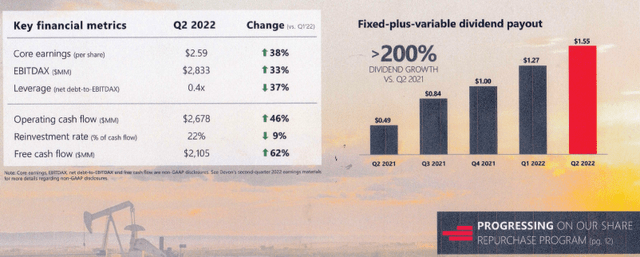
2 – Investment Thesis
The investment thesis has not changed since my preceding article, and I recommend DVN as a long-term opportunity to accumulate on weakness.
On a side note, the dividend policy is generous for long-term investors and reached a record level in 2Q22 with a total quarterly dividend of $1.55 per share. However, I believe the dividend will go down next quarter with less favorable commodity prices and inflationary pressures that will hurt free cash flow.
I believe it could be time for EOG Resources and Devon Energy to potentially merge and create a strong E&P domestic producer. My thinking is based on the tight relationship between EOG and DVN assets that could enhance free cash flow by creating impressive cash synergies.
EOG Resources produces from five Premium Basins and is essentially a pure-play US producer. However, EOG Resources also produces from its assets in Trinidad, with 34.6K Boep/d in 2Q22.
EOG Maps assets (EOG Presentation)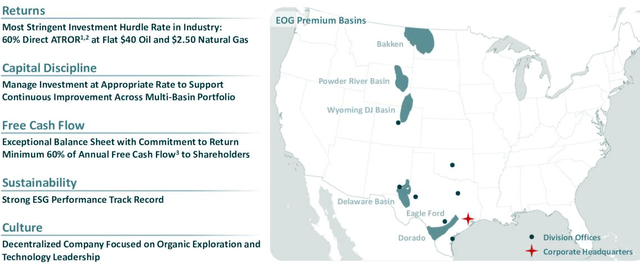
If we look at the location of the assets, we can see that it is a perfect match with higher production from the US, reaching 886.1K Boep/d in 2Q22 compared to 616.2K Boep/d for Devon.
EOG Production detail oil NGL NG 2Q22 (Fun Trading)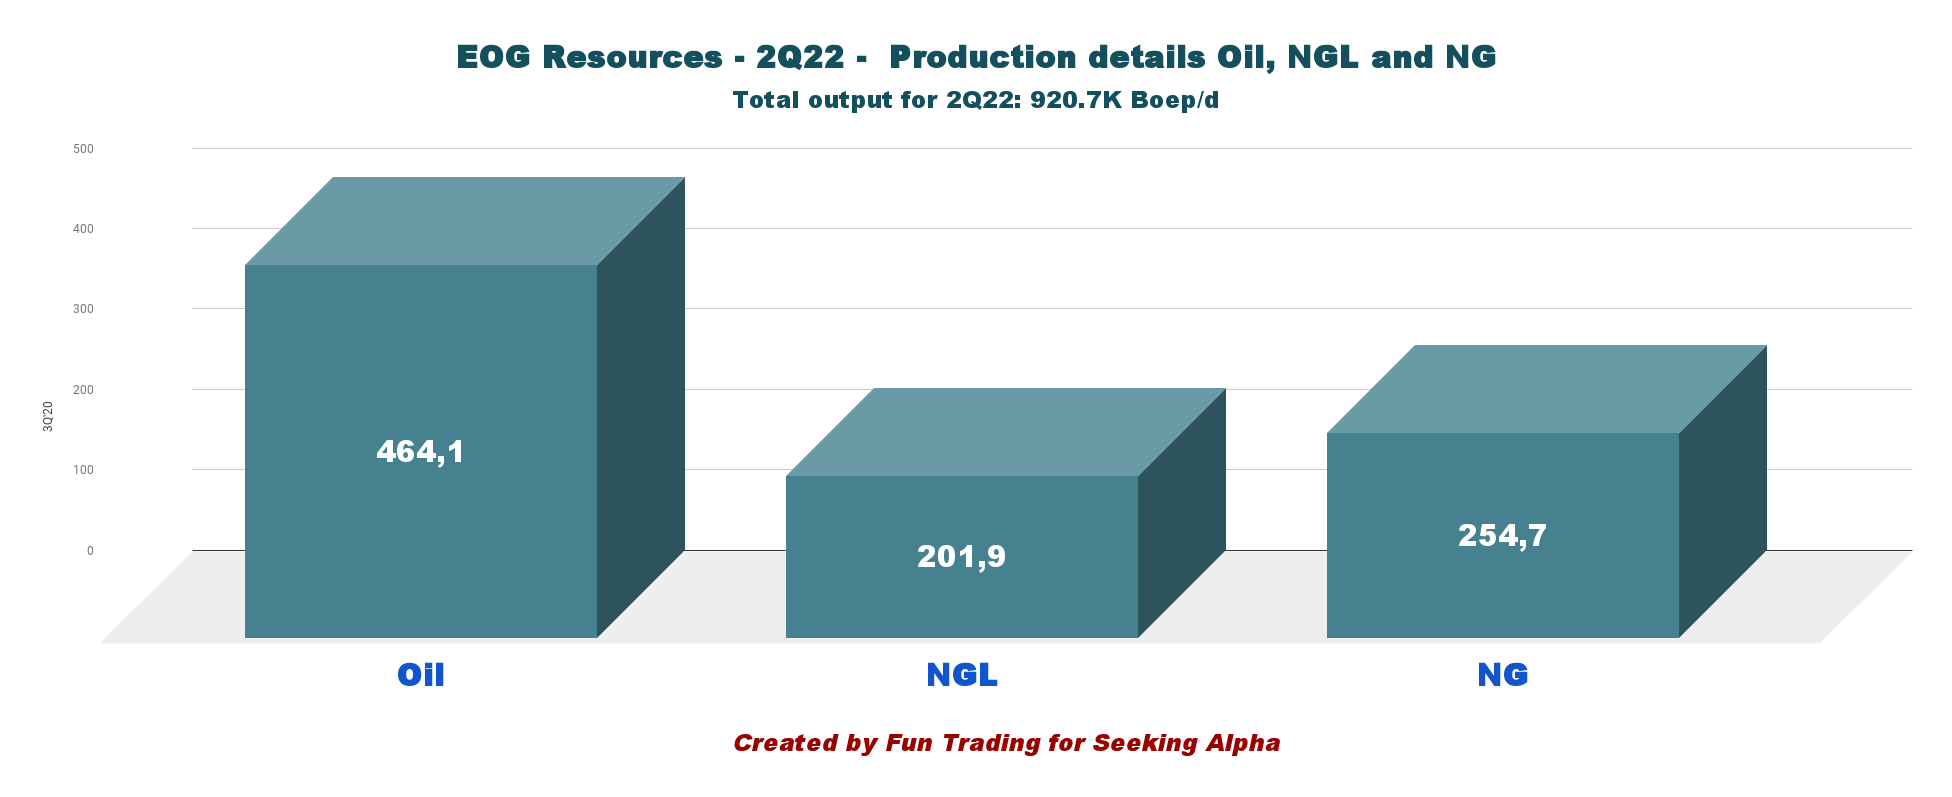
Liquids for EOG represent 72.3% compared to 74% for DVN. Both companies have an excellent balance sheet of over $3 billion in cash.
Note: EOG Resources announced a special dividend of $1.50 per share in 2Q22, adding to the regular $0.75 per share. The total dividend for 2Q22 is $2.25 per share.
I would not mind a merger on an all-stock basis with 60/40 in favor of EOG Resources, which is slightly bigger. However, it is not sure that this potential merger can be positive for the stocks depending on who gets what. Often, a good idea at the business level may not be positive for the shareholders.
Something to think about.
Oil prices are starting to weaken lately due to lower demand from China and the risk of a recession by the end of 2022, which will affect the market and hurt demand.
Hence, I recommend allocating 35% to 45% of your position to short-term trading LIFO using technical analysis. Again, I do not recommend selling off your position and believe it is not a good idea.
The strategy protects you against sudden changes in the oil sector and lets you keep a core long-term position for much higher prices.
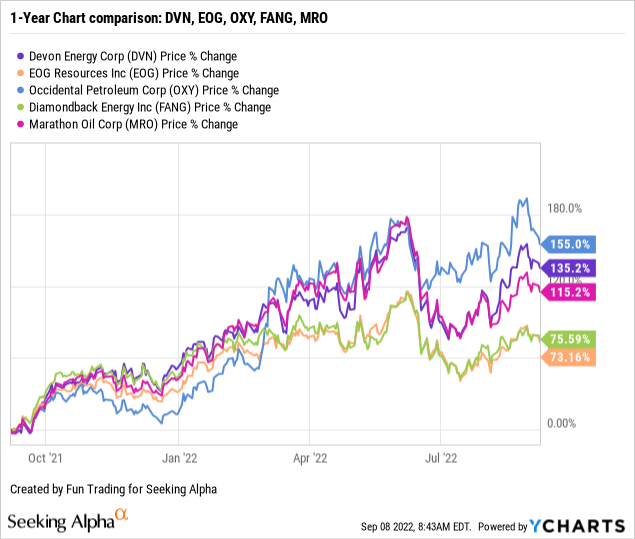
3 – Stock Performance
DVN outperformed its peers, put aside OXY boosted by Buffett, and is up 135% on a one-year basis.
Devon Energy Balance Sheet 2Q’22: The Raw Numbers
Note: Total revenues include oil/gas and NGL sales, oil/gas and NGL derivatives, and marketing and midstream revenues.
| DVN (including WPX Energy) | 2Q21 | 3Q21 | 4Q21 | 1Q22 | 2Q22 |
| Oil and Gas Revenue in $ Million | 2,154 | 2,635 | 2,985 | 3,175 | 4,100 |
| Total Revenues incl. derivatives, midstream + others in $ Million | 2,417 | 3,466 | 4,273 | 3,812 | 5,626 |
| Net income in $ Million | 256 | 838 | 1,506 | 989 | 1,932 |
| EBITDA in $ Million | 938 | 1,635 | 2,331 | 1,843 | 3,116 |
| EPS diluted in $/share | 0.38 | 1.24 | 2.23 | 1.48 | 2,93 |
| Cash from operations in $ Million | 1,093 | 1,598 | 1,616 | 1,837 | 2,678 |
| Capital Expenditure in $ Million | 509 | 484 | 515 | 538 | 673 |
| Free Cash Flow in $ Million | 584 | 1,114 | 1,101 | 1,299 | 2,005 |
| Cash and cash equivalent $ Million | 1,539 | 2,321 | 2,111 | 2,475 | 3,317 |
| Total debt in $ Million | 6,502 | 6,492 | 6,482 | 6,471 | 6,461 |
| Dividend per share in $ | 0.49 | 0.84 | 1.00 | 1.27 | 1.55 |
| Share outstanding in millions | 679 | 673 | 662 | 658 | 654 |
| Liquids and NG Production | 2Q21 | 3Q21 | 4Q21 | 1Q22 | 2Q22 |
| Oil Equivalent Production in KBoepd | 567 | 608 | 611 | 575 | 616 |
| Price per Boe (composite) incl. cash settlement | 34.64 | 40.48 | 44.34 | 54.75 | 64.70 |
| Price per Mcf | 2.20 | 2.77 | 3.26 | 3.15 | 5.06 |
Source: Devon Energy supplement filing and Fun Trading Analysis.
Trends, Charts, and Commentary: Revenues, Free Cash Flow, and Upstream Production
1 – Quarterly revenues: Revenues of $5,626 million in 2Q’22
DVN Quarterly Revenues history (Fun Trading)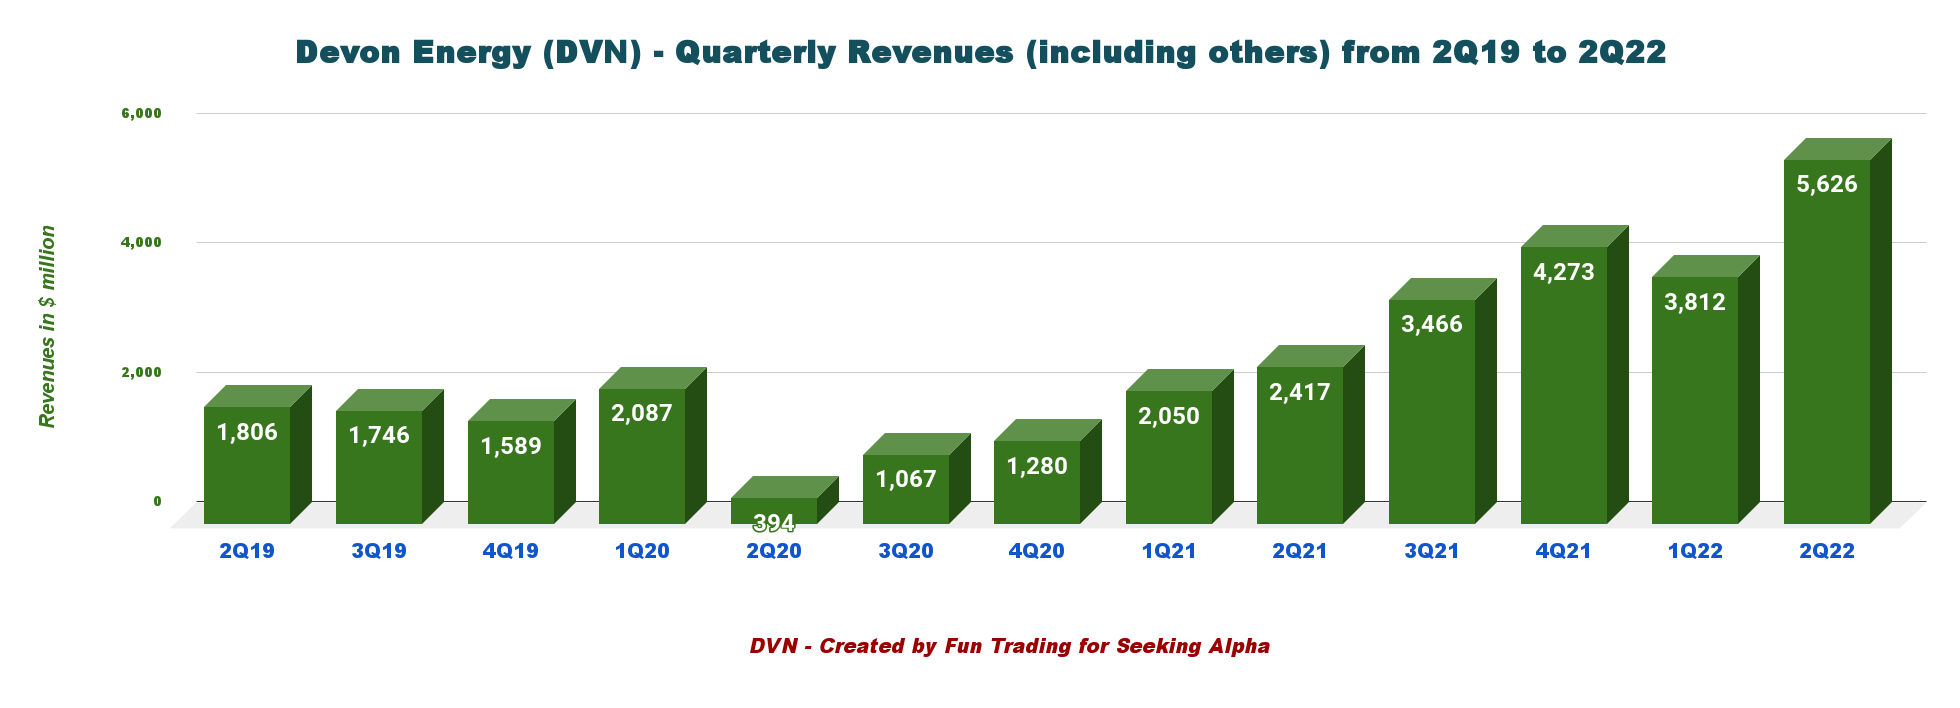
Devon Energy posted total revenue of $5,626 million in the second quarter of 2022, higher significantly than the $2,417 million posted in 2Q21 (before the acquisition of WPX Energy). For more data, please look at the table above.
The net income for 2Q22 was $1,932 million, up from $256 million last year.
Operating cash flow of $2,678 million more than doubled year over year, and free cash flow reached the highest level in Devon’s history.
The total production expenses for the second quarter were $729 million, from $513 million in 2Q21.
2 – Free cash flow was a record $2,005 million in 2Q22. A Very generous dividend supported by free cash flow.
DVN Quarterly Free cash flow history (Fun Trading)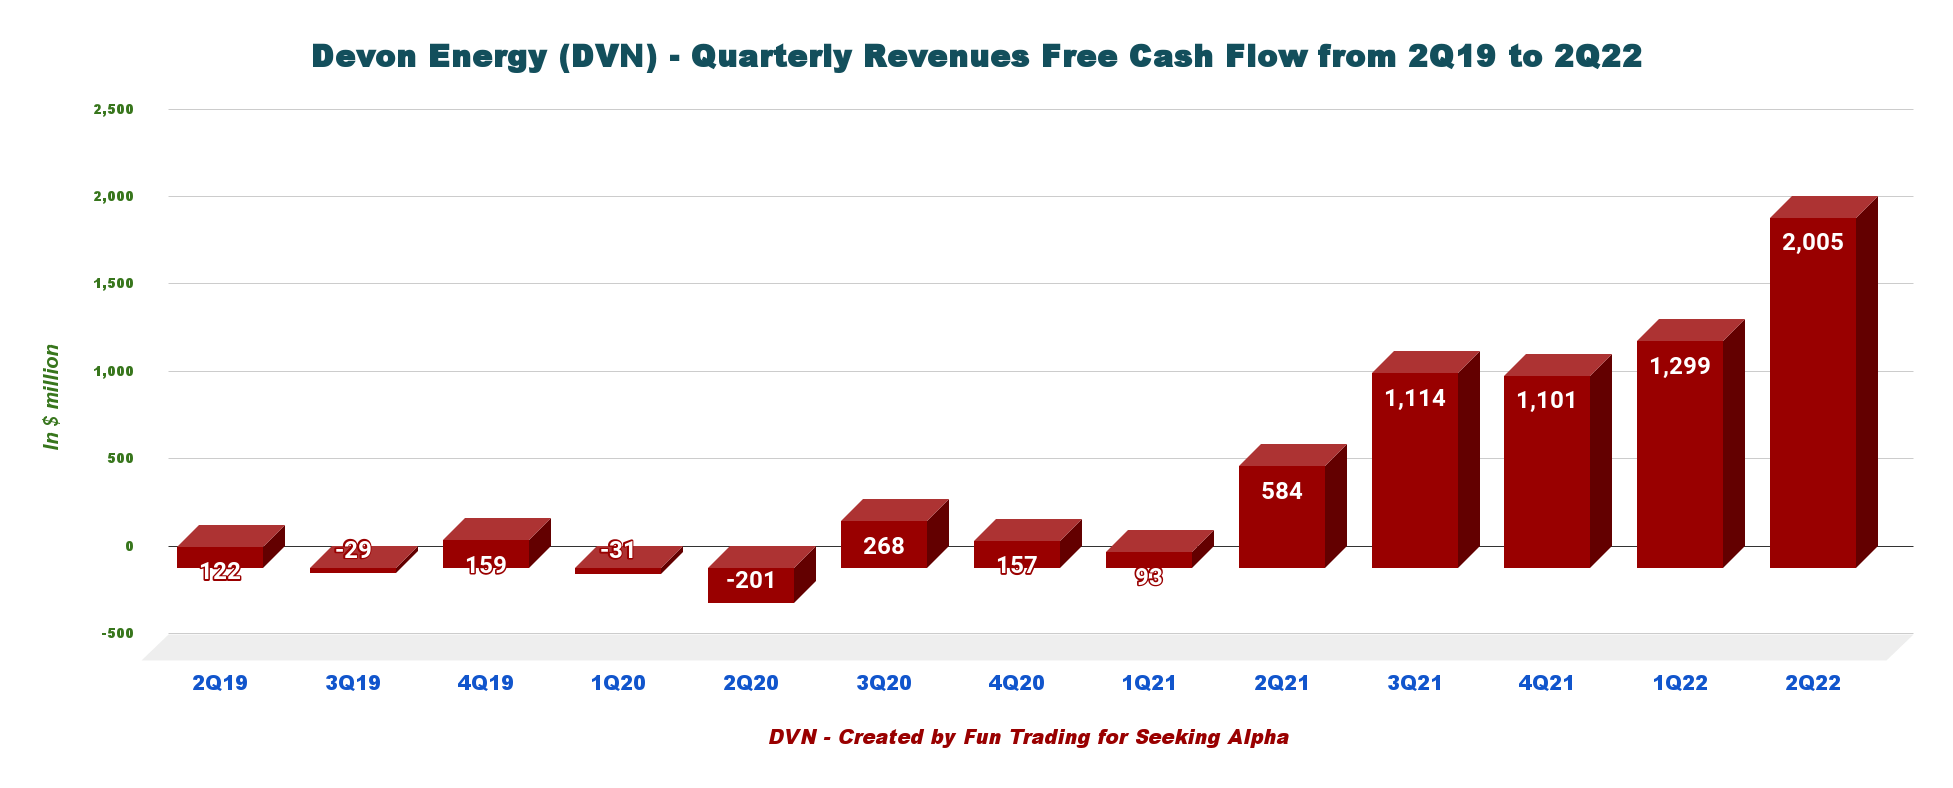
Note: The generic free cash flow is the cash from operations minus CapEx.
Trailing 12-month free cash flow was $5,519 million and $2,005 million for 2Q22.
The Board of Directors authorized a $2 billion share buyback, representing over 5% of Devon’s market capitalization.
The company is paying a variable dividend now based on free cash flow. The dividend consists of two parts:
- A fixed quarterly dividend of $0.18 per share.
- A variable payment ($1.37) based on excess free cash flow multiplied by a payout ratio determined by the board as high as 50%.
The dividend payment for the second quarter of 2022 is $1.55 per share. The yield is now 9.1%, which is significantly high for such an E&P operator.
DVN Free cash flow priorities Presentation (DVN Presentation)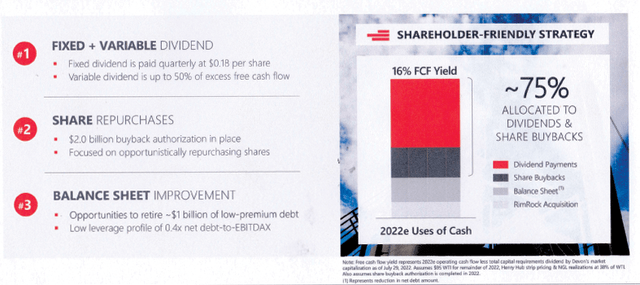
3 – Quarterly Production: Production was 616.2K Boepd in 2Q’22.
DVN Quarterly oil equivalent production history (Fun Trading)
Devon Energy produced a record of 616.2K Boepd in the second quarter, or 8.7% higher than the 2Q21.
US Production repartition for the five prominent locations are as follows:
DVN Quarterly oil equivalent production per basin in 2Q22 (Fun Trading)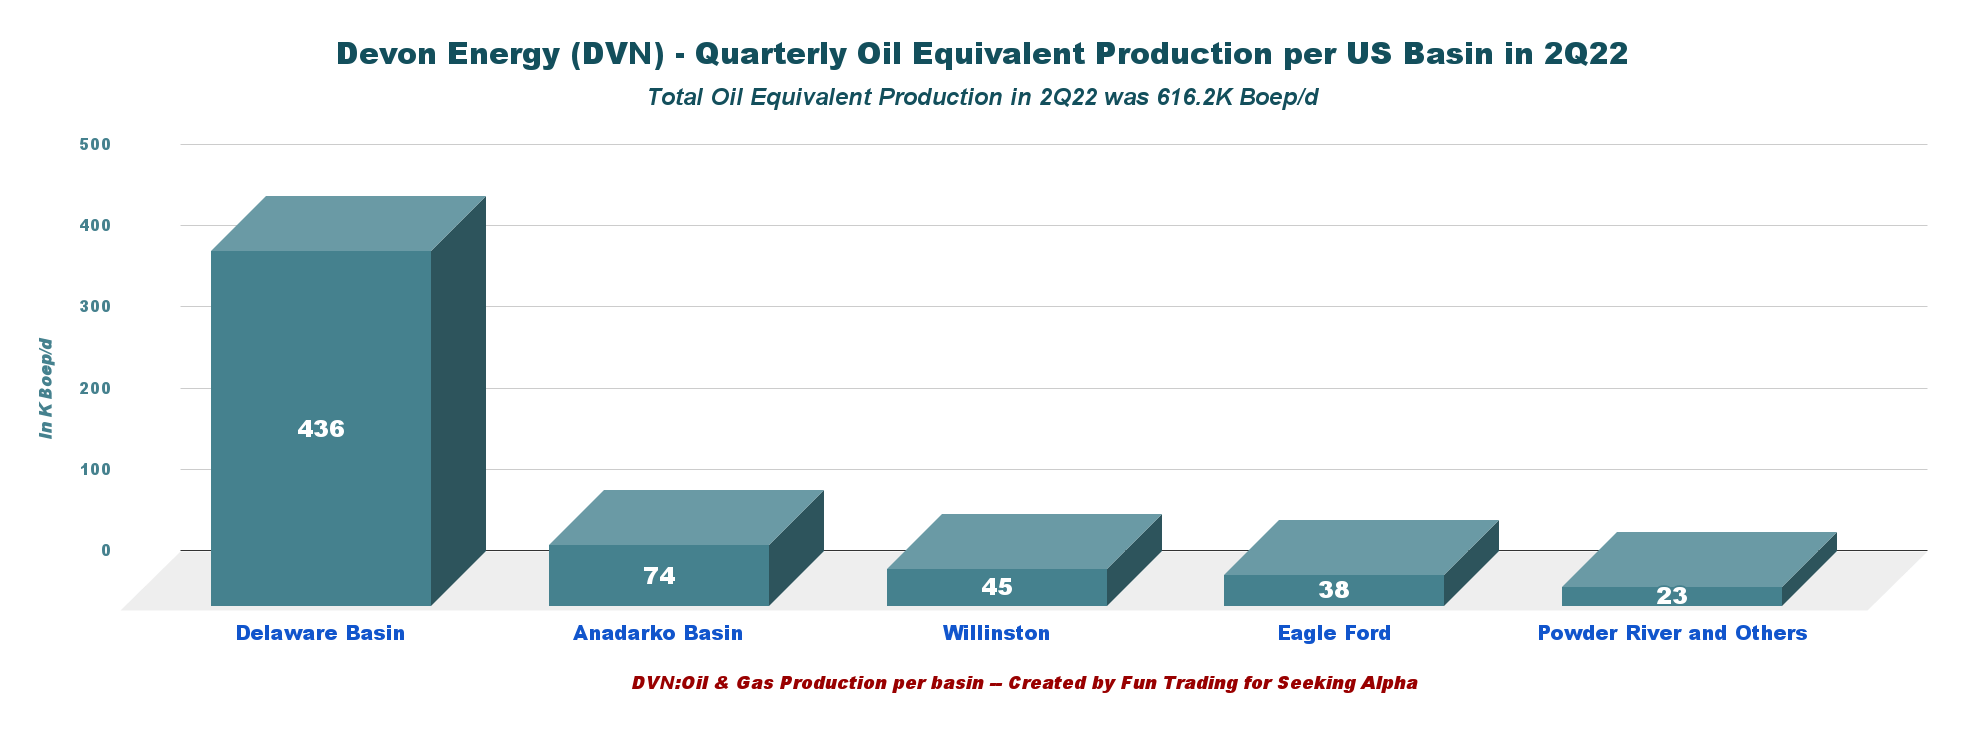
The Delaware Basin is the number one producing asset for Devon Energy, representing 70.8% of the total production. Liquids represented 74% of the total output.
DVN Production repartition Oil, NGL, NG in 2Q22 (Fun Trading)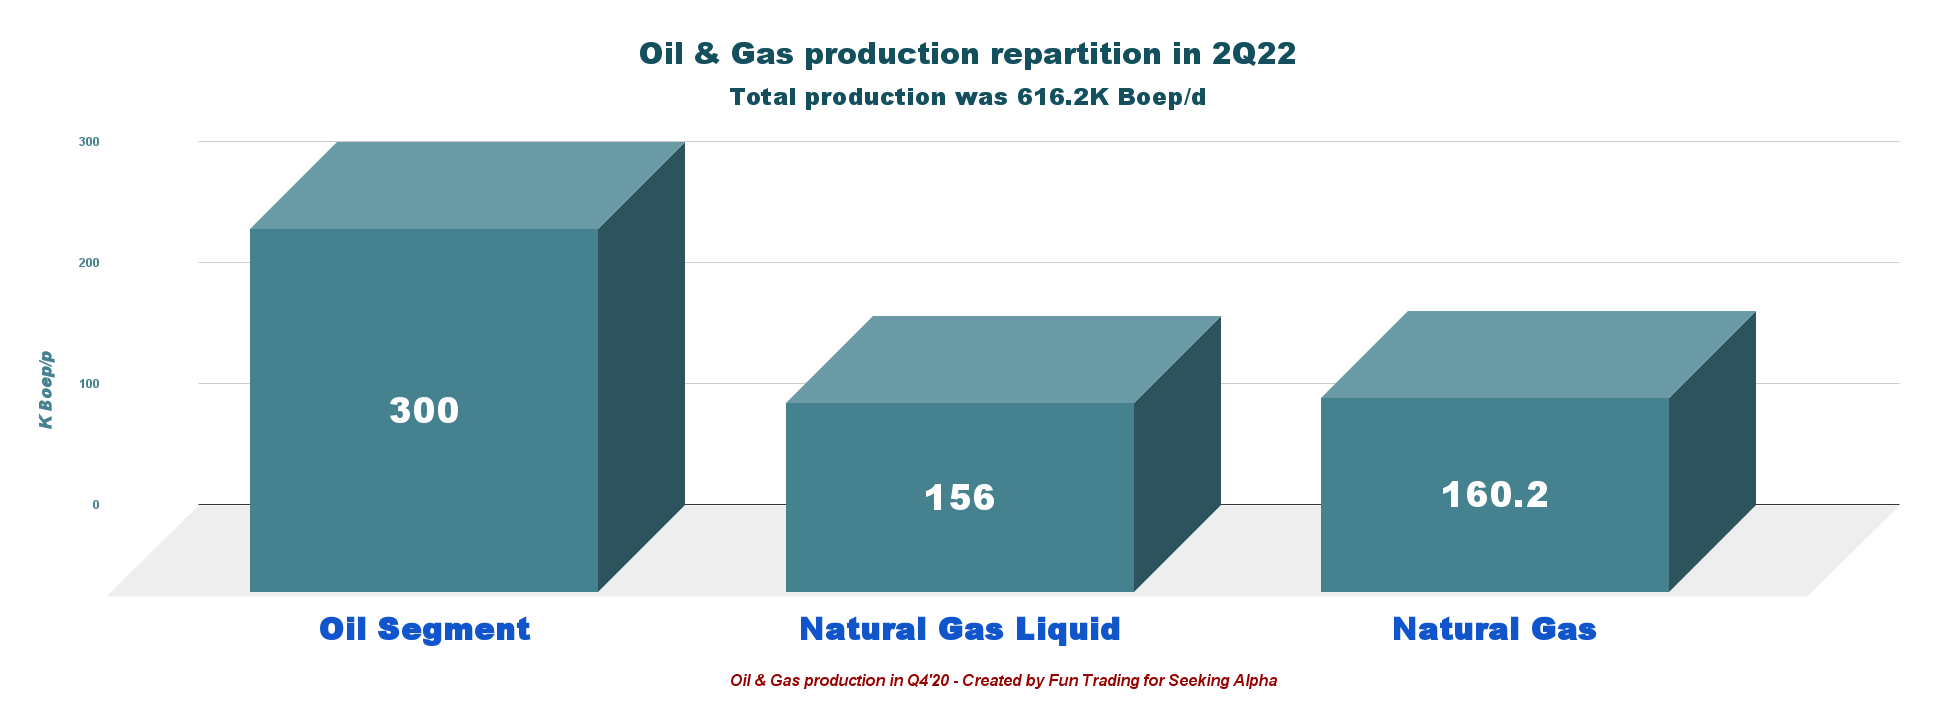
Total oil equivalent realized prices, including cash settlements, were $64.70 per Boe, up 86.8% year-over-year. Below are the historical prices realized for Boe and NG.
DVN Quarterly Oil and Gas prices history (Fun Trading)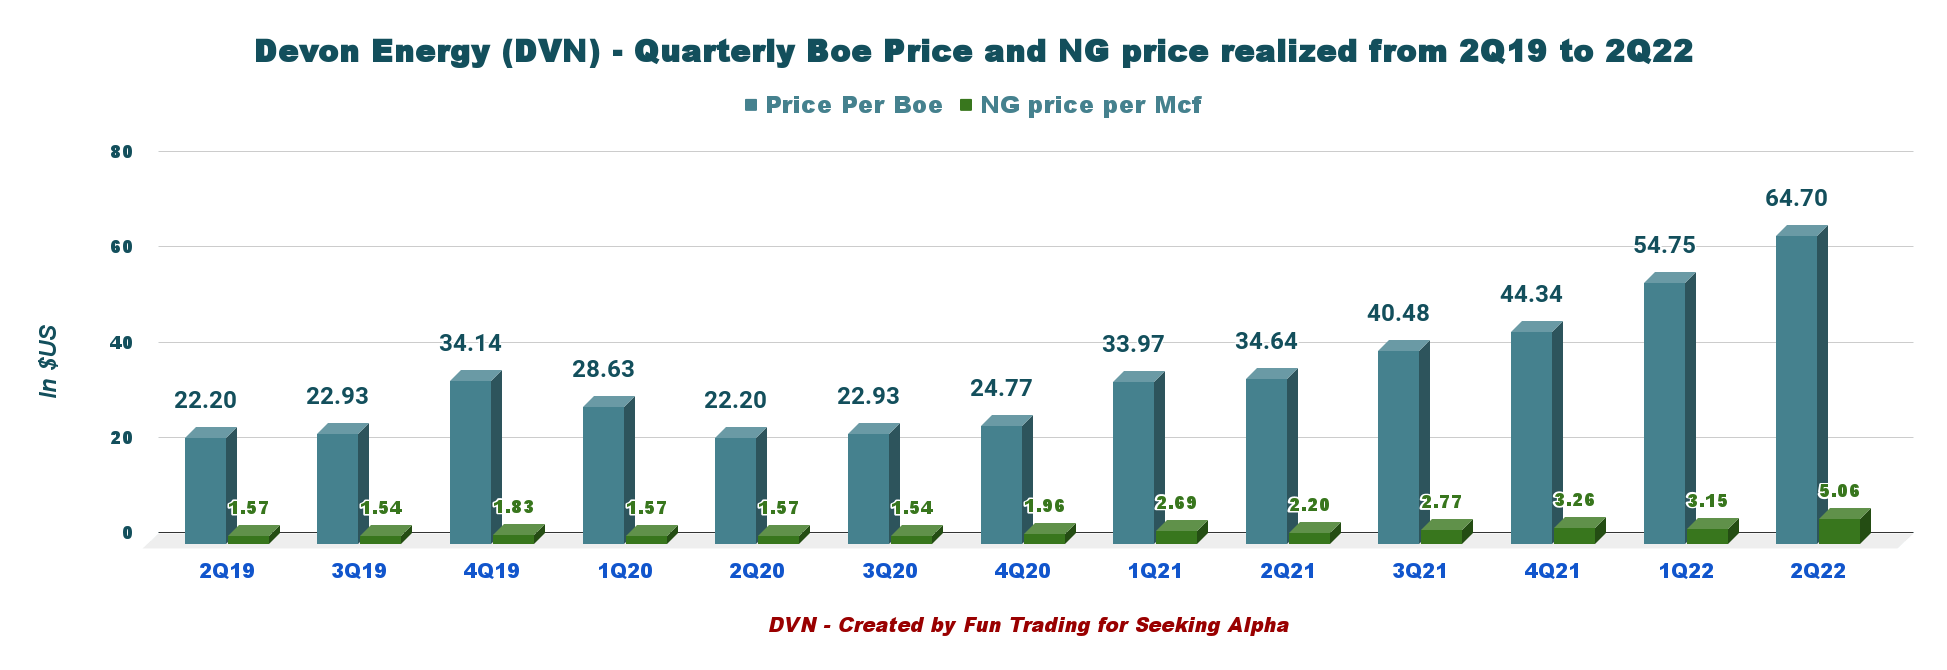
- Realized oil prices for the second quarter were $95.80 per barrel from $50.34 in the year-ago period.
- Realized prices for natural gas liquids were up to $40.28 per barrel from $23.64 in the prior-year quarter.
- Realized gas prices were up to $5.06 per thousand cubic feet from $2.20 in the prior-year quarter.
4 – 2022 Guidance
Devon Energy forecasts total production of 593K-613K Boep/d for the third quarter.
Third-quarter capital expenditure is projected to be $680-$755 million.
Devon Energy reiterated its 2022 total production guidance at 600K-610K Boep/d and upstream capital investment at $2.2-$2.4 billion.
Total capital expenditure for 2022 is expected to be $2.4-$2.64 billion.
5 – Debt situation, liquidity: No worry on this side.
DVN Quarterly Cash versus Debt history (Fun Trading)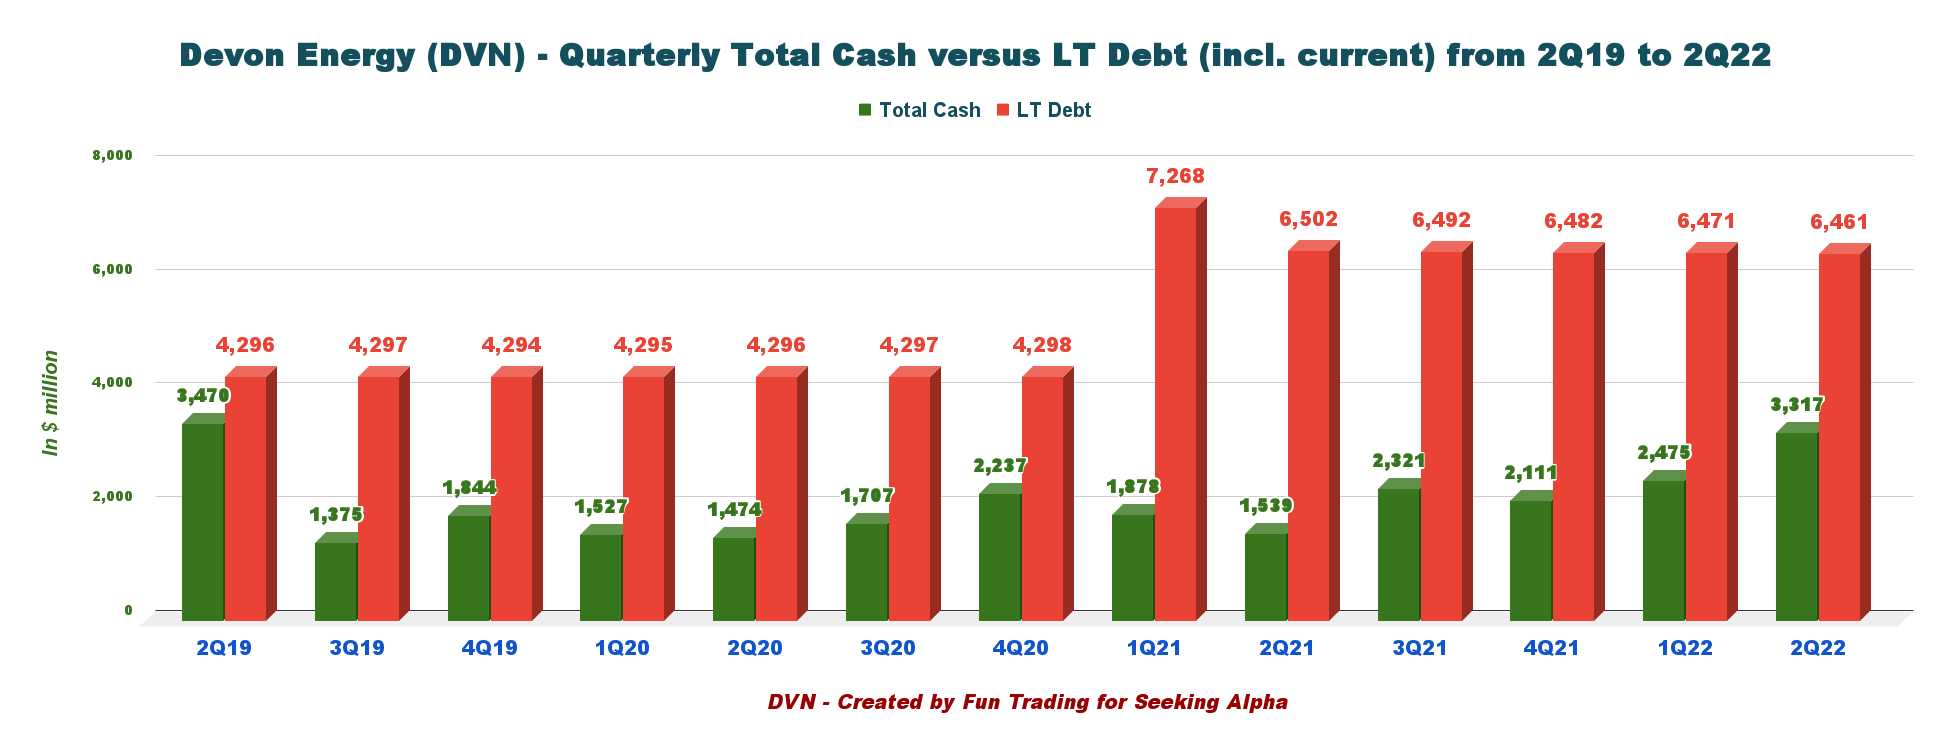
As of June 30, 2021, the company had cash and cash equivalents, including restricted cash of $3,317 million, up from $1,539 million on June 30, 2021.
Devon Energy exited the second quarter with $6.5 billion of liquidity and no debt maturities till 2023. About 60% of the outstanding debt obligations mature after 2030.
Long-term debt amounted to $6,461 million, up from $6,482 million on December 31, 2021.
Devon Energy’s net cash from operating activities for the second quarter of 2022 was $2,678 million compared with $1,093 million in the year-ago period.
The net debt is now $3.14 billion, with a net debt-to-EBITDAX of 0.4x.
DVN Debt liquidity (DVN Presentation)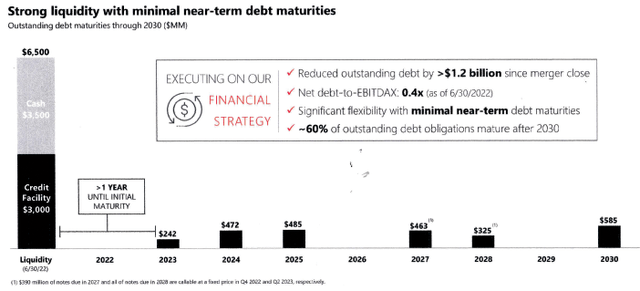
Technical Analysis and Commentary
DVN TA chart short-term (Fun Trading StockCharts)
Note: The chart is adjusted from the dividend.
DVN forms an ascending channel pattern with resistance at $78.2 and support at $67.
The short-term trading strategy is to trade LIFO about 35%-45% of your position and keep a core long-term position for a much higher payday. I suggest selling above $76 to $78.2 with higher resistance at $80 and waiting for a retracement below $67 with potential lower support between the 50MA and the 200MM or $61.2 to 56.7.
I do not recommend selling off your position but taking enough cash out to let you take full advantage of a possible retracement, which is more likely if we are heading to a recession by the end of 2022.
It is perhaps time to use upticks to take some profits off and wait patiently for a return to a more viable price of oil and gas.
Warning: The TA chart must be updated frequently to be relevant. It is what I am doing in my stock tracker. The chart above has a possible validity of about a week. Remember, the TA chart is a tool only to help you adopt the right strategy. It is not a way to “know” the future. No one and nothing can.
Author’s note: If you find value in this article and would like to encourage such continued efforts, please click the “Like” button below as a vote of support. Thanks.
Be the first to comment