

Jerritt Clark/Getty Images Entertainment
I don’t fancy myself a fan of retail companies, particularly those that focus on clothing. This is due to low margins and high levels of competition. Even so, in recent months, one firm that has done well compared to the broader market is Destination XL Group (NASDAQ:DXLG). Management succeeded in ending the 2021 fiscal year with a bang and, now that we are into the 2022 fiscal year, the company expects sales to continue rising. Having said that, despite experiencing some improvement on its bottom line, the company is now forecasting that its profitability for the current fiscal year might be lower than it was last year. Add on to this the structural concerns the company has, and I have decided to finally downgrade the company from a ‘buy’ to a ‘hold’.
A niche clothing firm
In March of this year, I wrote an article about Destination XL Group. In that article, I acknowledged the company’s mixed operating history. Driven in large part by a continued decline in store count, I said that the long-term trend for the company was not positive. However, I found myself happy with the low trading price of the business and the fact that it had cash in excess of debt. This indicated to me that the near-term risk for shareholders was limited, even though the long-term outlook for the company was anything but favorable. At that time, I had rated the business a ‘buy’, but I did warn that investors should not be in the company for too long. Since then, Destination XL Group has performed better than I expected. While the S&P 500 is down by 9.1%, shares of this retailer have decreased in value by 6.4%.
Author – SEC EDGAR Data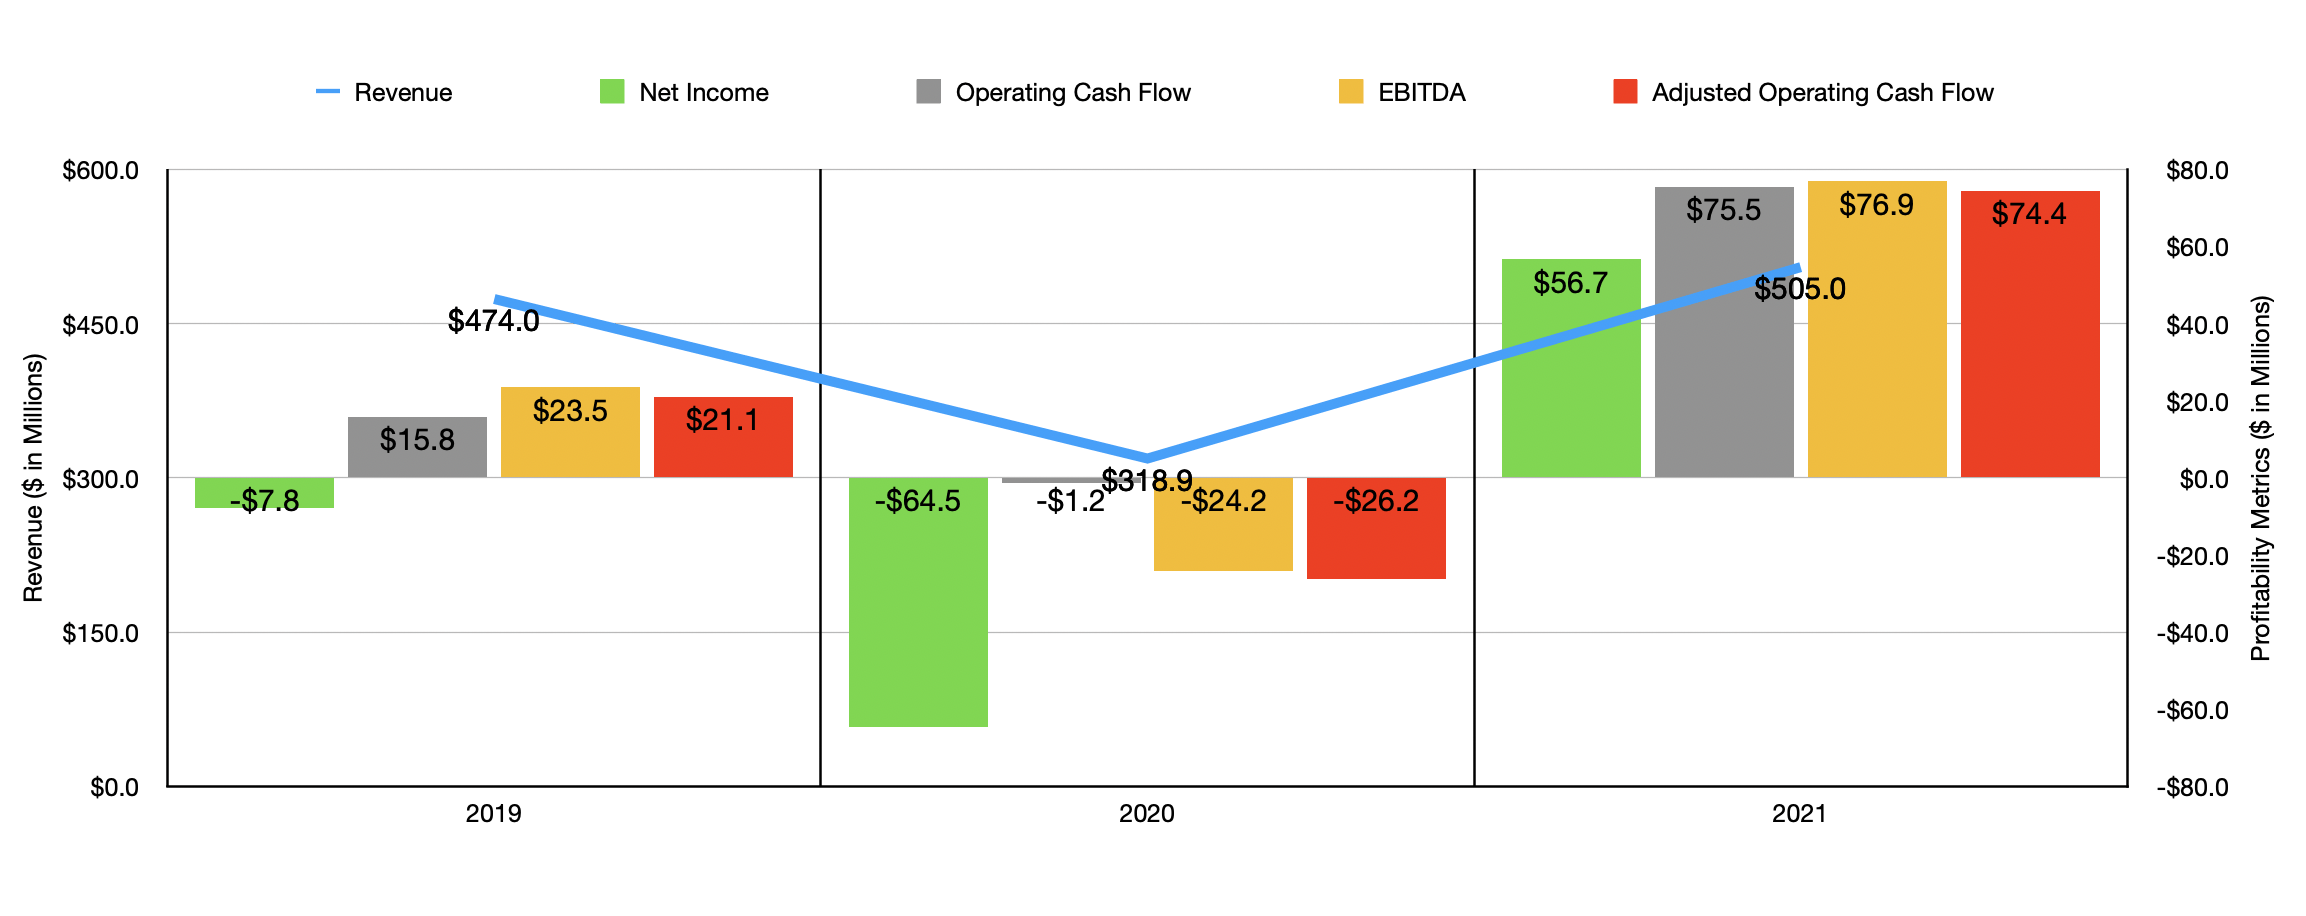
This disparity compared to the broader market was not without cause. The fact of the matter is that the business has been generating some rather strong financial figures as of late. Consider revenue. When I last wrote about the firm, I only had data covering through the third quarter of the company’s 2021 fiscal year. Today, I now have data covering through the first quarter of 2022. To end out the 2021 fiscal year, management reported revenue of $133.5 million. That’s 33.4% higher than the $100.1 million generated the same time one year earlier. Management attributed this significant improvement to a 41.5% rise in comparable sales, almost certainly due to the reopening of the economy following the end of the COVID-19 pandemic. Thanks to this strong final quarter, revenue for 2021 as a whole came in at $505 million. That’s 58.4% above the $318.9 million generated in the 2020 fiscal year. It’s also 6.5% higher than the $474 million reported for the 2019 fiscal year.
Author – SEC EDGAR Data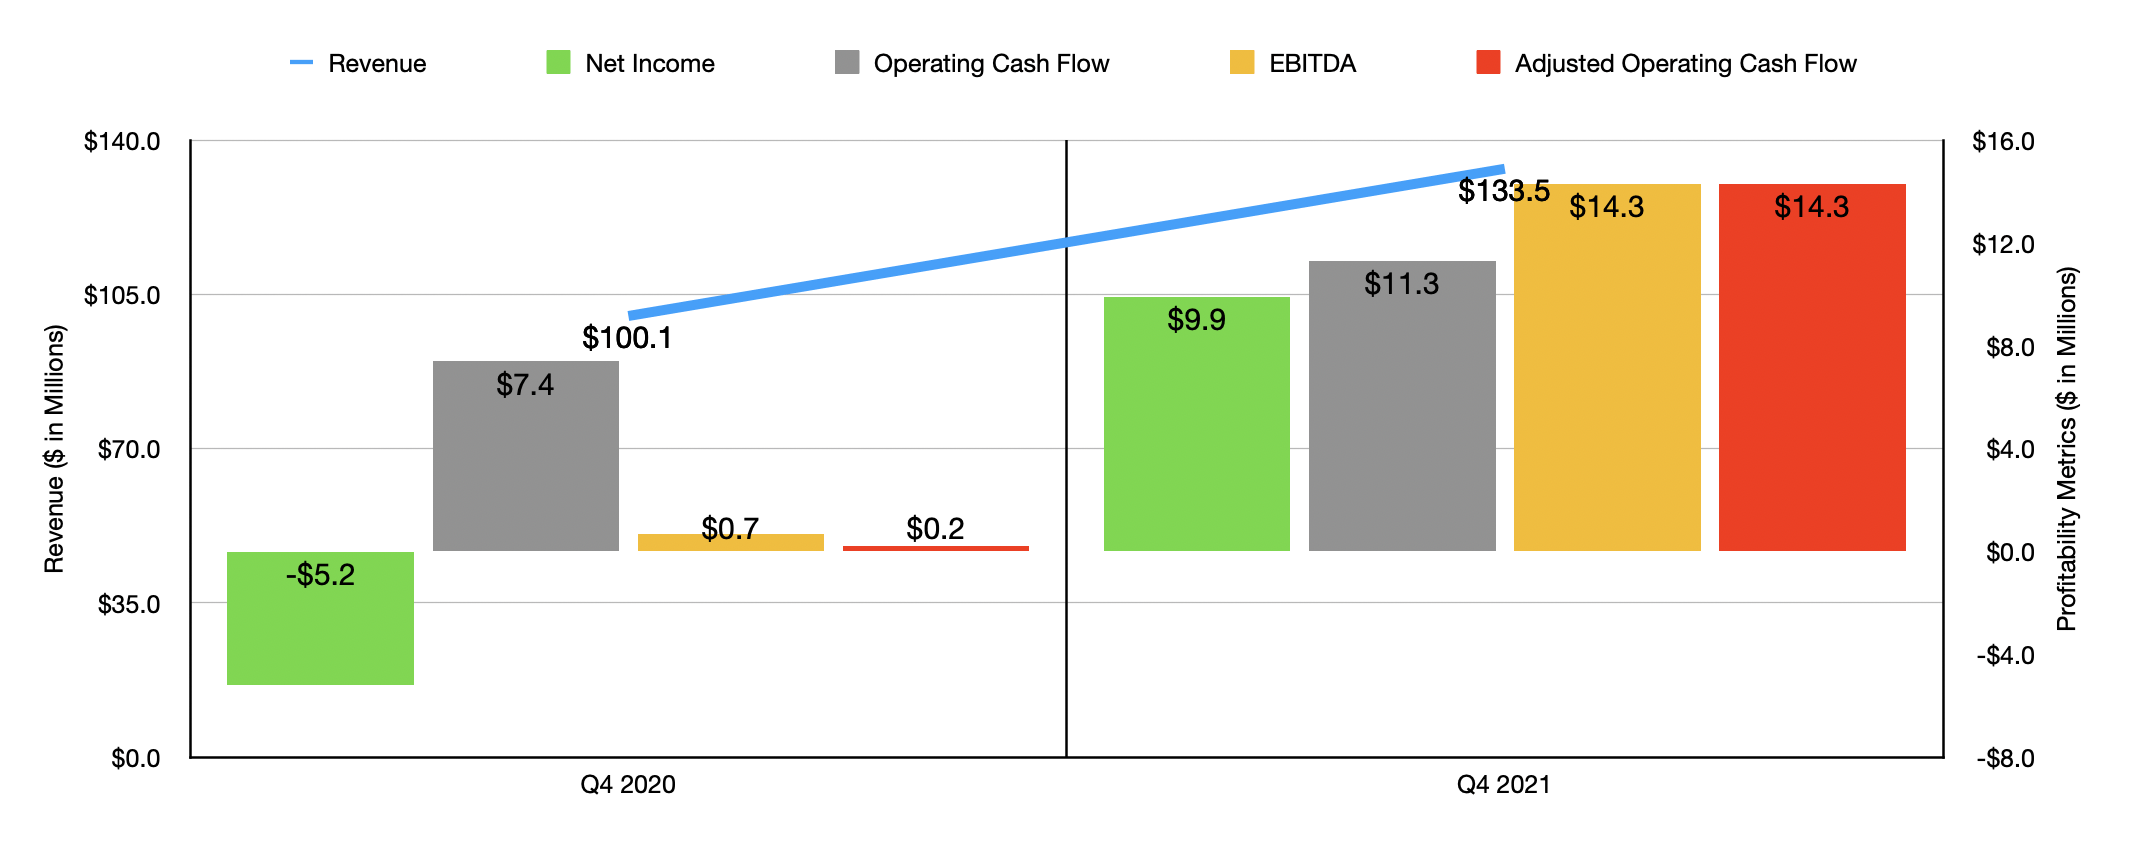
As revenue increased, so too did profitability. Net income in the final quarter was $9.9 million. That compares to the $5.1 million loss generated one year earlier. This brought total net income for the 2021 fiscal year to $56.7 million. That’s actually the highest in earnings the company has generated in at least five years. Other profitability metrics followed suit. Operating cash flow in the final quarter was $11.3 million. That stacks up against the $7.4 million generated in the final quarter of 2020. On an adjusted basis, this metric rose from $0.2 million to $14.3 million, while EBITDA expanded from $0.7 million to $14.3 million. As the chart above illustrates, this also meant stronger performance across all categories compared to both 2020 and 2019.
Author – SEC EDGAR Data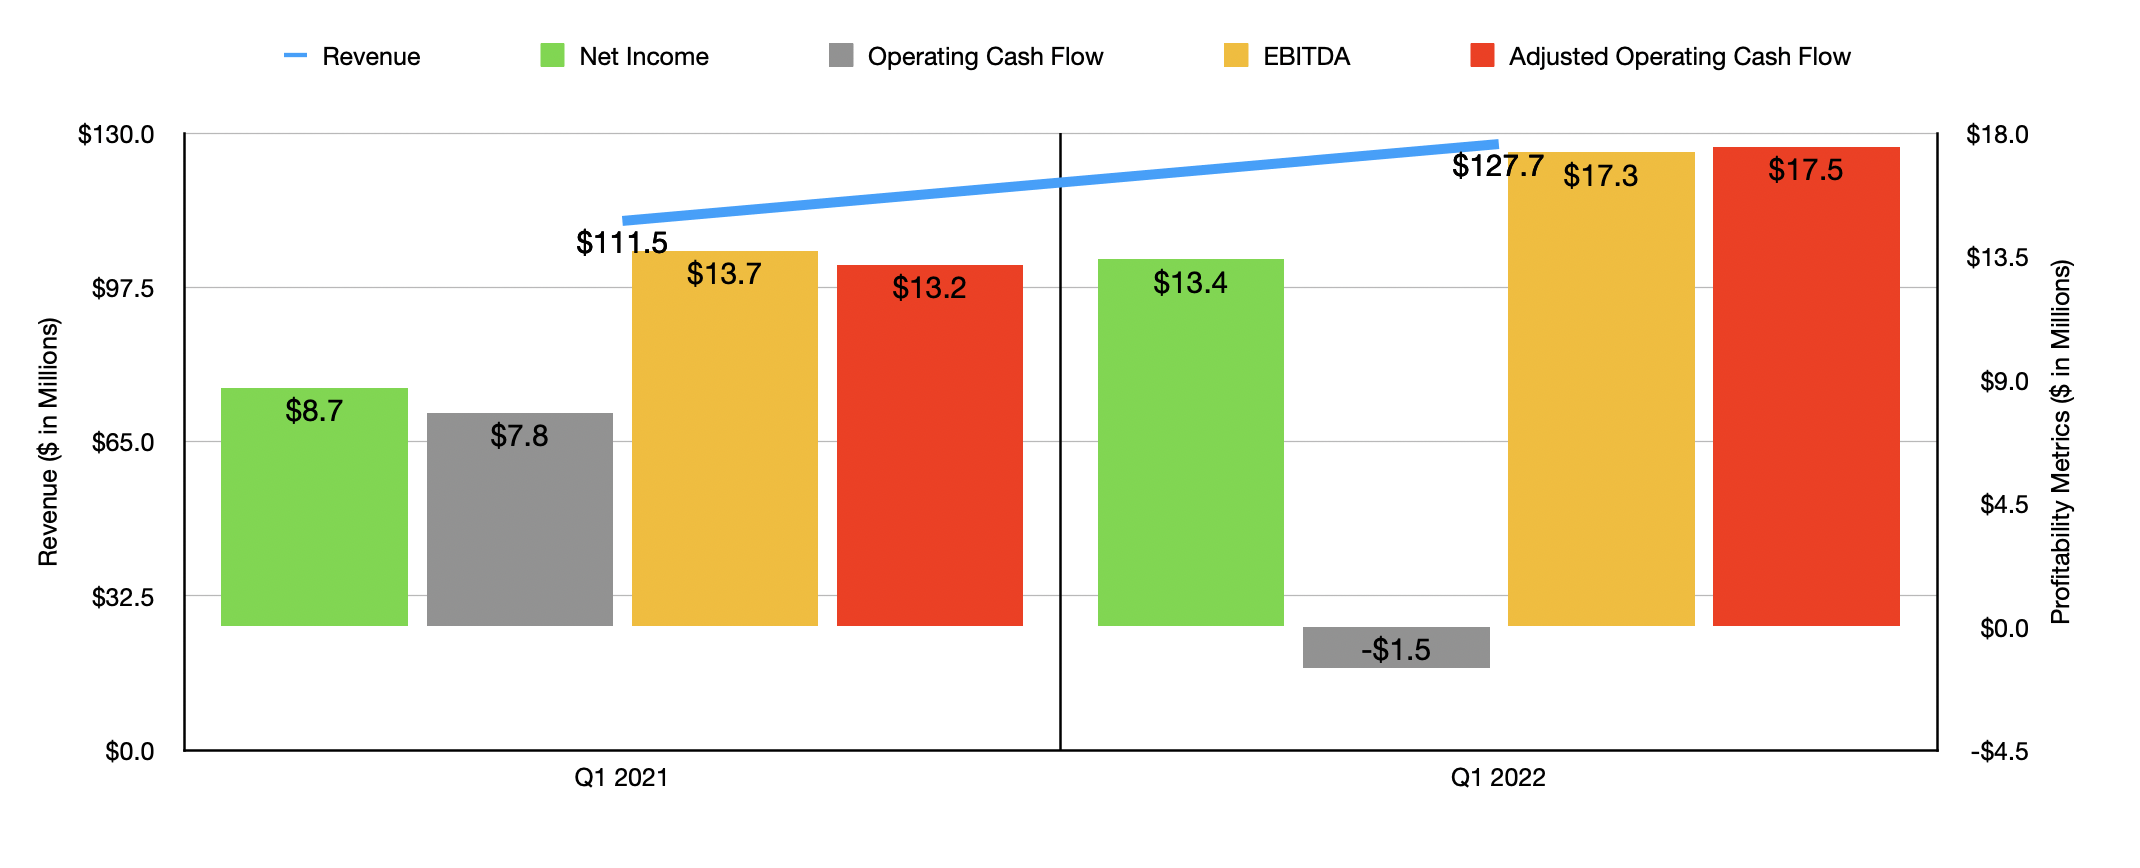
Now, we have even more data. In the first quarter of 2022, management continued to increase sales, with revenue of $127.7 million coming in 14.5% above the $111.5 million generated in the first quarter of 2021. Net income rose from $8.7 million to $13.4 million. Operating cash flow did worsen, dropping from $7.8 million to negative $1.5 million. But if we adjust for changes in working capital, it would have risen from $13.2 million to $17.5 million. A similar increase can be seen when looking at EBITDA. It ultimately rose from $13.7 million in the first quarter of 2021 to $17.3 million the same time this year. When it comes to the 2022 fiscal year, management does believe that revenue should come in at between $510 million and $530 million. Although this represents an increase compared to what the business achieved in 2021, they do think that EBITDA might be somewhere around $52 million. That represents a substantial decline compared to what the business generated in its 2021 fiscal year. If we assume that operating cash flow will follow suit, then that metric should come in at around $50.3 million for the year.
Although financial performance for the company has been looking up, the firm does have some structural problems. The real big issue is that management continues to close down stores. Today, the company generates about 31% of its revenue from direct-to-consumer activities that largely relate to its online sales. That’s a nice chunk, but nothing should distract from the fact that the company only has 286 stores in operation today. For the 2021 fiscal year, it had 290 stores in operation. In 2020, this number was 311. And back in 2016, this number was 343. Clearly, the business is suffering from a declining footprint. And unless we see its online sales increase further, there could be some long-term pain for the company. That’s also why I found myself unenthused when management announced, on March 15th of this year, its decision to authorize a $15 million share buyback program. Instead of buying back stock, management should be focused on improving the company’s top and bottom lines.
Author – SEC EDGAR Data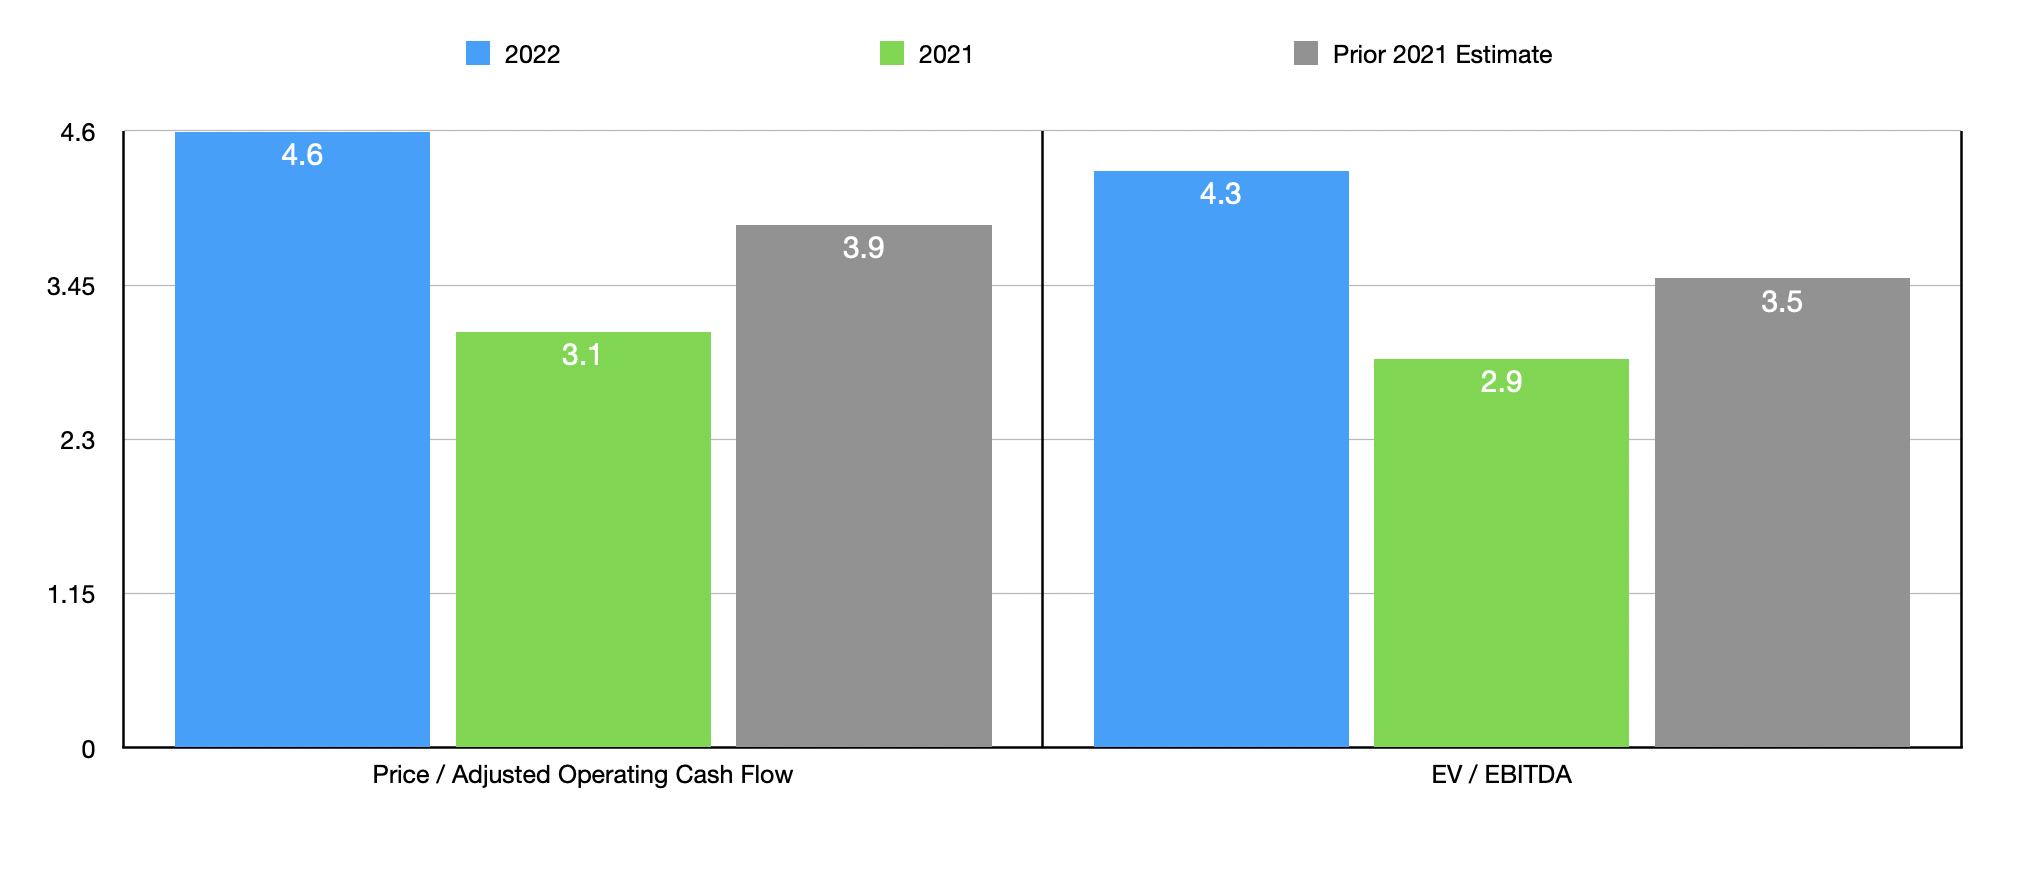
Clearly, Destination XL Group has some long-term issues. But what drove me to rate the company a ‘buy’ was how cheap shares were. Using the data from 2021, the firm is trading at a price to adjusted operating cash flow multiple of 3.1. And the EV to EBITDA multiple should be 2.9. If we use the 2022 estimates, these numbers increase to 4.6 and to 4.3. To put this in perspective, I decided to compare the company to five similar firms. On a price to operating cash flow basis, these companies ranged from a low of 3 to a high of 23.3. Using our more conservative 2022 estimates, we can see that two of the five companies are cheaper than Destination XL Group. Meanwhile, using the EV to EBITDA approach, the range is from 1.3 to 5.7. In this case, three of the five companies are cheaper than our prospect.
| Company | Price / Operating Cash Flow | EV / EBITDA |
| Destination XL Group | 4.6 | 4.3 |
| Citi Trends (CTRN) | 3.4 | 1.5 |
| Express (EXPR) | 9.8 | 3.3 |
| J.Jill (JILL) | 3.0 | 5.7 |
| Tilly’s (TLYS) | 8.8 | 1.3 |
| Tandy Leather Factory (OTCPK:TLFA) | 23.3 | 5.0 |
Takeaway
In most respects, Destination XL Group looks to be trading on the cheap and financial performance recently has been impressive. Moving forward, revenue should climb further. But it looks as though profitability will take something of a beating this year. As a value-oriented investor who likes to be conservative with his investments, I would prefer to err on the side of caution. Long term, the company does not look all that great and I am particularly discouraged with what the rest of this year might look like. So because of that, I have decided to downgrade the business from a ‘buy’ to a ‘hold’.
Be the first to comment