

S&P 500, VIX, Inflation, Dollar, EURUSD and USDJPY Talking Points:
- The Market Perspective: USDJPY Bearish Below 141.50; Gold Bearish Below 1,680
- The S&P 500 suffered its worst single-day loss in over two years, but the swell in the VIX suggests we haven’t reached the long-awaited ‘capitulation’
- While CPI printed higher than expected, market conditions had more to do with the severe response versus the novel fundamental implications of the August inflation data
Trade Smarter – Sign up for the DailyFX Newsletter
Receive timely and compelling market commentary from the DailyFX team
Subscribe to Newsletter
A Short-Term Severe Market Drop but Not Yet the Long-Term Capitulation
With a surprise, higher-than-expected consumer inflation print from the US this past session, the market found justification for a sharp decline for risk-leaning assets like the S&P 500. Yet, I would contend that the abrupt market collapse had more to do with the market conditions than it did the actual data itself. Consider the headline inflation report which slowed to an 8.3 percent annual pace versus the 8.1 percent expected and 8.5 percent previous. That is certainly a ‘beat’, but it hardly swings the series towards any new extremes. Instead, the market found itself leaning heavily against an unfavorable outcome. There was significant skew in the markets given to a more rapid deflation in the price gauge reflected in breakeven rates that seemed to build on the NY Fed’s consumer inflation report from Monday. Adding to that liquidity and volatility have not fully acclimated to the seasonal norms that we have come to expect.
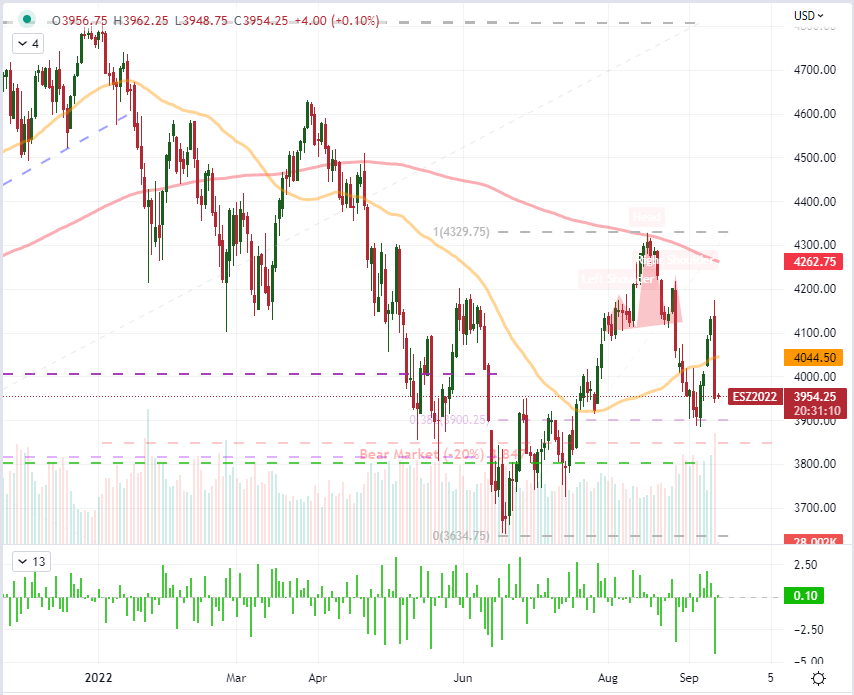
Chart of S&P 500 Emini Futures with Volume, 50 and 200-Day- SMAs as well as 1-Day ROC (Daily)
Chart Created on Tradingview Platform
There is no mincing words on how extreme the swoon in risk assets was this past session. The S&P 500’s -4.3 percent tumble was the largest since June 11, 2020 – with no other comparable declines before the tumult of the pandemic (February to March 2020) since August 2011. As one would expect from a sweep of risk appetite, the more targeted Nasdaq 100 suffered a more intense -5.5 percent tumble which drove the Nasdaq-to-Dow ratio (growth-to-value) sharply lower. It wasn’t just a US indices phenomenon. From European equities to emerging markets to junk bonds, there was a sympathetic plunge. And yet, correlation and intensity signals neither conviction or capitulation – though you will find true believer bears and bulls make the argument. Such intense moves historically have not generated a strong record of immediate follow through – in fact recent years could be used to infer a turn, but I would argue against such immediate contrarianism. That is particularly true of those opportunists constantly on the hunt for ‘capitulation’ to ‘pick a bottom’ on the market. While the market’s shift was sharp and severe, we are far from the measures of panic that can historically reflect a market that has flushed its hold out hopes. I would consider that extreme on the VIX to be somewhere on the order of the 50.0 handle, but we are barely above the half-way point on that stretch.
Chart of VIX Volatility Index (Weekly)
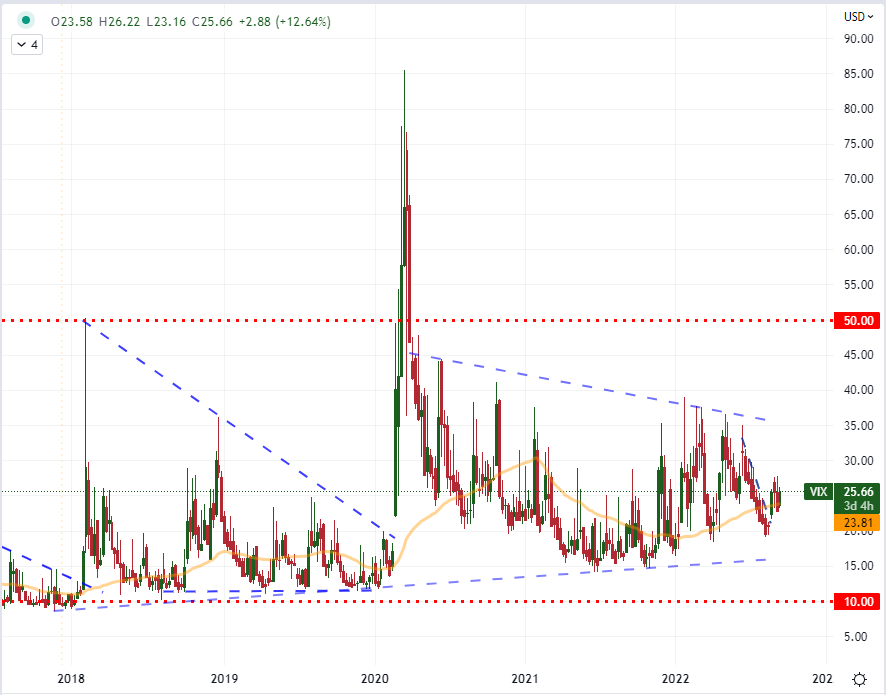
Chart Created on Tradingview Platform
Inflation’s Influence on Rate Forecasts and Recession Fears
While I would contest that market conditions were the greatest amplifier for this past session’s response to the inflation report, there is no mistaking the economic ramifications of the data. Considering we are in the Fed’s self-imposed media blackout leading up to the FOMC rate decision (September 21st), the market was left to digest the data itself without a steer from the central bank. As it happens though, the higher-than-expected number catered to the warnings we were given before officials were blocked from media engagements. There was a concerted warning that inflation was the priority – a focus that would take precedence over potential economic contraction and perhaps even a market tantrum. That skepticism that the Fed could push forward with its front-ended effort to catch up to inflation took a serious hit given Fed Fund futures showed expectations of a 75 basis point hike at 73 percent probability last week and 91 percent the day before transitioned to a 33 percent probability of a 100 basis point move come next Wednesday.
Probabilities of 75bp Vs 100bp Rate hike by Fed at Sep 21st Meeting Via Fed Fund Futures

Bar Chart and Table from CME FedWatch
While I believe the market’s expectations of a quick deceleration of policy pacing from the central bank – and particular forecasts of a 2023 cut – were improbable, a full percentage point hike doesn’t seem any more realistic. Consider the warnings of the past weeks have tied a ‘significant’ move to the previous two meetings’ 75bp clip and the data itself was only modestly higher than forecasts while consumer expectations are for a return to target in the foreseeable future. Yet, the fundamental pressure is not just isolated to the rate implications. The possibility of economic fallout is another existential threat that could have ripple effects across the markets. Two months ago, I ran a poll asking participants what they though the probability of a US recession was immediately after the release of – what is now looking like the peak – inflation figure, and some 82 percent said an economic slump was likely. I proffered the same question around this week’s August inflation report and the split was a much more balanced 54 to 46 percent split. If it weren’t for the NBER’s controlling assumptions of the definition of ‘recession’ this fear could be worse.
Twitter Poll Asking Probability of US Recession in 2022 from July 13 to September 13
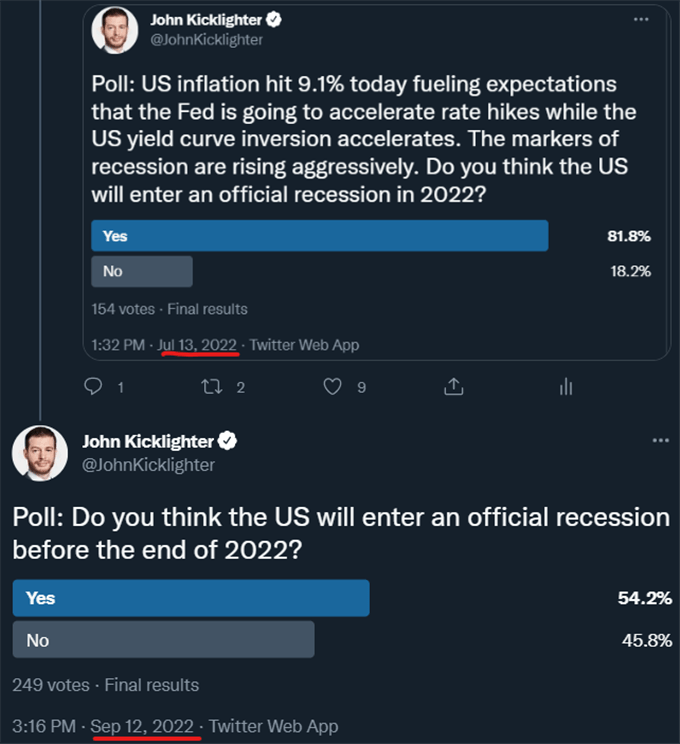
Poll from Twitter.com, @JohnKicklighter
While the poll I conducted and the sentiment surveys registered this past session are pushing back against the notion that the world’s largest economy is doomed to slide, various market measures indicate enthusiasm is not a universal state. Beyond the argument to be made of ‘risk’ assets or through economic-adjacent markets like crude oil, investors’ favorite ‘wonkish’ measure of recession risks (the US 10-year to 2-year yield spread) did suffer an abrupt slide deeper into inversion. It is possible to make a bullish case for speculative markets, but it is important to be honest about the fundamental backdrop that would at best be overlooked in favor of a market direction or at worst contradict the view.
Chart of US 10-Year to 2-Year Yield Spread with 100-Day SMA (Daily)
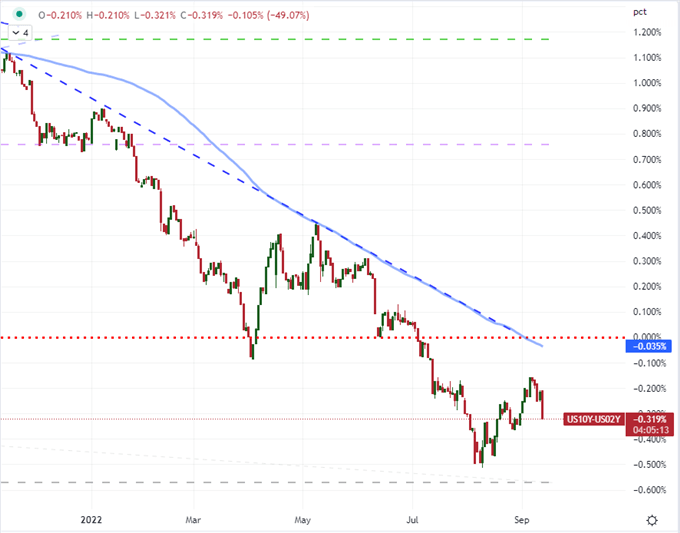
Chart Created on Tradingview Platform
Ahead: Event Risk and Intervention Risk
With the US CPI reading behind us, we may have hit ‘peak event risk’ for the week. Nevertheless, we have an unsettled market and plenty of additional event risk ahead. On the economic docket, the US will still be in the crosshairs as the upstream producer inflation report (the PPI) is due at 12:30 GMT. Should this indicator defy expectations of moderation as well, the assumptions for September price readings will suffer a sharp readjustment. I will hold the import/export inflation reports due Thursday in similar regards. The US isn’t the only market target on an event risk perspective. The UK inflation data and European Commission President’s state of the Union will cater to their own respective recession fears.
Calendar of Major Macro Economic Events for the Next 48 Hours

Calendar Created by John Kicklighter
Whether the discussion is carry potential, risk trends or another fundamental driver; I believe USDJPY is a market that should be observed by macro watchers. After the CPI beat this past session, this pair – like most Dollar-based crosses – experienced a strong rally. The charge brought EURUSD back below parity, GBPUSD and USDCNH within reach of their extremes; but it was USDJPY that was most impressive. The risk aversion we saw in the markets seemed to waver in the face of yield differential perspectives. To be fair, the Dollar is more a safe haven than the Yen, but was there no unwinding of Japanese investors from their exposure abroad. With the August 1998 high in view once again, it is imperative to watch the threats of intervention by the Ministry of Finance very closely. That is not to say that they will be successful in turning the markets, but their efforts have generated serious volatility in the past.
Recommended by John Kicklighter
How to Trade USD/JPY
Chart of USDJPY with 20-Day SMA and 1-Day ROC (Daily)
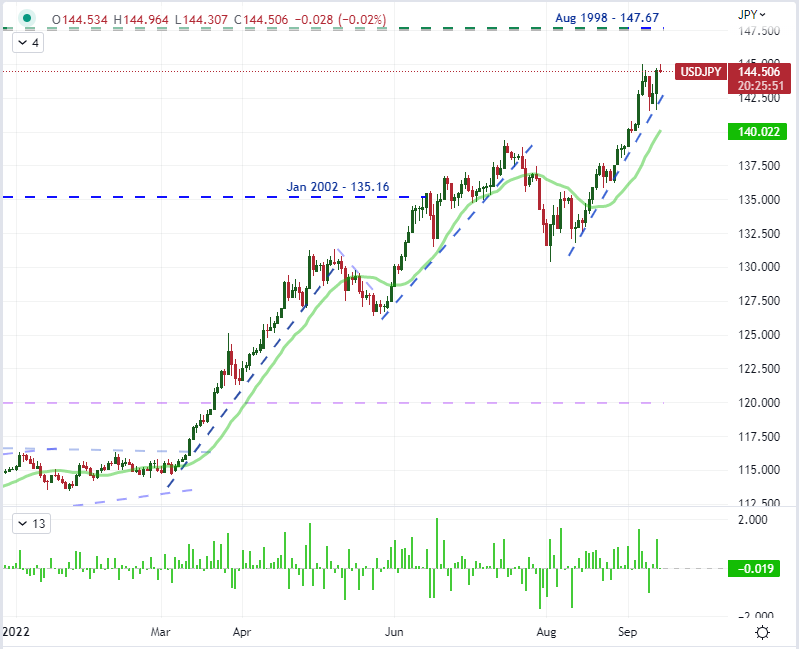
Chart Created on Tradingview Platform
Be the first to comment