

COPPER ANALYSIS
- Jerome Powell dovish stance bolsters copper prices as bleak USD outlook persists
- COT report points to plateauing longs
- Technical analysis may point to short-term correction
COPPER FUNDAMENTAL BACKDROP
Copper has been the stand out commodity (metals) in terms of price action these past few weeks with multi-year highs being breached. Copper is a unique metal in that it has a vast range of uses across different industries that set it apart from more limited-use metals. This broad use allows for copper to act as an inflation hedge due to its proxy for economic growth. With COVID-19 vaccine rollouts taking place across the world coupled with a low interest rate environment, copper has been surging in line with an expectant economic recovery.
Historically, the inflation to copper price correlation has been largely positive (see chart below) as both variables are influenced by similar factors. Yesterday, Fed Chairman Jerome Powell highlighted inflation as being “soft” as inflation data currently sits well below their goals although the labour market is showing promise. To combat this issue, Powell continued to stress the Fed’s reluctance to tighten monetary policy which could provide additional support for medium-term copper prices.
GLOBAL MANUFACTURING PMI VS LME COPPER PRICE
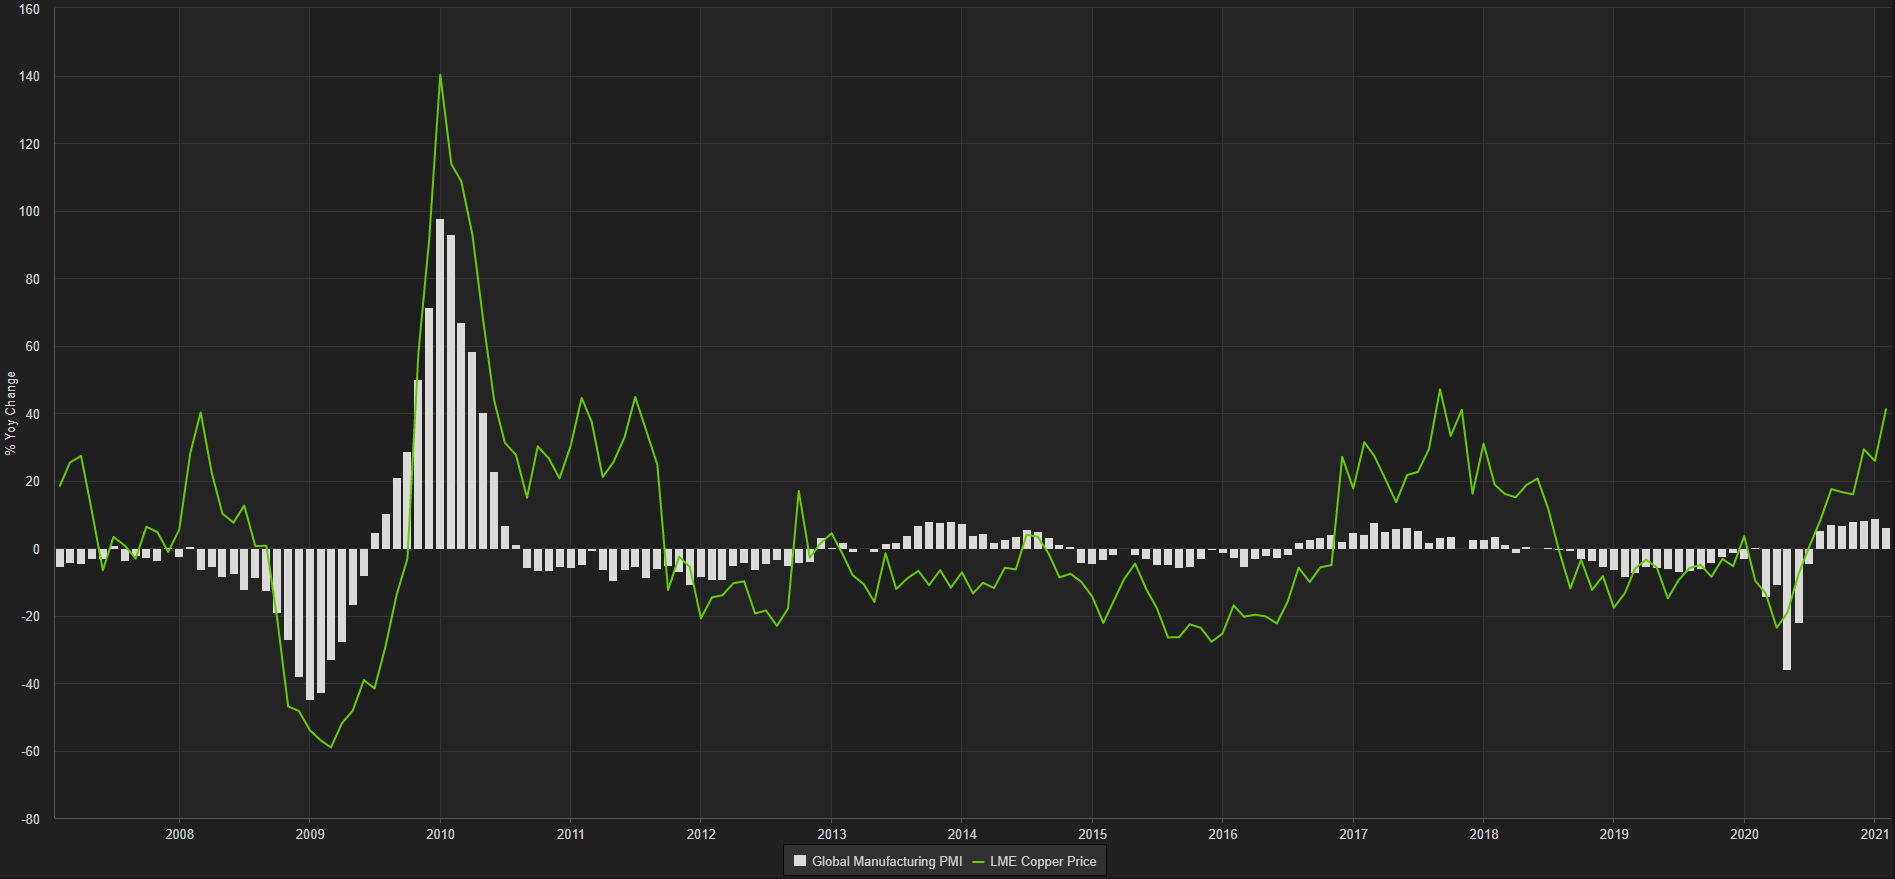
Chart prepared by Warren Venketas, Refinitiv
LIMITED COPPER SUPPLY WHILE DEMAND INCREASES ACROSS INDUSTIRES
Copper supply has been under strain as demand rises which has contributed to the recent price swell. Demand is expected to increase as alternative ‘green’ avenues and industries expand. Main drivers include Electric Vehicles (EV’s), energy storage and 5G networks. As these components grow as an influence on copper, it could be forecasted that this would lead to higher copper prices over time.
COPPER FUTURES COMMITMENT OF TRADERS (COT) REPORT SUMMARY
The copper COT report summary shows that long positioning may be dissipating as market participants become wary of the sharp rise in copper prices. While positioning remains largely net-long, the percentage change from the previous report shows a decrease in additional positions. This could lead to a correction or consolidation in copper prices (short-term) which could see investors waiting for a dip to re-enter into long positions.
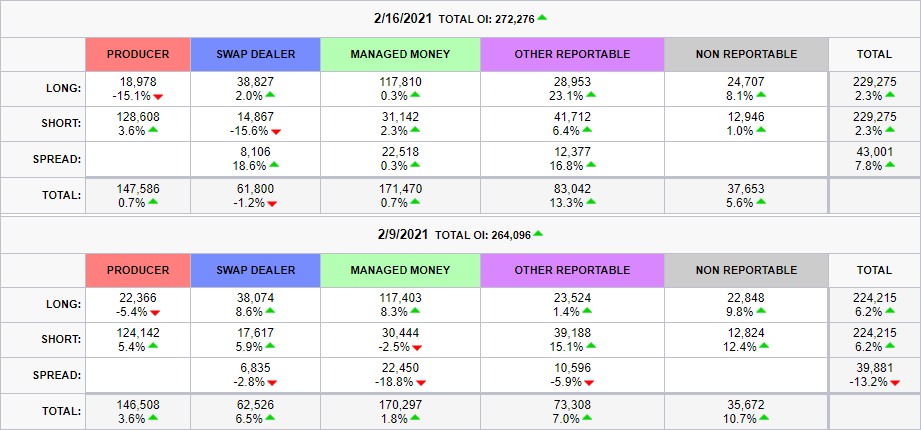
Source: CME Group

Recommended by Warren Venketas
Trading Forex News: The Strategy
TECHNICAL ANALYSIS
COPPER WEEKLY CHART

Chart prepared by Warren Venketas, IG
The weekly copper chart above shows the strong bullish move that has taken place in recent weeks. Breaking through the $4.000/lb psychological resistance barrier this week (now turned support), a long upper wick has ensued which shows price rejection at the $4.2454/lb level. This long wick candle formation (should it close as such) may suggest a succeeding downward move (correction) or a sideways move before confirming any further directional bias.
The Relative Strength Index (RSI) is currently heavily overbought around the 79 level which supplements the correctional move lower. $4.000/lb will likely serve as initial support which could be a zone of long orders in hopes of further fundamental backing.
The recent swing high at $4.2454/lb now provides initial resistance thereafter, the 2011 all-time high will come into focus ($4.6495/lb).
Starts in:
Live now:
Mar 02
( 18:03 GMT )

Keep up to date with price action setups!
Trading Price Action
— Written by Warren Venketas for DailyFX.com
Contact and follow Warren on Twitter: @WVenketas
Be the first to comment