

Wirestock/iStock Editorial via Getty Images
Deere & Co (NYSE:DE) and Kubota (OTCPK:KUBTY) are two of the largest and most well-known agricultural equipment manufacturers in the world. Kubota is focused on tractors and equipment for rice farming, while Deere primarily offers large-scale farm machinery. Kubota has differentiated itself by specializing on the low horsepower segment. Both companies have a long history of producing high-quality equipment for farmers.
Deere & Co has a more diversified revenue stream, with around one-third of its revenue coming from its construction and forestry equipment. Meanwhile, Kubota’s machinery business accounts for more than 80% of its revenue, with the remainder mainly coming from its water and environmental solutions business.
Both companies are expanding their product lines to include more technology-enabled equipment, including precision agriculture and autonomous machinery. For example, Kubota has the precision farming system KSAS (Kubota Smart Agri System) which is a platform that allows farmers to collect data and make more informed decisions on planting and harvesting. It is also working on automated and unmanned agricultural machinery. Similarly during a press conference at CES 2022, Deere revealed a fully autonomous tractor that it said is ready for large-scale production, even though the website still says “Coming Soon”. In any case the company’s vision is to build a world of fully autonomous farming by 2030.
Financials
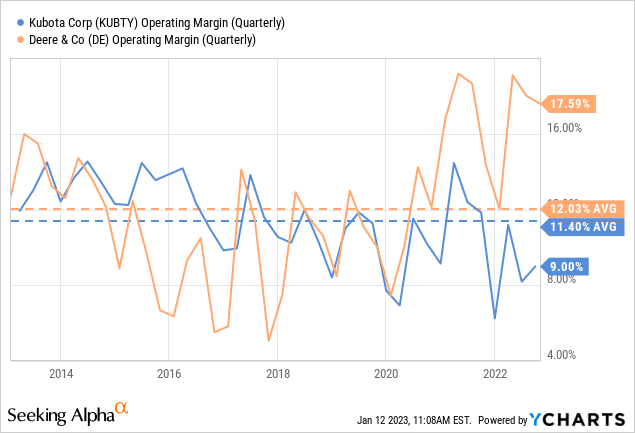
Their average operating margin over the past ten years is relatively close, with Kubota at ~11% and Deere at ~12%, but they have significantly diverged in the past couple of years. Deere’s operating margin has increased as a result of significant operating leverage thanks to its increasing sales, while Kubota has been impacted by the rise in material prices and logistics expenses, and the sales decrease of agricultural-related products due to a decline in the price of rice and termination of subsidies for farmers in Japan.
Growth
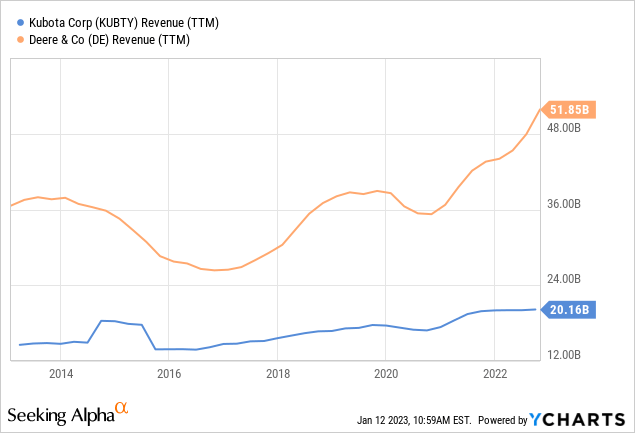
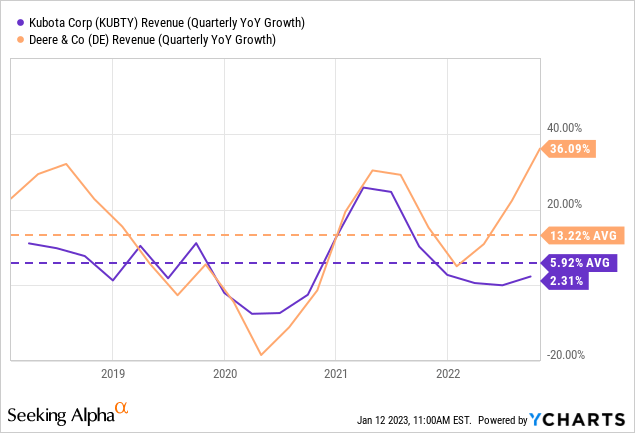
Deere has about 2.5x the revenue of Kubota, and lately has been growing much faster. One of the reasons is that the commodities Deere’s customers are more exposed to, such as corn, soybeans, and wheat have risen more than the commodities Kubota customers grow, such as rice. This is of course a simplification, and there is an overlap of customers, but on average we believe Deere has benefited more from commodity inflation.
Over the last five years Deere’s growth rate has been roughly twice that of Kubota, and this is one of the main reasons why its stock has outperformed Kubota by such a wide margin.
Balance Sheet
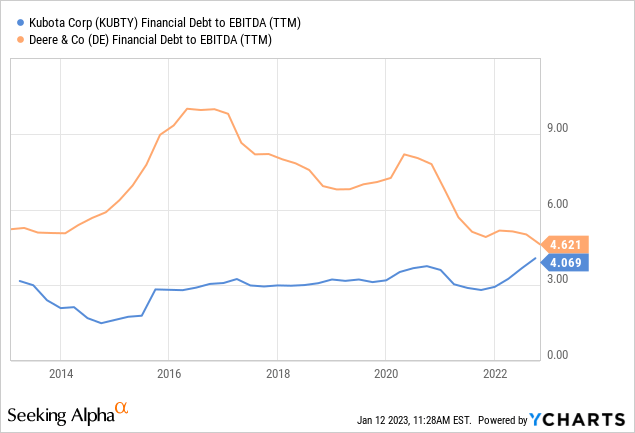
Historically Kubota has been managed in a very conservative fashion, with low leverage, but it has moved higher recently to ~4x, while Deere’s expanding EBITDA has brought its leverage down significantly to ~4.6x.
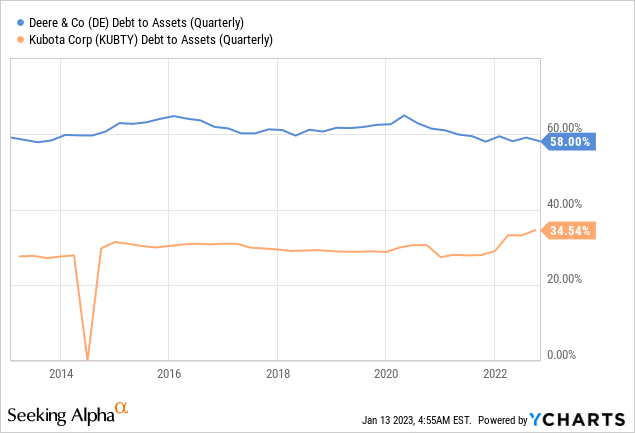
Kubota’s debt to assets is much lower than that of Deere, and in general we would say Kubota appears to have the more solid balance sheet, even though some of its metrics have been deteriorating wile Deere’s have been improving.
Valuation
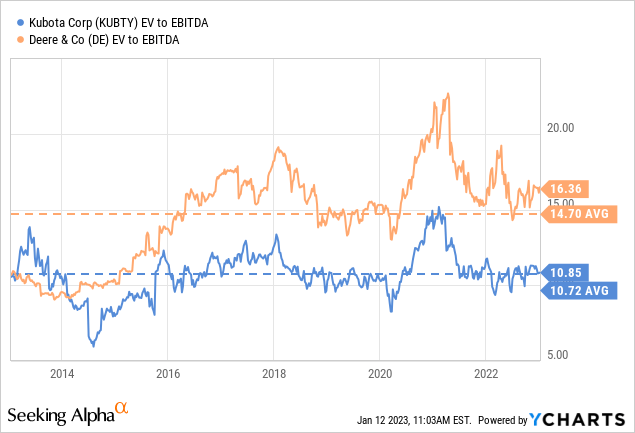
So far, we’ve seen that Deere has better profit margins and higher growth, while Kubota has a more conservative balance sheet. Where things get really interesting is when we take a look at the valuation. Deere’s EV/EBITDA is significantly higher at ~16x compared to Kubota’s ~10x. Kubota is trading close to its ten year average multiple, while Deere is trading at a ~10% premium to its own ten year average.
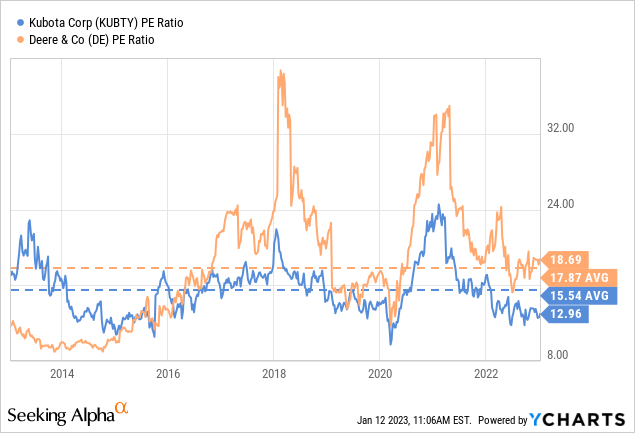
Similarly there is a big difference in their price/earnings ratio, with Deere trading at a ~18x multiple, compared to Kubota’s ~13x p/e. Deere is trading above its ten year average, while Kubota is trading below its own ten year average.
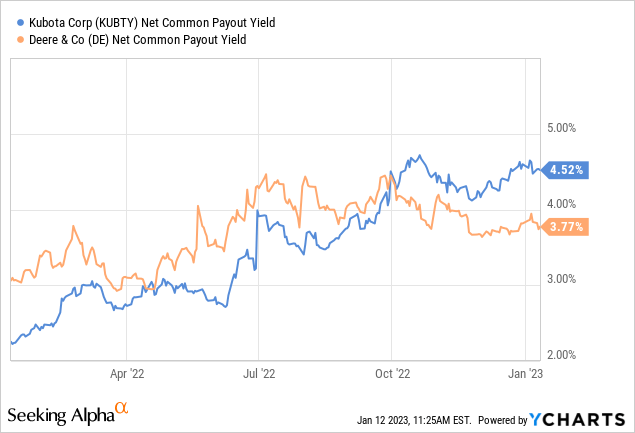
Kubota has currently a more attractive net common payout yield, which combines the dividend yield and the buyback yield.
Based on the net present value of our forward earnings estimates, we believe Kubota is ~16% undervalued at the moment.
| EPS | Discounted @ 10% | |
| FY 23E | 5.34 | 4.85 |
| FY 24E | 5.55 | 4.41 |
| FY 25E | 5.88 | 4.17 |
| FY 26E | 6.24 | 4.02 |
| FY 27E | 6.61 | 3.87 |
| FY 28E | 7.01 | 3.73 |
| FY 29E | 7.43 | 3.60 |
| FY 30E | 7.87 | 3.46 |
| FY 31E | 8.35 | 3.34 |
| FY 32E | 8.85 | 3.22 |
| FY 33E | 9.38 | 3.10 |
| Terminal Value @ 3% terminal growth | 133.95 | 42.68 |
| NPV | $84.46 |
While we estimate Deere is only about 6% undervalued based also on the net present value of our forward earnings estimates for the company.
| EPS | Discounted @ 10% | |
| FY 23E | 27.88 | 25.35 |
| FY 24E | 29.39 | 23.04 |
| FY 25E | 31.23 | 22.08 |
| FY 26E | 31.65 | 21.33 |
| FY 27E | 32.39 | 19.65 |
| FY 28E | 35.31 | 18.28 |
| FY 29E | 38.48 | 18.12 |
| FY 30E | 41.95 | 17.95 |
| FY 31E | 45.72 | 17.79 |
| FY 32E | 49.84 | 17.63 |
| FY 33E | 54.32 | 17.47 |
| Terminal Value @ 3% terminal growth | 776.02 | 247.26 |
| NPV | $465.95 |
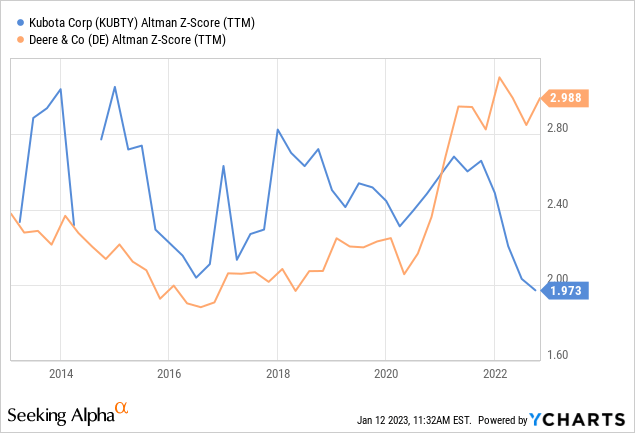
Risks
Deere and Kubota are both exposed to similar risks including global trade tensions and tariffs, commodity prices, foreign exchange rates, and global economic growth. Historically Kubota used to have a higher Altman Z-score, but thanks to its expanding margins Deere’s score is now higher than Kubota’s.
The Verdict
We would go with Kubota because it is more undervalued and its growth could surprise to the upside more easily. Deere has been growing at a much faster pace the last few years, but that growth is already reflected in the valuation. It is a pretty close call, and we can understand investors preferring one or the other at current prices.
Conclusion
Deere and Kubota are both great companies manufacturing quality equipment for the agricultural sector, with excellent reputations and brands. There has been a recent divergence in growth in the last couple of years, with Deere growing at a much higher rate than Kubota. Still, we believe the valuation difference to be significant enough to prefer Kubota over Deere at current prices. Deere already has high growth expectations in its valuation, while much less is expected from Kubota, setting it up to more easily surprise to the upside.
Editor’s Note: This article discusses one or more securities that do not trade on a major U.S. exchange. Please be aware of the risks associated with these stocks.
Be the first to comment