

Khanchit Khirisutchalual
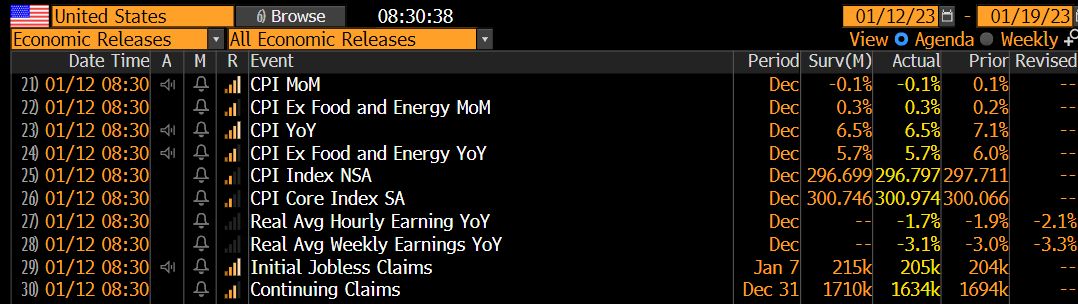
The December CPI report verified at –0.1% month on month vs. a consensus of that amount. Core CPI was +0.3%. The annual change was +6.5% vs. a consensus forecast of 6.5% and last month’s 7.1% year-on-year change. The June 2022 high water mark was last June at +9.1%. Ex-food and energy, yearly inflation was +5.7%, once again on par with expectations.
It was the first negative monthly CPI change since May 2020. Within the report, eggs, top of mind among consumers, rose 11.1% from November.
CPI vs Expectations
Christian Fromhertz
Stocks traded lower initially on the news following a significant rebound over the last several sessions, but then quickly moved back into the green after the report was digested. Yields, meanwhile, drifted up but then dropped, though it was not an extreme move.
Interestingly, jobless claims – both initial and continuing – fell from tight levels a week ago. Oil prices traded up on the news as WTI rebounds from the low $70s. The U.S. Dollar Index dipped by 0.5%.
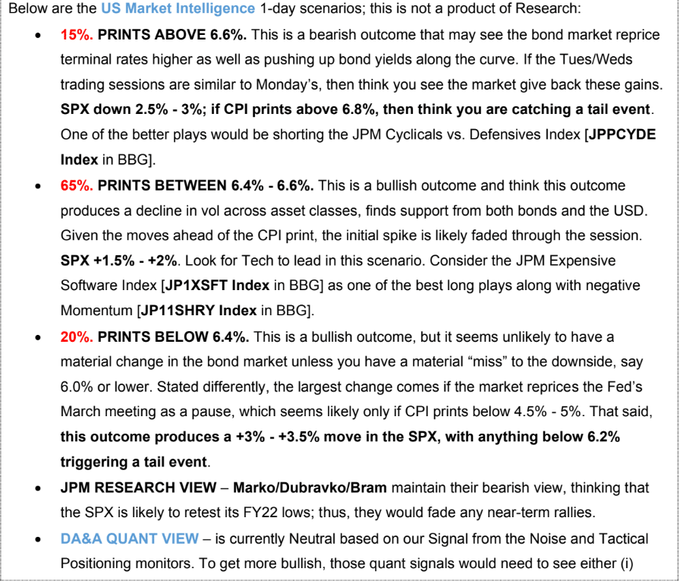
JP Morgan put its monthly outlook for expected S&P 500 price changes following the CPI report, so we’ll see how that verifies as today progresses. I would throw the below commentary and outlook in the “interesting, but not all that useful” category.
JPM: SPX Change Under Different CPI Scenarios, Expecting a +1.5% to 2% Gain Today
JP Morgan
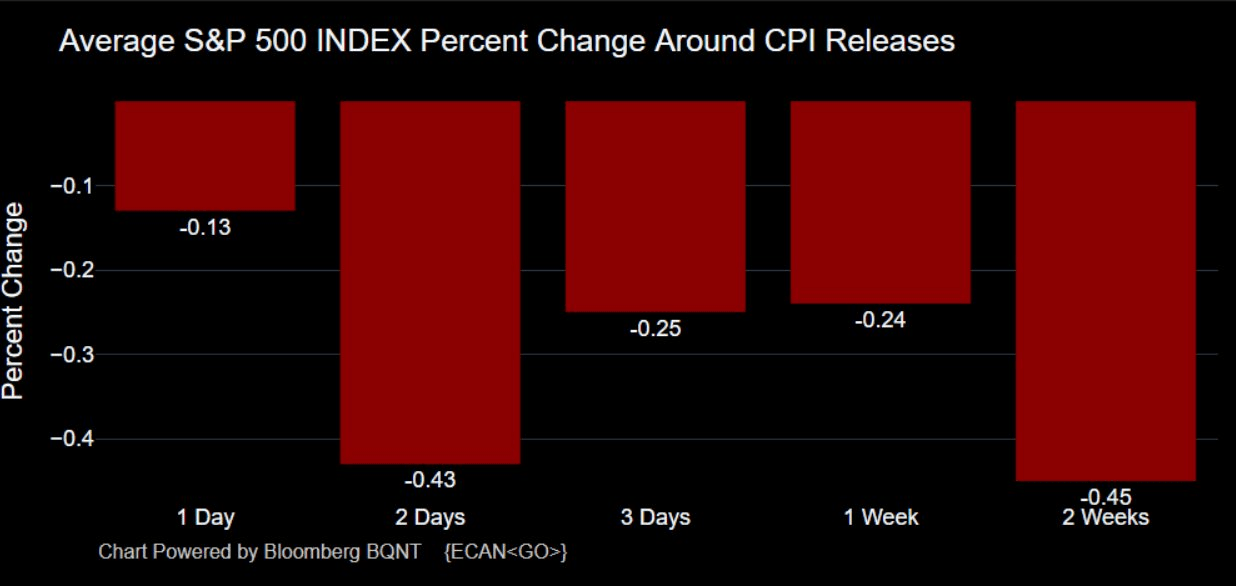
Looking back over recent price action following previous CPI releases, stocks have generally trended lower. On CPI Day, the S&P 500 has returned an average of –0.13%, but there has been a wide variance there with the October CPI survey, released in November, resulting in a massive 5.5% S&P 500 rally while the August CPI report in September featured an equity market plunge of 4.3%. Going out two weeks, returns lean negative as evidenced in the chart below.
Will it be different this time? I see support on the S&P 500 near 3800, but that’s now a little ways lower.
Stocks Often Struggle Post-CPI
Michael McDonough
Looking ahead, Goldman Sachs expects the inflation rate to continue lower through year-end. And that’s about on par with the consensus outlook among Wall Street economists.
With housing representing such a huge weight on CPI, the current core rate is likely elevated vs. what real inflation truly is. Of course, the Fed knows this, but the FOMC remains steadfast in its hawkish rhetoric. Jeremy Siegel says that 0.4ppt should be shaved off the CPI rate to arrive at the true figure. Other measures of inflation, such as real-time rent values, suggest the shelter component in CPI is hotter than it really is.
Inflation Expected to Ease Through 2023
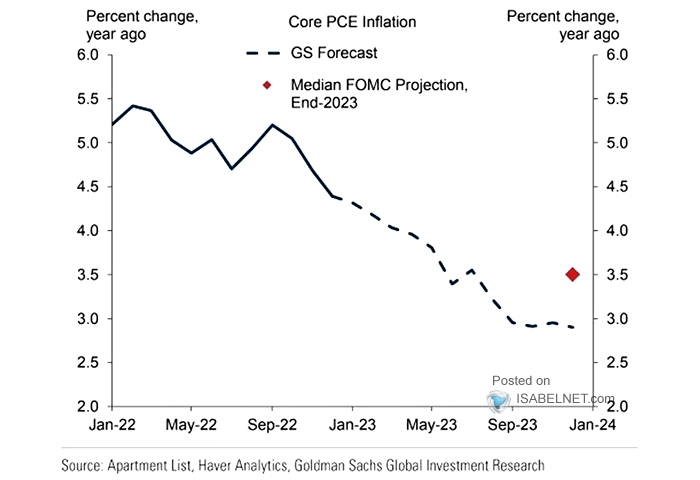
Goldman Sachs
Investors think the Fed is eventually going to see the true picture. The swaps trading market sees inflation very tame over the coming five and 10 years. Moreover, the chart below illustrates that the 1-year, 2-year, and 3-year breakeven rates are under 3%. Specifically, the next 12-month figure is solidly below 2% when comparing the yield on TIPS with the rate on comparable-term Treasuries.
Trader Inflation Expectations Very Soft
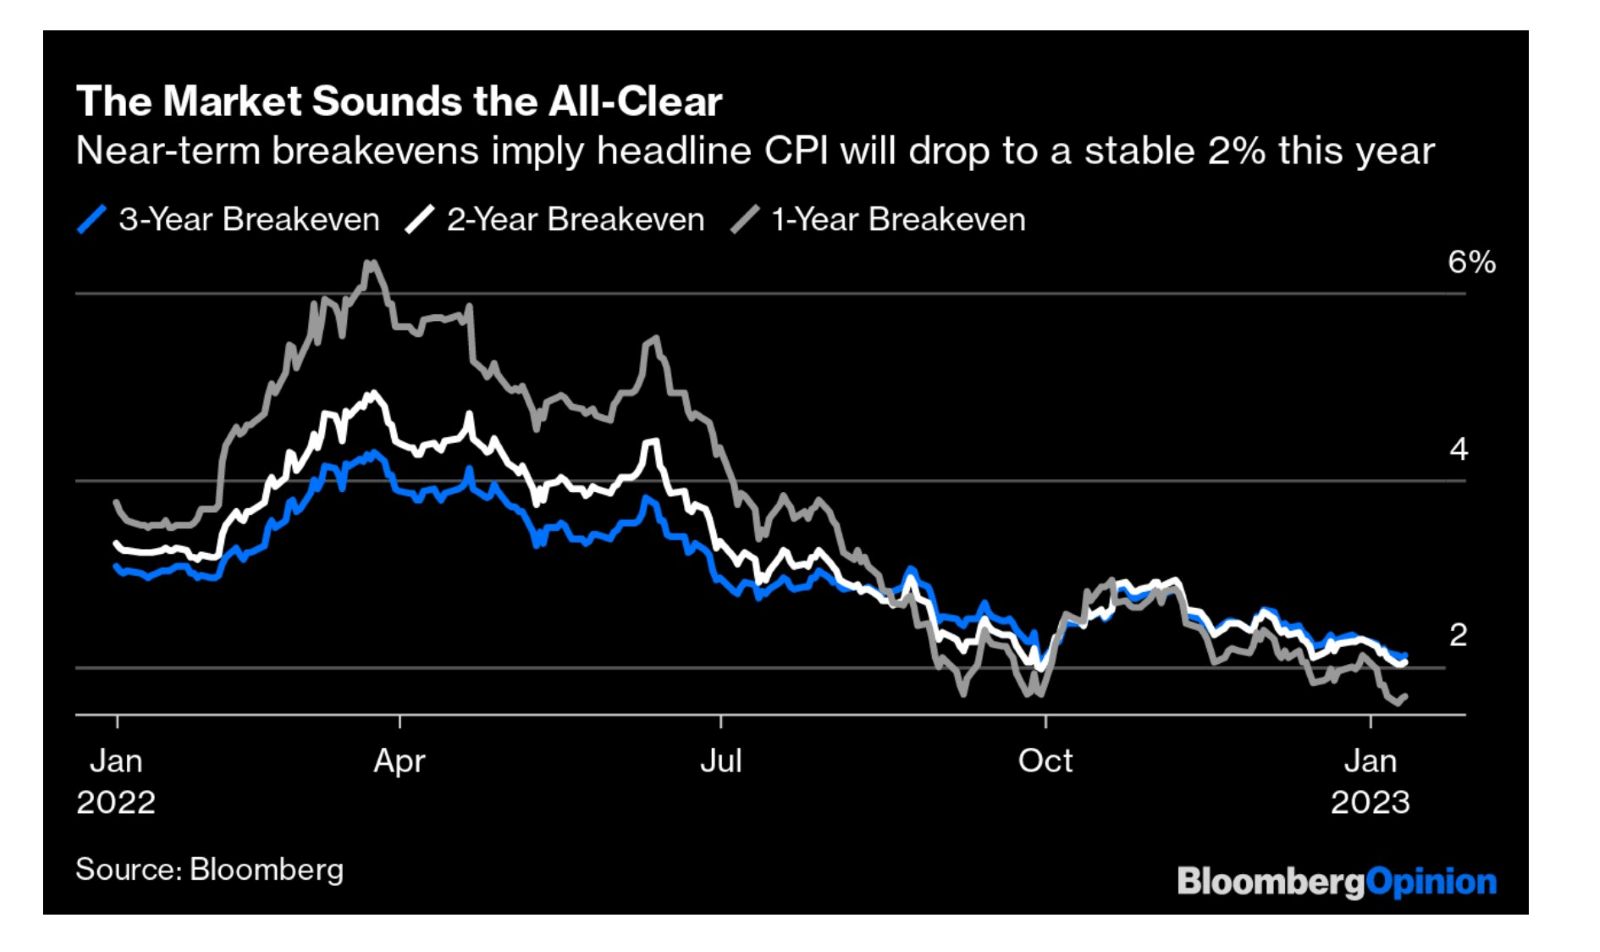
Bloomberg
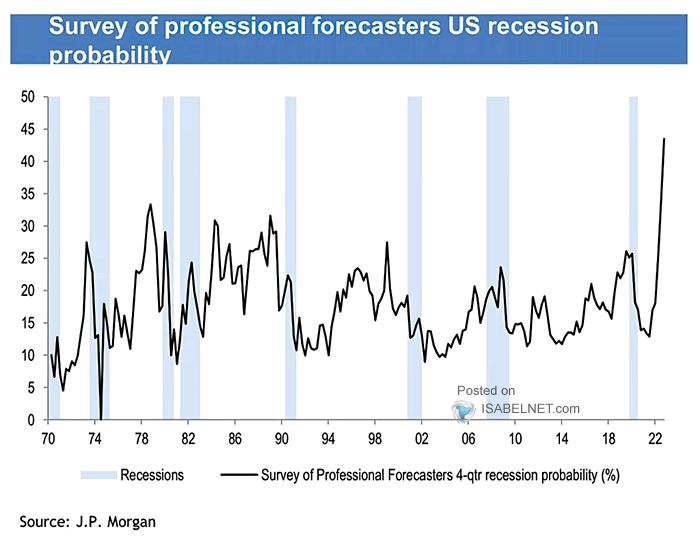
What could become a bigger issue is the threat of a U.S. recession. While Goldman Sachs lifted its call for a two-quarter economic contraction in Europe, and it still rejects the notion of a U.S. recession, a survey of professional forecasters sees a historically high chance of a US economic dip this year.
Fears are shifting from inflation to recession. Perhaps it would be an “own-goal” Fed-driven downturn given how strong the labor market is and with corporate profits hanging in there.
Recession Probabilities Rising Despite Goldilocks Chatter
JP Morgan
Meanwhile, investors apparently don’t want to own bonds at the moment. Commodity Trading Advisors holds a historically low allocation to fixed income with headline inflation still above 6% on a year-on-year basis. I see bonds as a reasonable alternative to equities right now given high yields relative to the past 15 years, and I expect fixed income to gradually turn into a portfolio ballast.
While day-to-day correlations are still tight with stocks, it’s quite likely that a downturn in the S&P 500 would not necessarily mean a steep fall in the total return of a diversified portfolio of bonds. Moreover, tight corporate credit spreads imply that risk is muted compared with past downturns. Let’s take a closer look specifically at the speculative-grade U.S. bond market.
Lowly CTA Bond Allocations
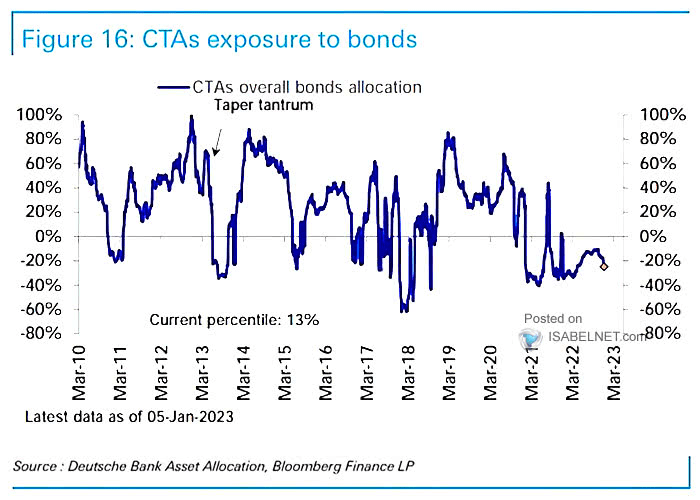
Deutsche Bank
According to iShares, the Broad USD High Yield Corporate Bond ETF (BATS:USHY) seeks to track the investment results of an index composed of U.S. dollar-denominated, high-yield corporate bonds. It’s used to complement core fixed-income holdings to enhance portfolio income and performance potential, per the fund website.
USHY is a highly liquid way to get access to the U.S. junk debt market with a 30-day average volume of more than 6 million shares and a median 30-day bid/ask spread of just three basis points. The expense ratio is low at just 0.15%.
The fund holds 1,929 issues and features a yield to maturity of 8.22%, much higher than the scant payout rates seen for much of late 2020 through 2021. USHY’s standard deviation is about half that of the broad equity market at just 11.22%, so you can capture a high yield with lower volatility than, say, the S&P 500.
Also, USHY features a duration roughly half that of the investment-grade corporate bond index (4.0 years on USHY), so it’s much less sensitive to changes in interest rates. If inflation makes a comeback and rates rise, you might fare OK in USHY so long as the stock market hangs in there.
USHY is less concentrated in just a few sectors. Consumer Cyclicals, also known as discretionary, make up 21% of the ETF followed by Communications (Communication Services) at 16%.
USHY: Somewhat Diverse Sector Exposure
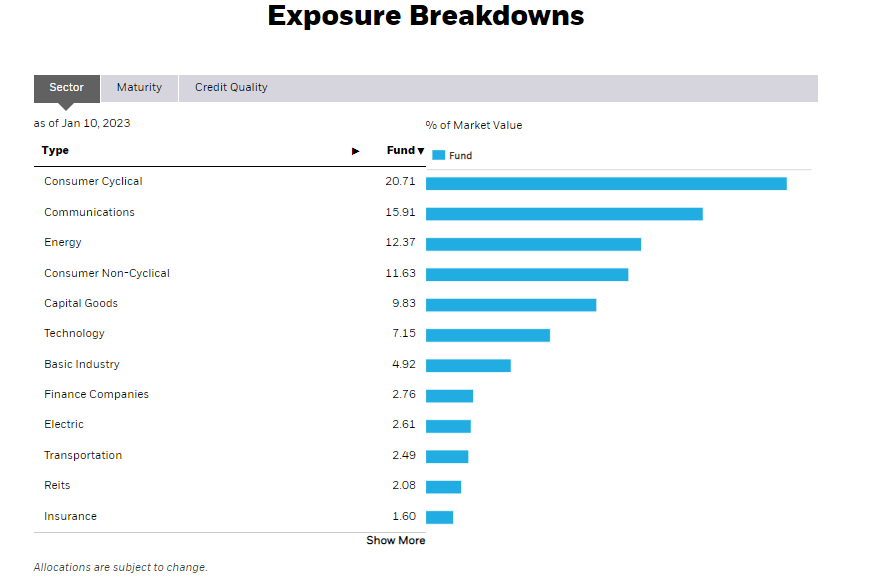
iShares
With yield spreads somewhat narrow compared to past bear markets and with ongoing chatter of recession, what does the chart of USHY tell us about future price action? I see resistance in the $37 to $38 range, so there’s room for more upside here. Also notice in the five-year zoom below that the ETF has settled above its falling 200-day moving average for the first time since late 2021 as momentum spikes.
The onus is on the bulls to keep the bounce going, but a decent looking low could be in place. USHY undercut its June 2022 low this past October but then held that level on a retest in the last few weeks. The fund could be building a base.
USHY: Resistance Near $37.50
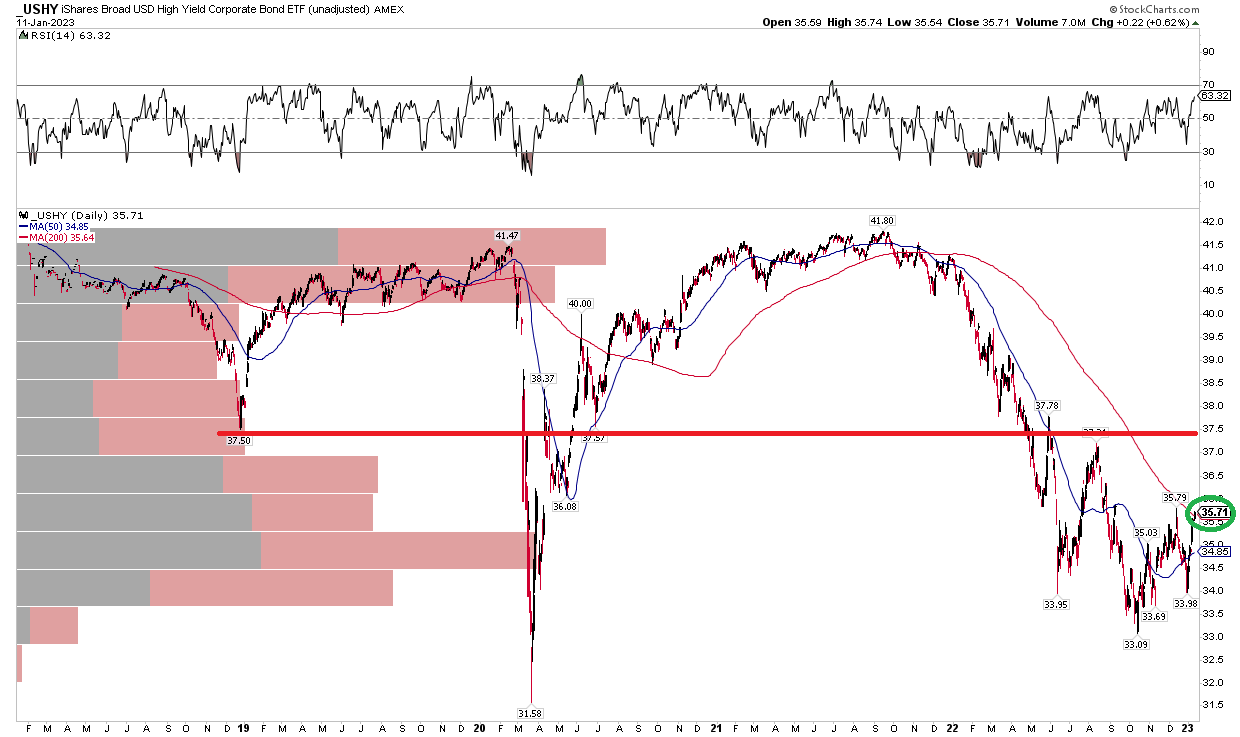
Stockcharts.com
The Bottom Line
High-yield bonds continue to rebound, and higher equity prices coupled with tamer rates is a good situation for USHY. I see modest upside to come but, gains should be taken near $37 on the fund.
Be the first to comment