

Bitcoin, Ethereum, Cryptocurrency Talking Points:
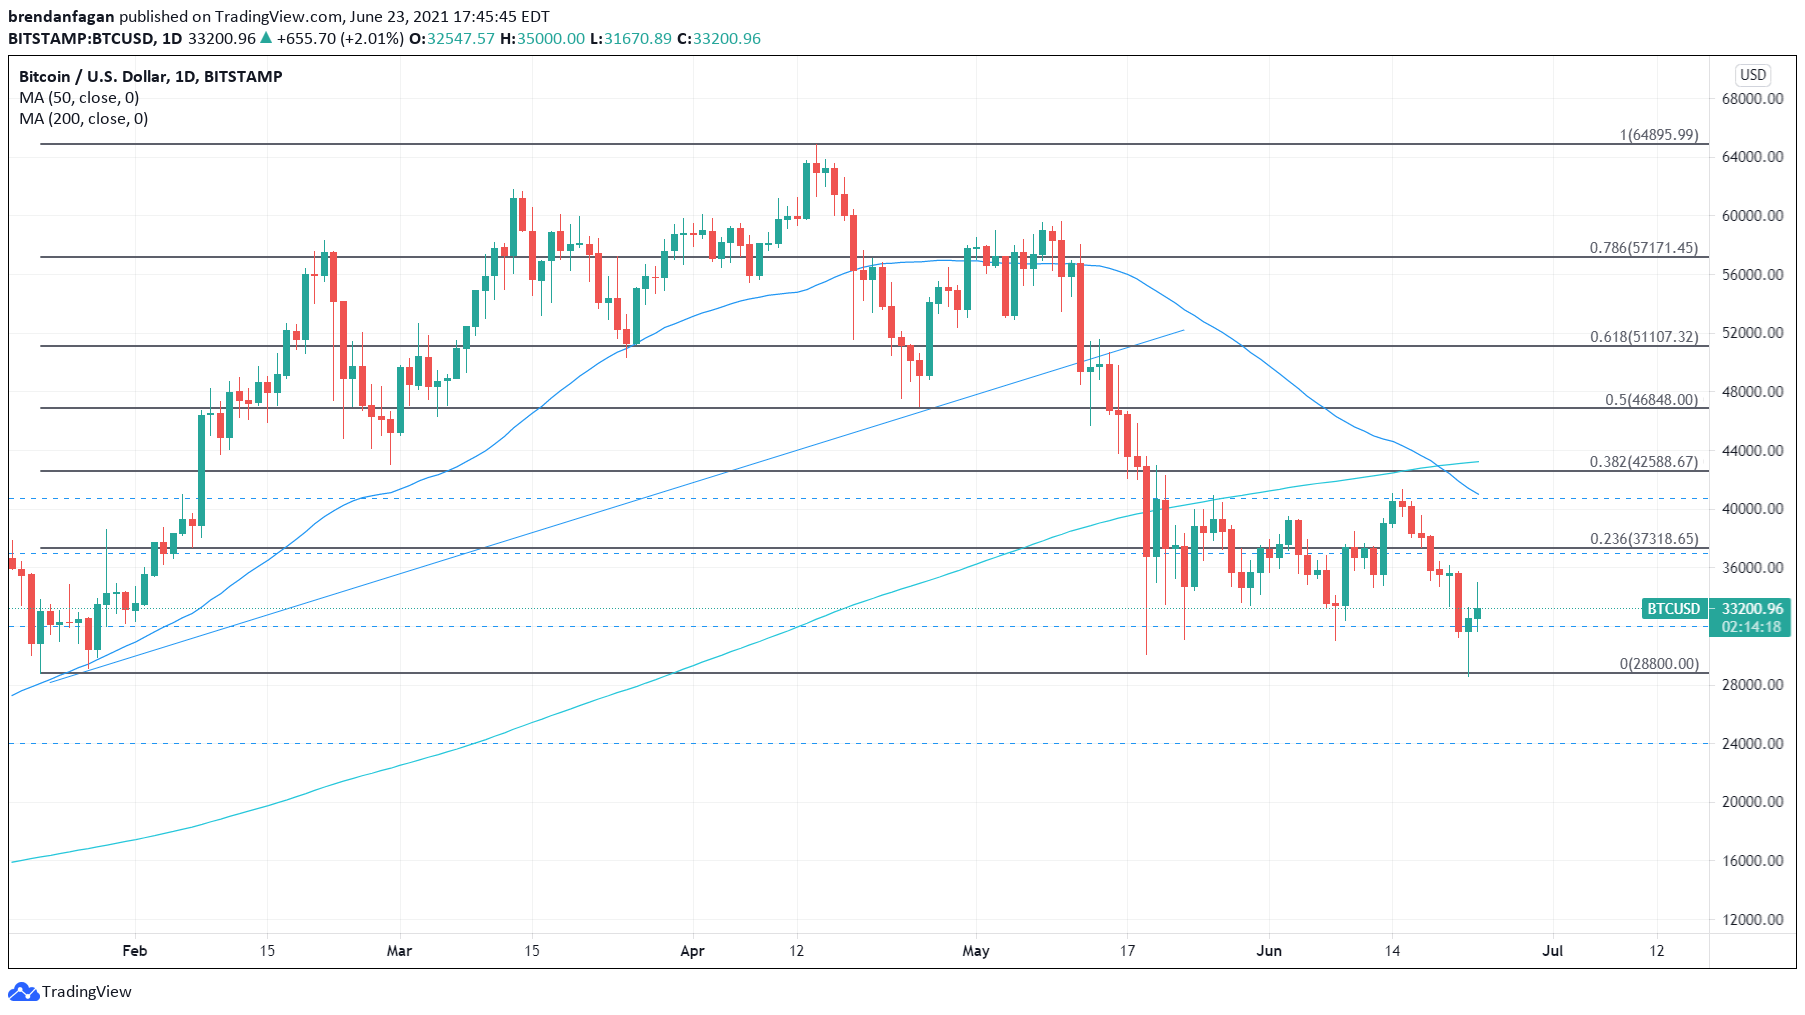
Bitcoin flashed a warning sign this past weekend following the formation of a “Death Cross.” The bearish technical signal forms when a shorter-term Simple Moving Average (SMA) falls below a longer-term SMA. Most frequently used are the 50-day SMA and the 200-day SMAs. Following the formation of the cross, Bitcoin proceeded to test the bottom of its recent range around 32,000. Further weakness developed, which saw Bitcoin test the yearly low around $28,800, but that move was quickly retraced.
Bitcoin (BTC/USD) Daily Chart
Chart created with TradingView
Bitcoin finds itself in a unique position in that both fundamental and technical indicators favor downside momentum. The continued risk from China and regulatory action from Washington coupled with bearish technical indicators point to continued weakness from Bitcoin. Despite the major headwinds for Bitcoin and the cryptocurrency space in general, the last month has seen a period of elongated consolidation. BTC/USD has found itself rangebound between $32,000 and $42,700 with midpoint resistance at the 0.236% Fibonacci level at $37,300.
Ethereum has struggled too in light of recent headwinds for the cryptocurrency space. Having shed more than half of its value in the last month, Ethereum finds itself on the back foot. However, prospects may be improving after ETH/USD halted its recent slide. Ethereum bounced after flirting with the 200-day SMA and May’s swing low. Should the bounce keep pace, a test of the 0.382 Fibonacci level (Jan. 1 to May swing high) at $2,118 may be on the cards. Further weakness could see a retest of the 200-day SMA or the 0.238 Fibonacci level below at $1,583.
Ethereum Daily Chart
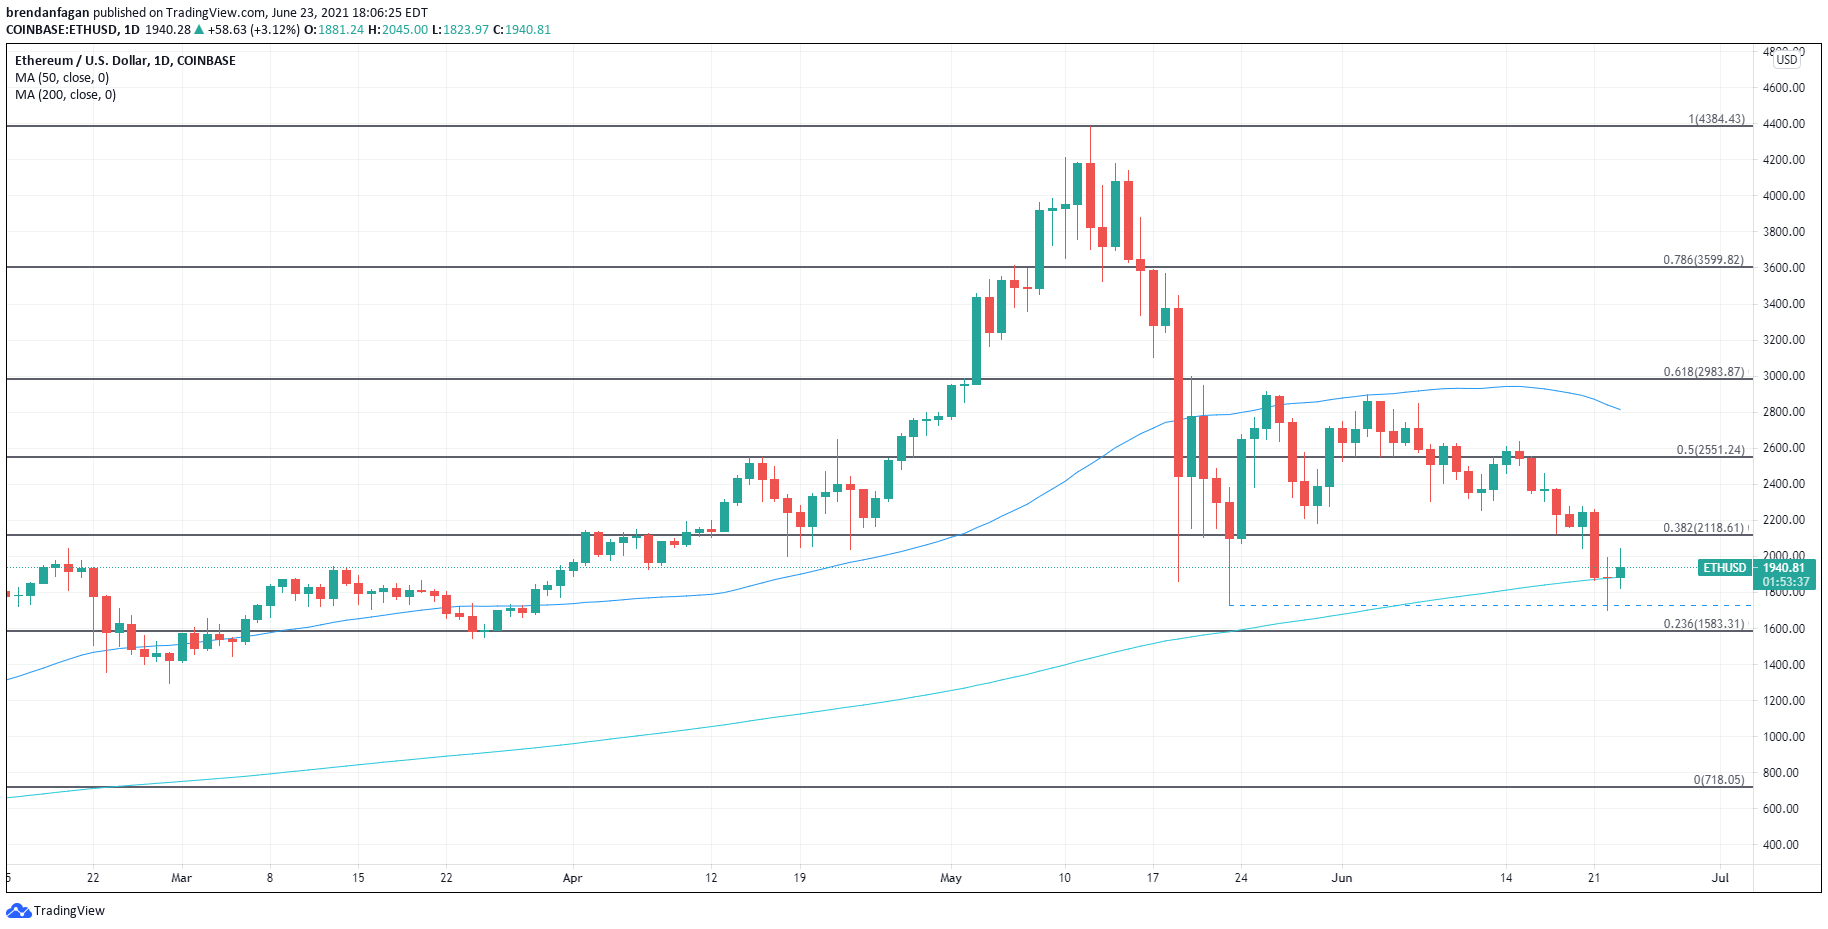
Chart created with TradingView
Dogecoin has also experienced significant pain of late, following a retest of the April swing-high in early June. That retest coincided with a test of a major downward trendline stemming from the May high around $0.70. While Dogecoin has been in a downward spiral ever since the infamous Saturday Night Live appearance from Elon Musk, this week’s bounce has taken Dogecoin out of “oversold” territory on the relative strength index (RSI). This may however prove to be a dead cat bounce, with the major descending trendline hovering just above. A break above the negative trend could see Dogecoin retest its 50-day SMA around $0.38. However Dogecoin has failed to break above the trendline following the May peak.
Dogecoin Daily Chart
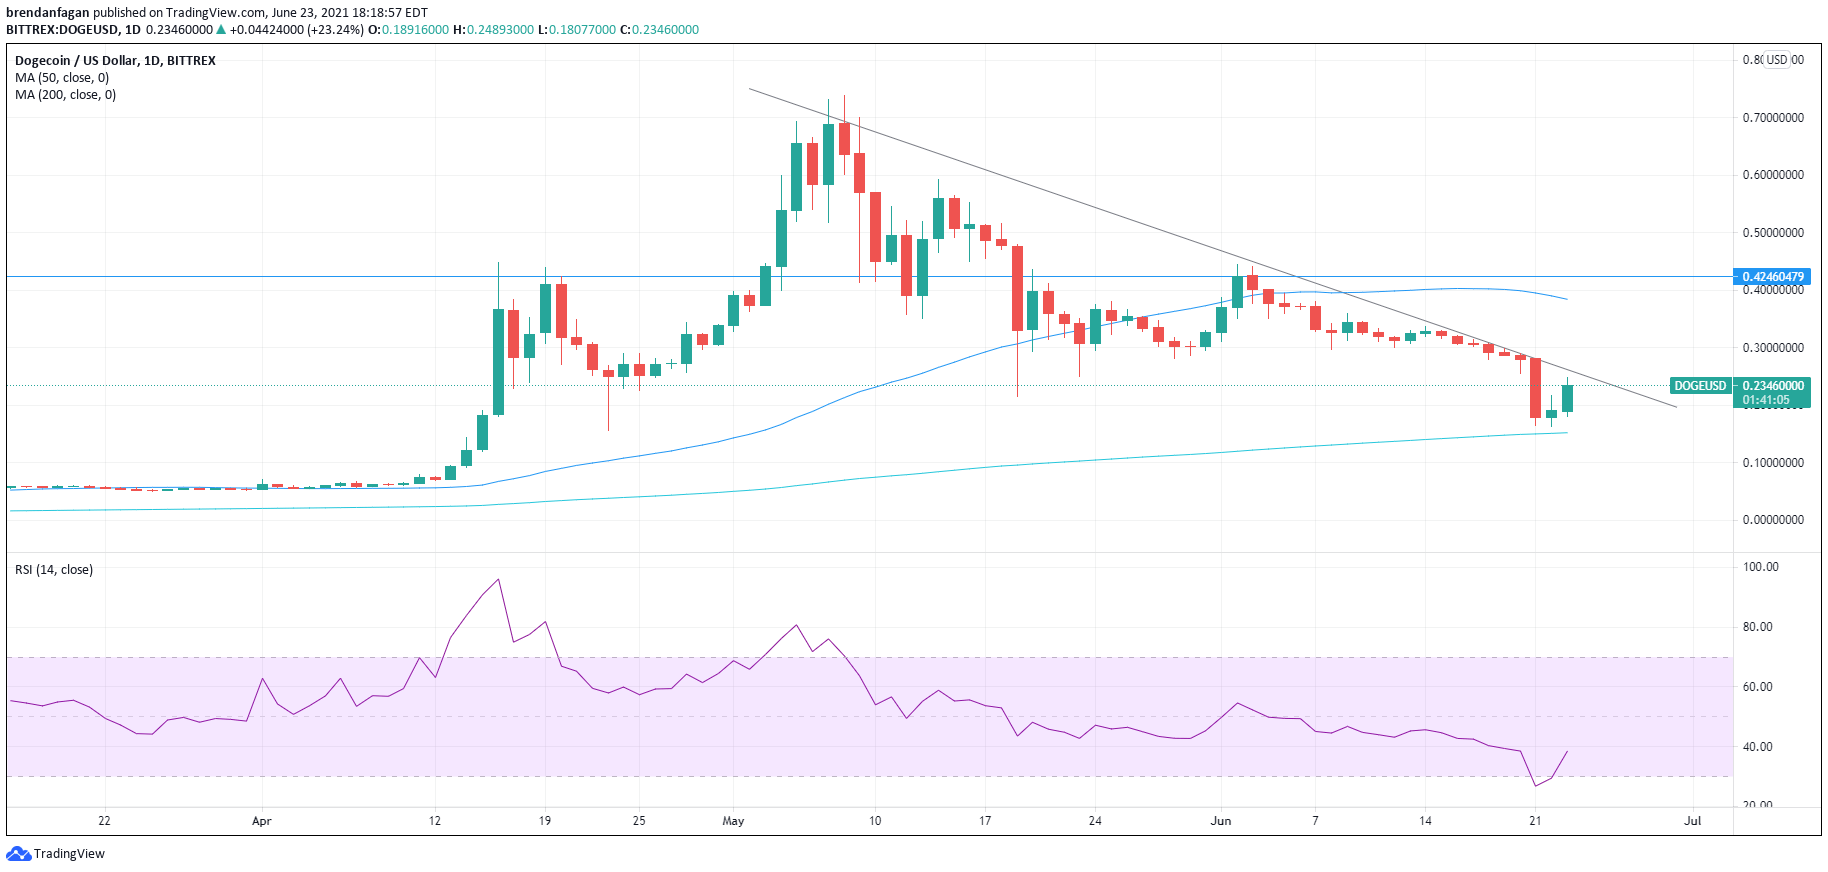
Chart created with TradingView
Weakness has enveloped the cryptocurrency space following last week’s Federal Open Markets Committee (FOMC) meeting. The surge in the US Dollar following the event helped push both Bitcoin and Ethereum through key technical levels. Bitcoin fell below $30,000 for the first time since January, and Ethereum remains less than half of what it was just one month ago. Traders should exercise caution when trading this volatile space, especially when many of the major names appear to be falling knives.
— Written by Brendan Fagan, Intern for DailyFX
To contact Brendan, use the comments section below or @BrendanFaganFX on Twitter
Be the first to comment