

STOCK MARKET ANALYSIS
- Equity indices under pressure across the board.
- BP PLC exits Russia, shares drop!
FUNDAMENTAL BACKDROP
Despite opening in the red, European equity indices including the DAX and FTSE have generated some bids this morning after a news release stating that “Russia is willing to negotiate with Ukraine as soon as possible”. The statement comes as a result of the West increasing sanctions on Russia including a massive decision by BP PLC pulling out of Russia via its stake in Rosneft at an estimated cost equivalent to $25bn – BP shares tanked almost 7% at the open.
With value stocks been the darlings of the European stock markets of recent (due to rising inflationary pressure), the longer the war in Ukraine persists, the more we may say a rotation into defensive stocks. These stocks generally show historical durability against tough economic conditions, making them more attractive in uncertain circumstances.
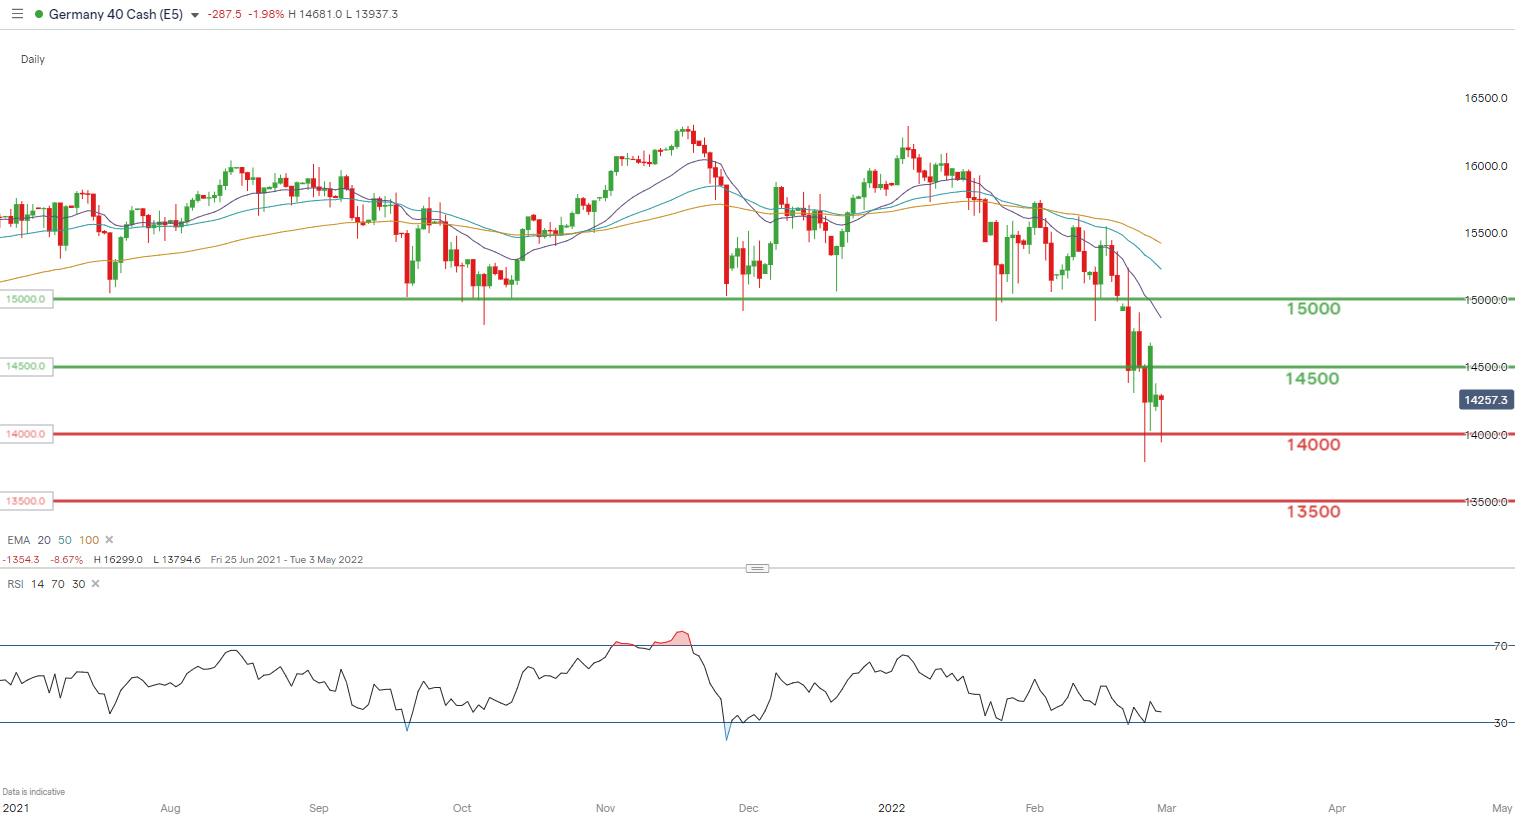
DAX DAILY CHART
Chart prepared by Warren Venketas, IG
Resistance levels:
- 15000
- 20-day EMA (purple)
- 14500
Support levels:
FTSE 100 DAILY CHART
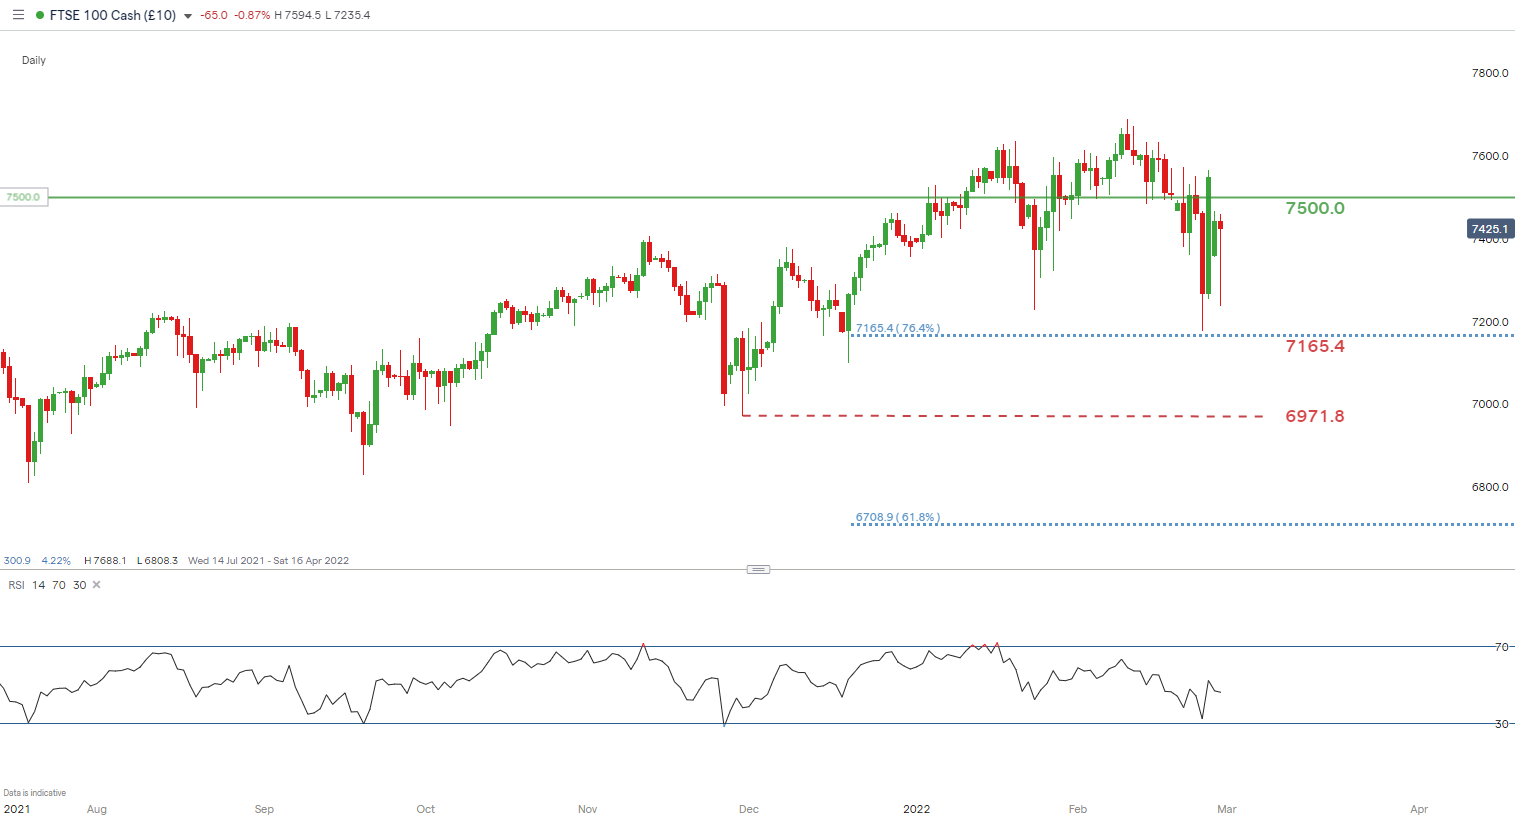
Chart prepared by Warren Venketas, IG
Resistance levels:
Support levels:
Boost your stock market knowledge with our articles on the types of stocks available, how equities impact the economy, and getting started with stock trading.
The S&P 500 index is slightly more positive than the European indices as geography play an important role in insulating many U.S. stocks from the influence of the war in Europe. From a stock perspective, investors have been in favor of U.S. stocks however, with more flow moving into U.S. Treasuries and the dollar, global stocks are coming under pressure.
The threat of greater inflation due to rising oil prices (lesser supply) traditionally weighs heavily on the tech heavy SPX as the threat of hawkish pressure (rising interest rates) from the Fed increases – negatively impacting tech stock valuations.
SPX DAILY CHART
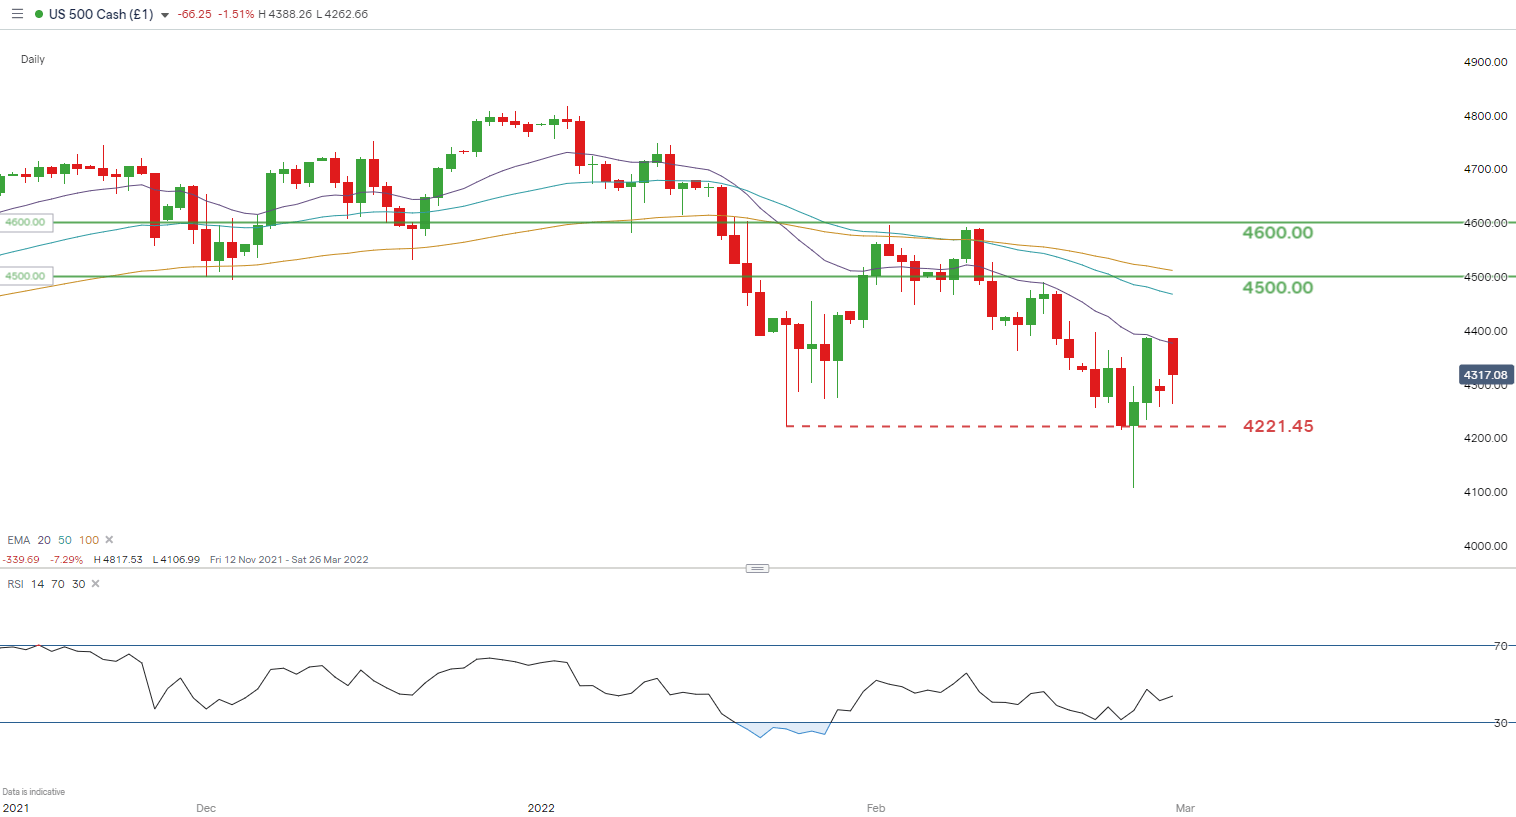
Chart prepared by Warren Venketas, IG
Resistance levels:
Support levels:
Contact and follow Warren on Twitter: @WVenketas
Be the first to comment