

gremlin
Around one year ago, I started working as a software development intern at a company. Now I am a full-time employee and still often find myself overwhelmed by the complexity of IT infrastructures. Different hardware devices, on-premise software, cloud software, containers, continuous integration and delivery. A lot of complexity that needs to be understood and maintained.
Datadog, Inc. (NASDAQ:DDOG) has been a highflier since its IPO in late 2019 and has been a poster child for a Software as a Service ((SaaS)) company. Since its IPO, Datadog comfortably beat the Nasdaq 100 (107% versus 43%) and all other indexes. In this article, I’ll run DDOG through my SaaS framework and compare them with other prominent SaaS businesses:
- Veeva Systems (VEEV)
- Twilio Inc (TWLO)
- ServiceNow (NOW)
- CrowdStrike Holdings (CRWD)
- Cloudflare (NET)
- Snowflake (SNOW)
- Salesforce (CRM)
- Dynatrace (DT)
I will address the following points:
- S&M spend and the magic number
- Profitability and stock-based compensation (“SBC”)
- Rule of 40
- Valuation.
Datadog solves complexity
The mission of Datadog is to solve complexity in enterprise infrastructures. To achieve this, Datadog addresses many pain points for system admins and developers through one unified platform used by everybody. This platform aims to unify the data from all enterprise applications and helps to monitor and administer them. Gartner (IT) estimates the IT operations market to be worth around $62 billion in 2026 and sees Datadog as a leader in its June 2022 Magic Quadrant for Application Performance Monitoring and Observability, tied with Dynatrace for the best positioning.
DDOG History of innovation (Datadog Investor Presentation)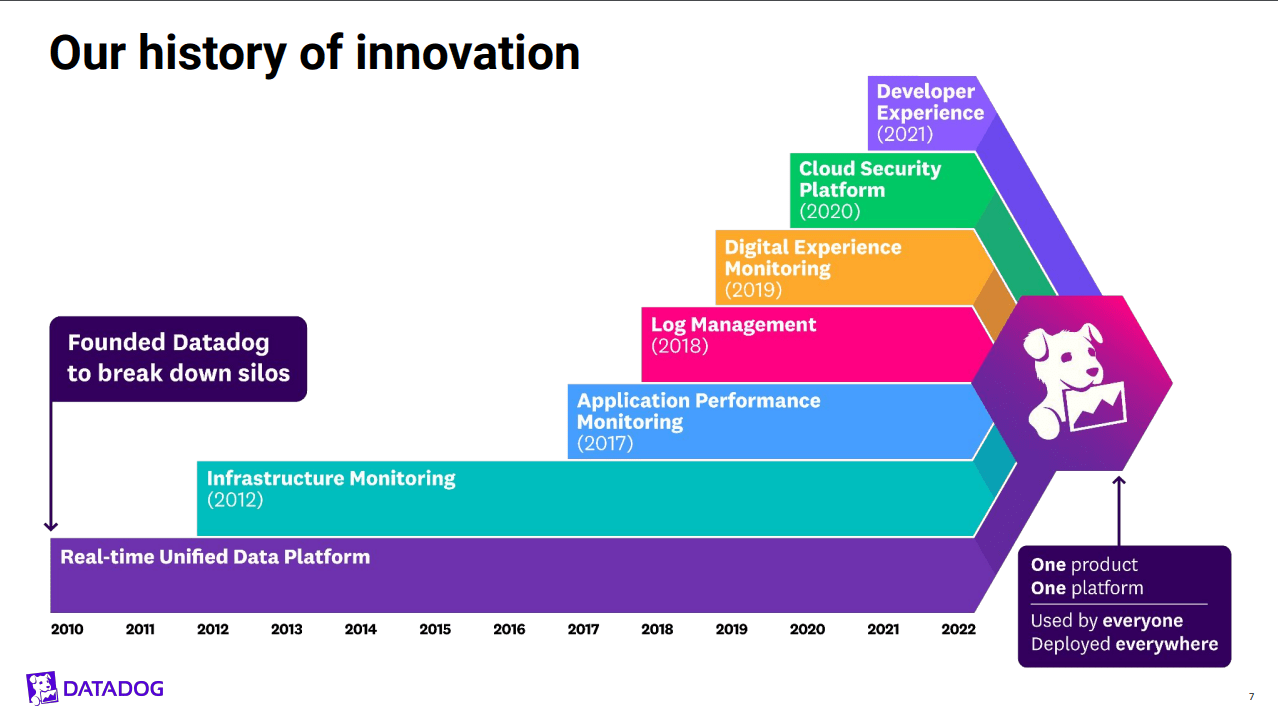
S&M spend and the magic number
An excellent way to measure the effectiveness of marketing spending is the Magic number; below is the definition from “The SaaS CFO“:
The SaaS Magic Number is a widely used formula to measure sales efficiency. It measures the output of a year’s worth of revenue growth for every dollar spent on sales and marketing. To think of it another way, for every dollar in S&M spend, how many dollars of ARR do you create.
I calculated this by dividing the incremental 12-month revenue increase by the last 12 months’ selling and marketing spend. You want to have a relatively high number. Anything below 0.75 should be a yellow flag to consider if the marketing spending is worth the cost.
We can see that DDOG is the best in class, with an outstanding Magic number of 2.63. Most of the companies in this comparison show healthy numbers above 1.0. Still, there are some yellow flags here as well: Dynatrace has a significantly lower Magic Number than DDOG but is still just 0.04 away from the 0.75 threshold. ServiceNow and especially Salesforce, on the other hand, should consider adjusting their marketing strategy to account for higher returns on their S&M investment.
Magic Number SaaS comparison (Authors model in Koyfin)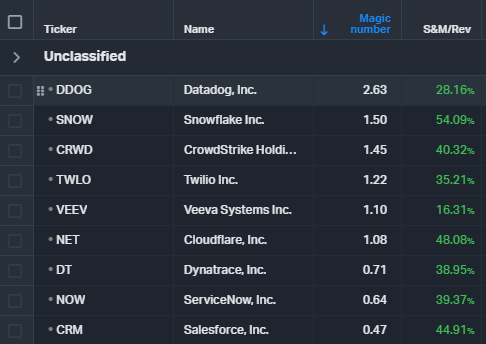
Profitability
Most SaaS companies are purely focused on growth and not so much on profitability. Especially in this market environment, investors are looking for profits, though. Most SaaS companies aren’t very profitable because of the high S&M spending we discussed. Let’s take a look at how the different companies compare for profitability.
We can see that there is a wide range of outcomes regarding the profitability of our nine companies. If we look at free cash flow (“FCF”) margins, almost all companies are generating Free cash flows or at least close. Unfortunately, all SaaS companies are heavy diluters, giving out a lot of stock-based compensation to employees. Although these aren’t cash expenses, I still exclude them from FCF. Dilution is an actual cost for shareholders and can’t be ignored! If we adjust for SBC, we can see that only Veeva and Dynatrace have double-digit margins, compared to seven companies on the normal FCF margin. Datadog’s FCF margin has decreased from 25% to 5%, so the company is still profitable. The most notable example is Cloudflare, with 40% SBC/revenue going from +20% to -20% FCF margins.
Other important profitability metrics are Return on Invested Capital and Return on Equity. These metrics are calculated using Earnings instead of Cashflows. As a rule of thumb, you want to have ROIC be at least 2% higher than the cost of capital for the company. We can see that all companies besides Veeva struggle with Return on Capital due to the lack of GAAP profitability. Datadog has a slightly negative Return on Capital.
Profitability comparison (Authors model in Koyfin)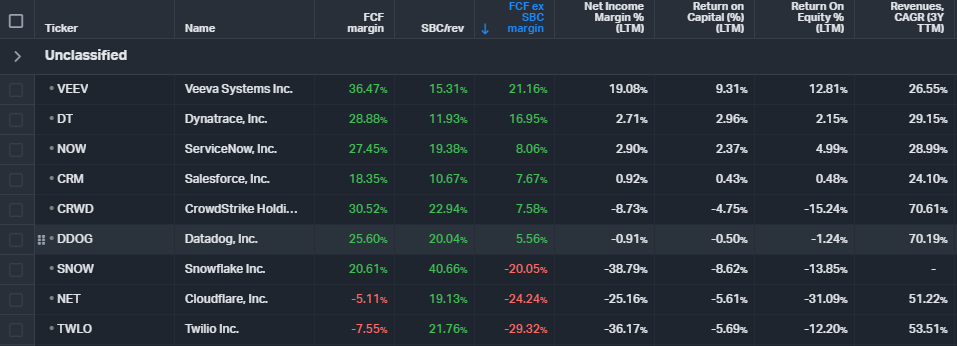
The rule of 40
The rule of 40 is an approximation used to measure the healthiness of the growth of SaaS companies. The goal is to achieve at least a number 40. It’s calculated by adding the revenue growth rate to a company’s profit margins. There are a lot of variations of the rule of 40 because you can use different timeframes for revenue growth or use profit growth instead and you can use different margins. I use the 3-year revenue CAGR and the FCF margin, excluding SBC, for the reasons discussed earlier.
We can again see that Datadog is best of class in this metric at a fantastic 75, driven mainly by revenue growth. The same picture can be observed with CrowdStrike, where most of its 78 result comes from revenue growth. Because Snowflake hasn’t been public for three years, Koyfin didn’t show a 3y CAGR and I had to calculate the rule of 40 by hand: Snowflake comes out top of the class at 105, mainly driven by a 132% revenue CAGR.
We can also observe that several companies did not do well, scoring under 40. This should be a yellow flag for ServiceNow (37), Salesforce (31), Cloudflare (27) and Twilio (24).
Rule of 40 comparison (Authors model in Koyfin)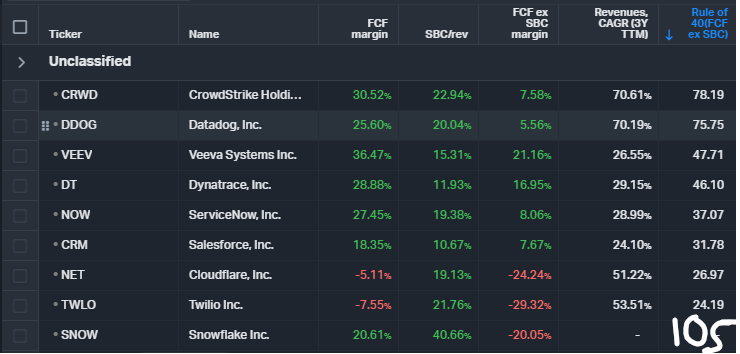
Datadog isn’t cheap
SaaS has been one of the most expensive industries for a while now, with some companies valued over 100 times sales during the peak of the 2021 mania. We can see that all companies in this peer group are at least 37% below their ATH, with Twilio beaten down the most at 82%. Datadog also has taken a beating, down 58%, but is still richly valued at 19.6 times EV/Gross profit and 66 times EV/EBITDA. Usually, my preferred metric to value companies is the EV/FCF yield. This gets rather difficult, though, after you adjust all of these companies for SBC. At an FCF yield of 0.36%, there is little excitement over Datadog.
Valuation comparison (Authors model in Koyfin)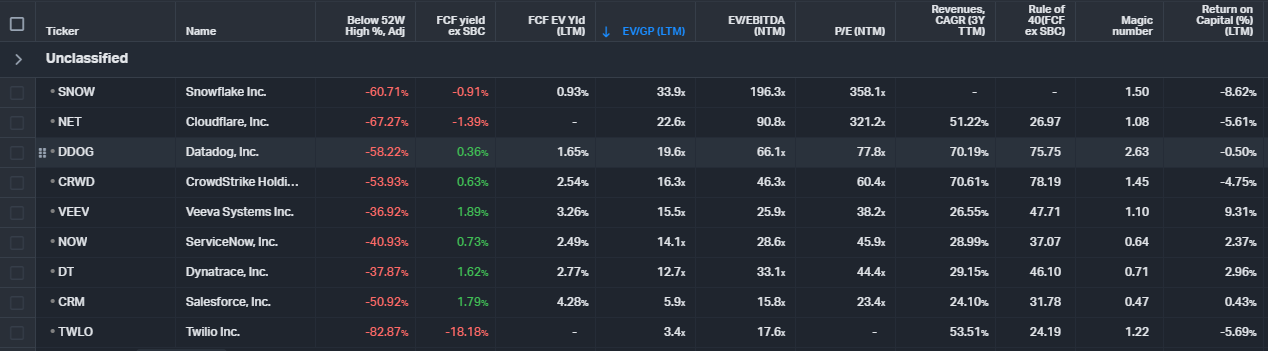
Another way to value Datadog is an inverse DCF analysis. I will use the FCF numbers without excluding SBC because my model also accounts for the dilution. The multiple at which the company trades is very important for diluting companies because a high multiple translates SBC into lower dilution. With multiples falling, I expect a higher dilution from DDOG and I’ll use a 5% annual dilution compared to a three-year average of around 3.5%. My model uses a 10% discount rate, representing my required rate of return and a perpetual growth rate of 3%. Using these values, the company would be required to grow its FCF by 30% for the next five years, followed by 24% for the following five years, to achieve a 10% total return CAGR.
DDOG inverse DCF (Authors model)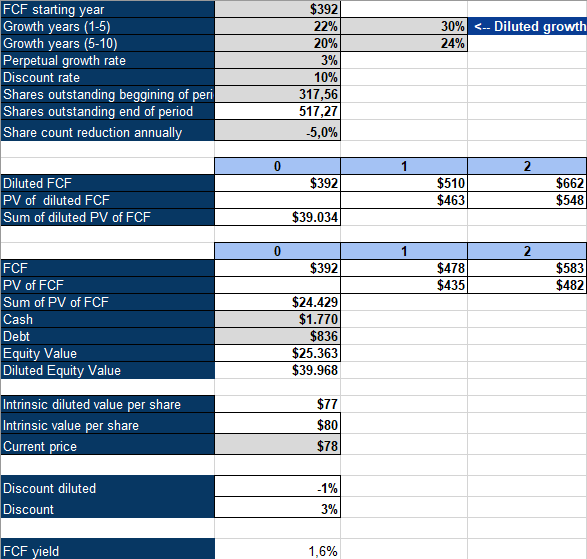
Datadog is a cautious buy
Datadog is a best-in-class SaaS company with rapid growth (70% 3-year CAGR), which appears to be well-run (2.6 magic number) and is still founder-led (7.5% ownership). I rate it a cautious buy because the stock relied on a continued strong execution. The company is addressing a large and rapidly growing market, which is a pain point for most companies. If dilution comes in lower than expected, the required growth rate could drop significantly into the lower 20s. Datadog isn’t a stock I’d put as a top holding (and I wouldn’t expect a 10-bagger at this valuation), but I could see it as a smaller, speculative position in a well-diversified portfolio.
Be the first to comment