

AntonioSolano/iStock via Getty Images
DISCLAIMER: This note is intended for US recipients only and, in particular, is not directed at, nor intended to be relied upon by any UK recipients. Any information or analysis in this note is not an offer to sell or the solicitation of an offer to buy any securities. Nothing in this note is intended to be investment advice and nor should it be relied upon to make investment decisions. Cestrian Capital Research, Inc., its employees, agents or affiliates, including the author of this note, or related persons, may have a position in any stocks, security, or financial instrument referenced in this note. Any opinions, analyses, or probabilities expressed in this note are those of the author as of the note’s date of publication and are subject to change without notice. Companies referenced in this note or their employees or affiliates may be customers of Cestrian Capital Research, Inc. Cestrian Capital Research, Inc. values both its independence and transparency and does not believe that this presents a material potential conflict of interest or impacts the content of its research or publications.
Voodoo Nonsense – Ignore!
Technical analysis is like democracy. It’s the worst tool anyone can think of for the job, except for all the other tools that anyone has yet thought of. Let’s take the Nasdaq-100 index, in its QQQ ETF format. If you could construct any coherent narrative as to why the ETF fell to the level it did in the COVID crisis, ran up to the level it did in 2021, and then corrected to the level it has in 2022, we’re all ears. We don’t mean “why did it sell off hard into COVID” or “why did it turn weak come 2022?” We mean, why did it find support and resistance at those specific levels?
If you use fairly standard Elliott Wave and Fibonacci measures, the QQQ confirms almost perfectly to textbook levels since the 2018 lows. And because the pattern fits so well, in the larger and smaller degree, one has to ask oneself… are the Doom-Mongers of Fin Twit really correct that it’s all going to zero?
Let’s first of all take a look at the move from the Q4 2018 lows to the Q4 2021 highs. (You can open a full-page version of this chart here.)
QQQ Chart (TrendSpider, Cestrian Analysis)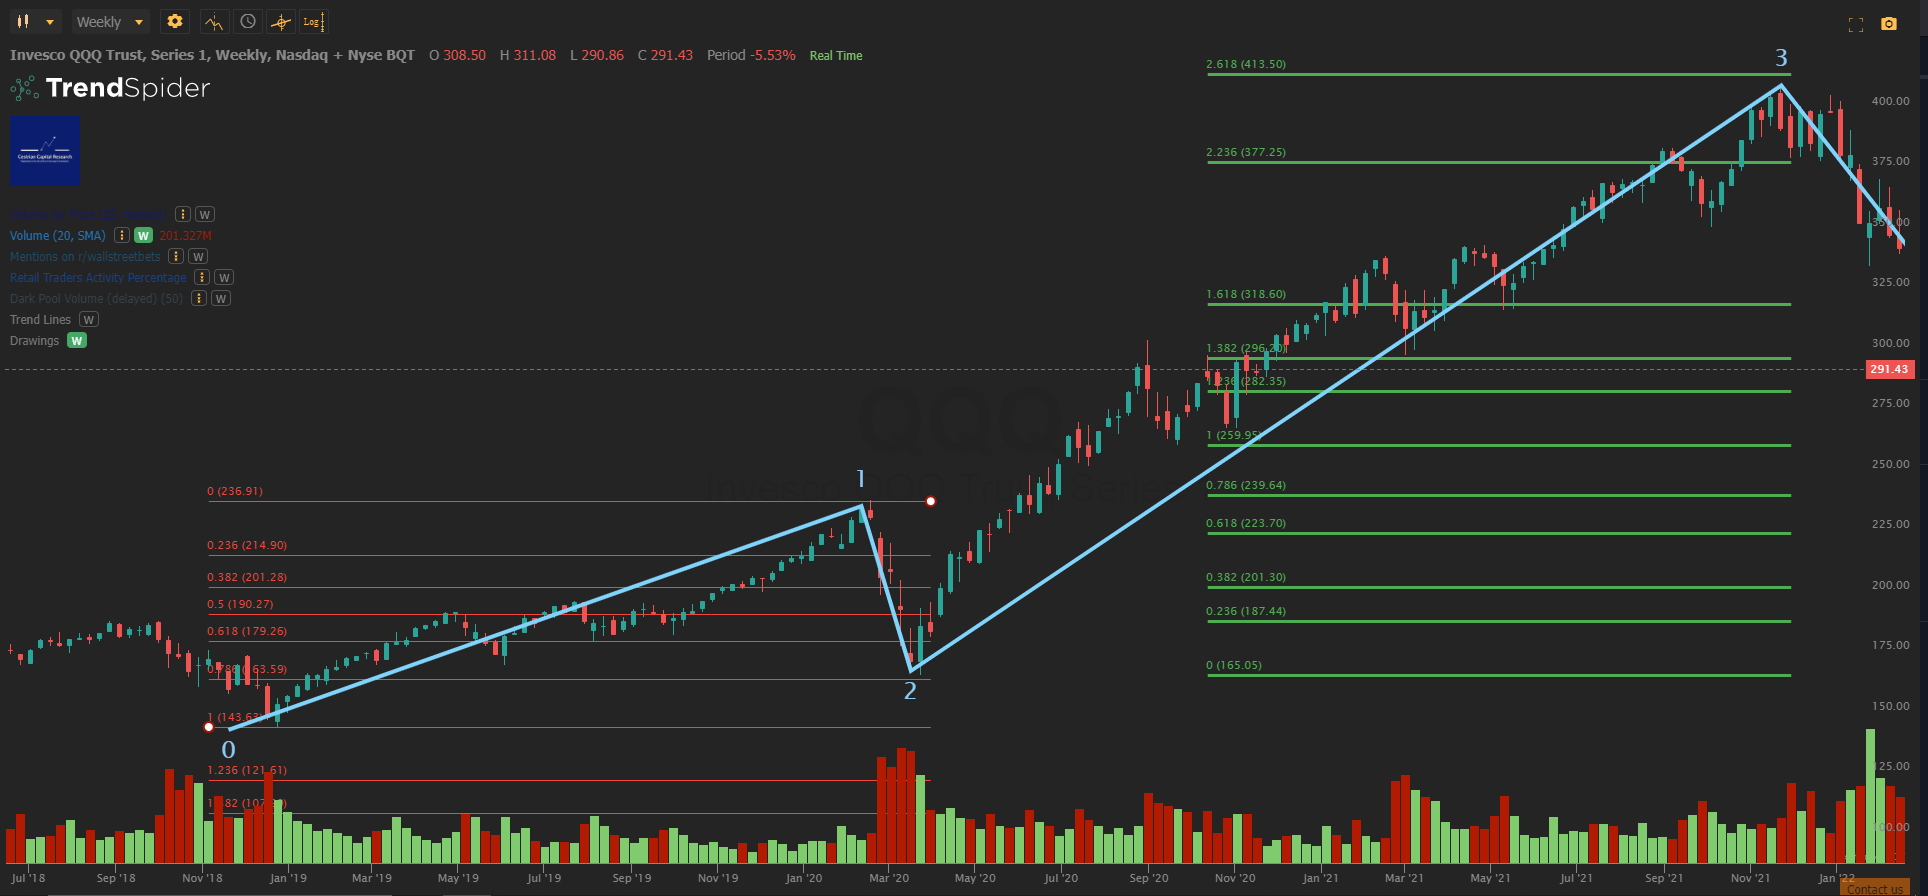
The first thing to note is the start point. Right at the end of Q4 2018 the Fed had tried to normalize monetary policy by raising rates and planning to shrink, not grow, the size of its balance sheet. This caused a market tantrum such that most all of 2018’s gains in the S&P or the Nasdaq were wiped out. The bottom came in right at the end of the year. We can call that Point Zero.
QQQ then rose in a Wave 1 up, peaking at around $237 in February 2020, a fairly quick gain of 65% in the prior fourteen months or so. The chat at the time was that this was nuts and couldn’t last.
Yikes, Freak Out!!
Now a very interesting thing happens. COVID hits and naturally enough the world freaks out as do investors. Rather surprisingly however, it turns out one can model a “yikes freak out” reaction in the market. “Yikes freak out” usually means a Wave 2 down, a fast and deep drop. And very often a Wave 2 down finds support at the 61.8% or 78.6% retracement of the prior Wave 1 up. The Covid lows in the QQQ were precisely a 78.6% drop from the Wave 1 highs back towards Point Zero. Likely not a coincidence.
Now The Long Road To Happiness
After a “Yikes Freak Out” Wave 2 comes a Wave 3 which are typically powerful upward moves. Which is what happens to the Qs coming out of COVID. You know all the reasons why it is said this happens – Fed helicopter money, crypto bros, work from home tech refresh cycle, all that – but put that aside for a moment because, really, who cares why it happened. Let’s measure what happened. The chart above shows this (again, full page version here). Wave 3s typically terminate at a minimum of the 100% extension of the prior Wave 1, and more commonly the 161.8% extension. More bullish levels are the 261.8%, 361.8%, and so on. (By the way, if Fibonacci extensions are new to you, fear not. Whilst the theory behind why Fibonacci numbers matter is complicated, the math involved in calculating how they apply to stock prices is not. The 161.8% extension of Wave 1 is calculated thus: take the stock price movement in Wave 1, multiply it by 1.618, and add that to the stock price at the Wave 2 low, hey presto, that’s the 161.8% extension of Wave 1). Anyway. You can see that at the most recent all-time high, QQQ hit the 261.8% (=2.618) extension of Wave 1 almost to the dollar. Again, probably not a coincidence.
Then Comes Boiling The Frog
2022 comes and here we go with a Wave 4 down. Psychologically, emotionally, and potentially financially, Wave 4s are tough. Most people have become accustomed to the occasional shock and awe flash crash Wave 2. The panic is over as soon as it began. Also due to the mass psychology involved, which usually translates as someone has to do something, very often, someone does in fact do something – COVID stimulus being a prime example. But in a slow-boil Wave 4, the panic never really rises. Instead it’s a stages-of-grief thing where if you’re not careful you end up accepting and moving on. Which means you toss your account overboard and start a new day. Except you don’t, because that’s usually when the market rebounds and then you are too stunned to do anything about it, fearful that you will just buy into the next leg down. Actually the first half of 2022 saw Big Money do a fine job of work in this regard. If you look at how one measure of volatility, the Vix index, has moved vs. the panics of 2020 and indeed the Fed-tightening fear in 2018, it has barely moved at all – just traded sideways in a channel. (Full page version here).
Vix Chart (TradingView, Cestrian “Analysis”)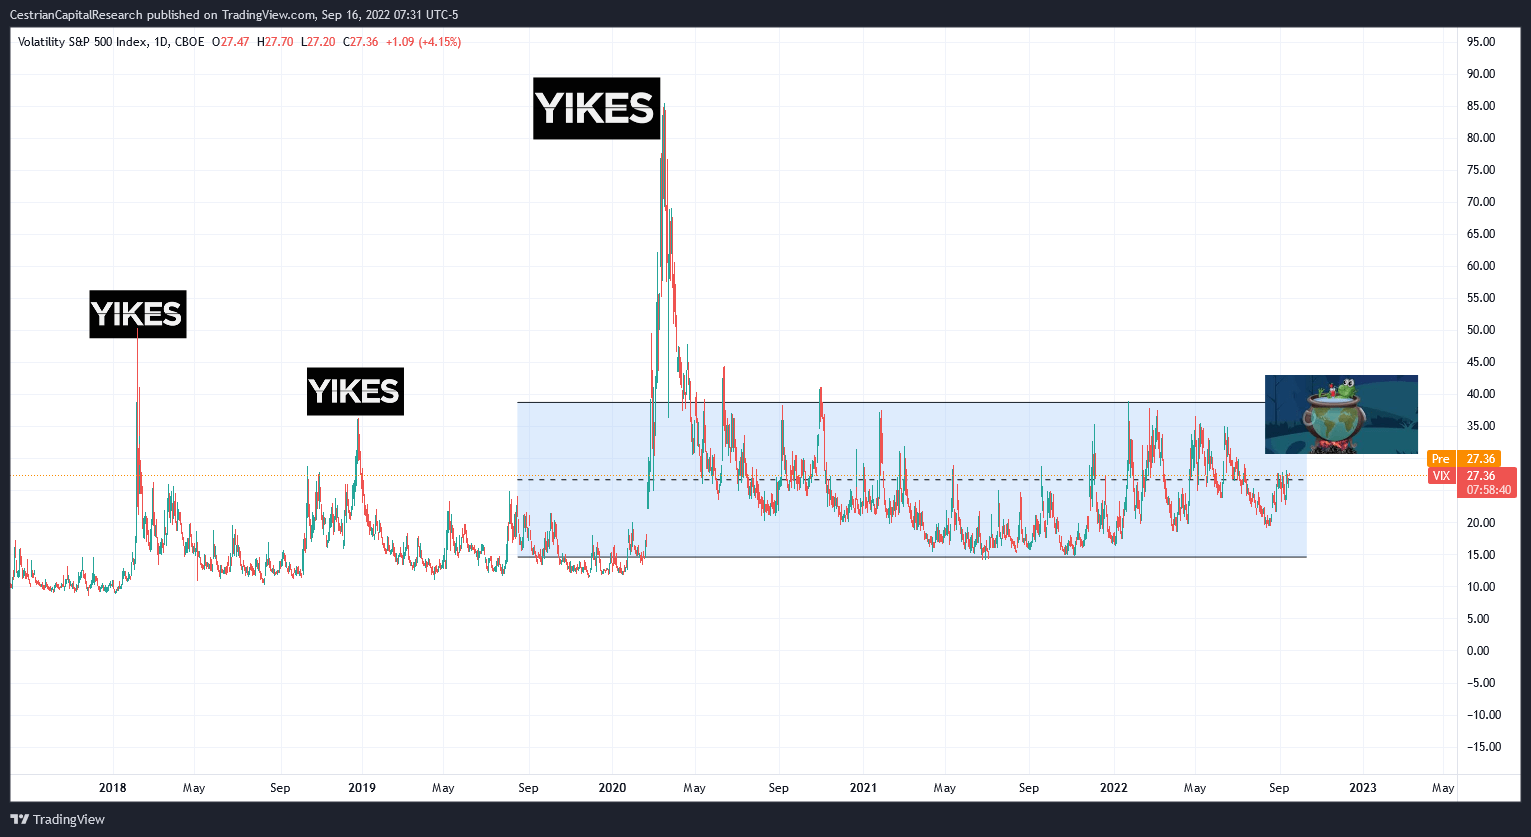
There are many reasons for this but chief amongst them has been the institutional use of out-of-the-money index puts that have been rolled out and down through the first half, slow and steady, no freaking out, just dragging down the indices and their proxy ETFs as market makers have had to sell those indices in order to hedge their positions (having sold puts to institutions, market makers are then long the market, so have to sell underlying securities in order to get back to neutral).
And this wave 4 right here is what has caused the it’s-all-over mentality to take hold, in our view. Full page chart here.
QQQ Chart (TrendSpider, Cestrian Analysis)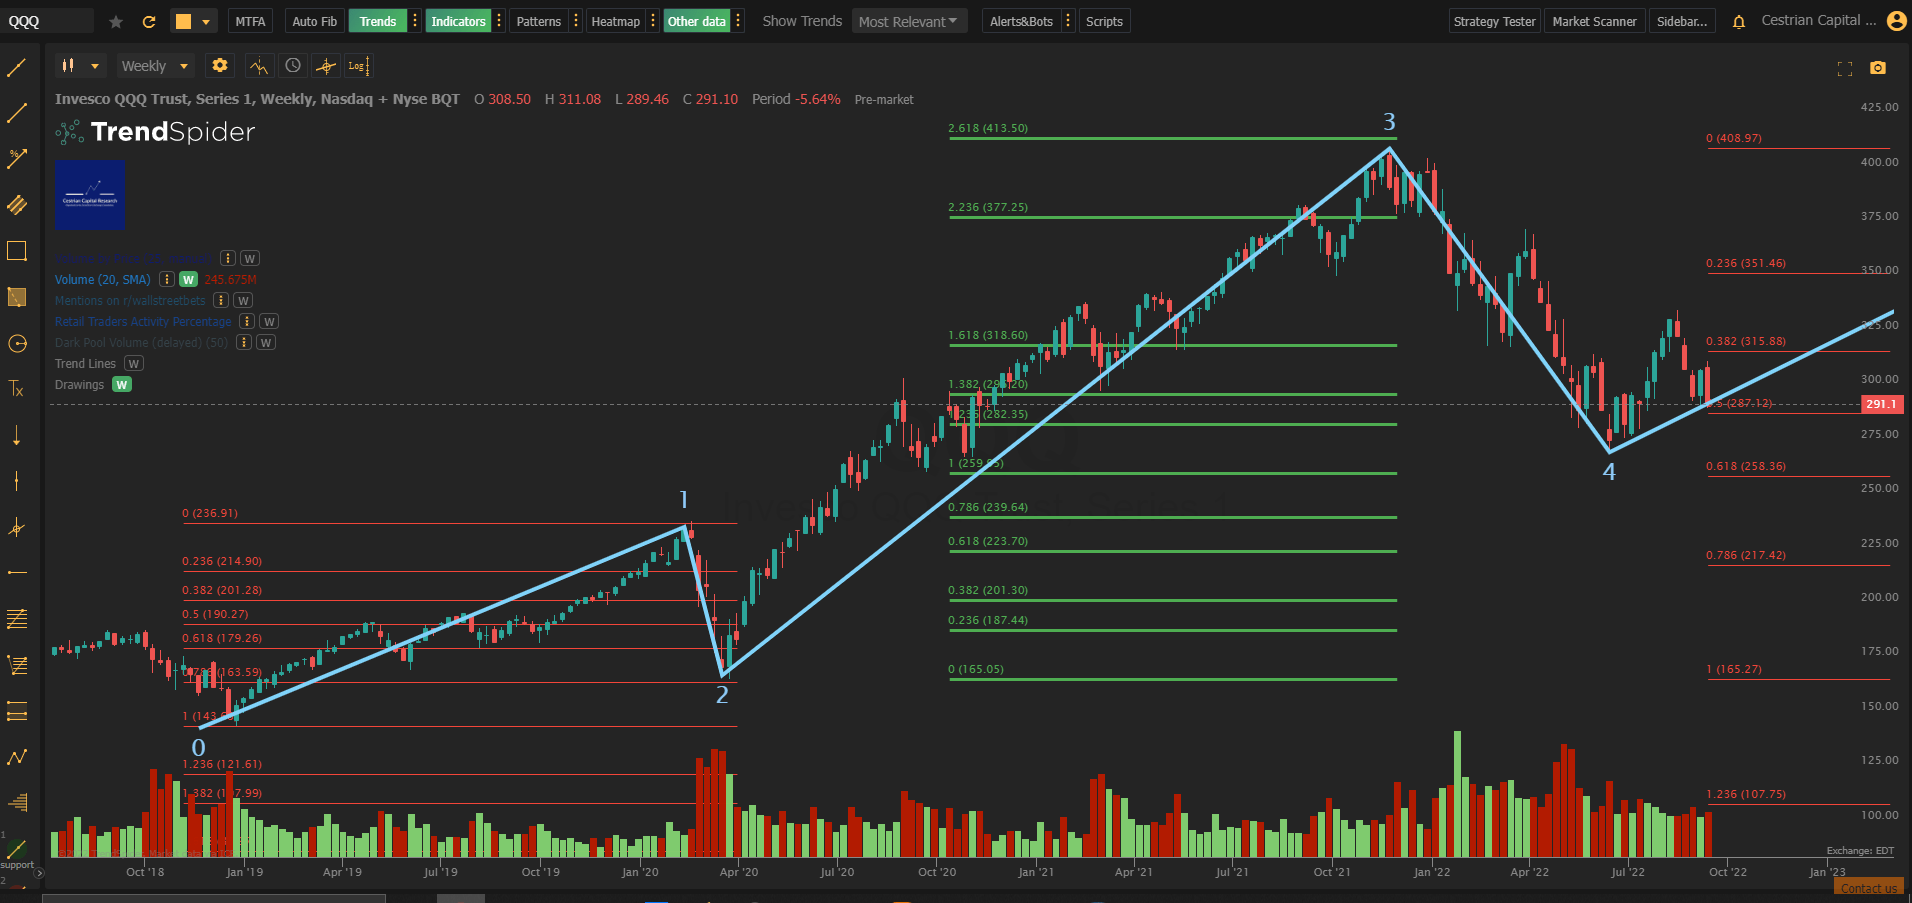
It’s been a deeper-than-expected correction for sure. With a 78.6% retraced Wave 2 you might normally expect a 38.2% retraced Wave 4 – that’s based on nothing other than pattern recognition. The 38.2% retracement of Wave 3 was $315, which is where the QQQ set up camp for a while in February this year, before head-faking to the upside then digging for victory once more. Thus far the Wave 4 looks to have bottomed in June, between the 50% and 61.8% retracements of Wave 3.
Wait, Isn’t This A Bullish Article?
So, the title of this article is, “Dare To Dream”. Looks more like a nightmare for 2022. Or does it? Let’s zoom in to see what has happened since those June lows. Full page version, here.
QQQ Chart (TrendSpider, Cestrian Analysis)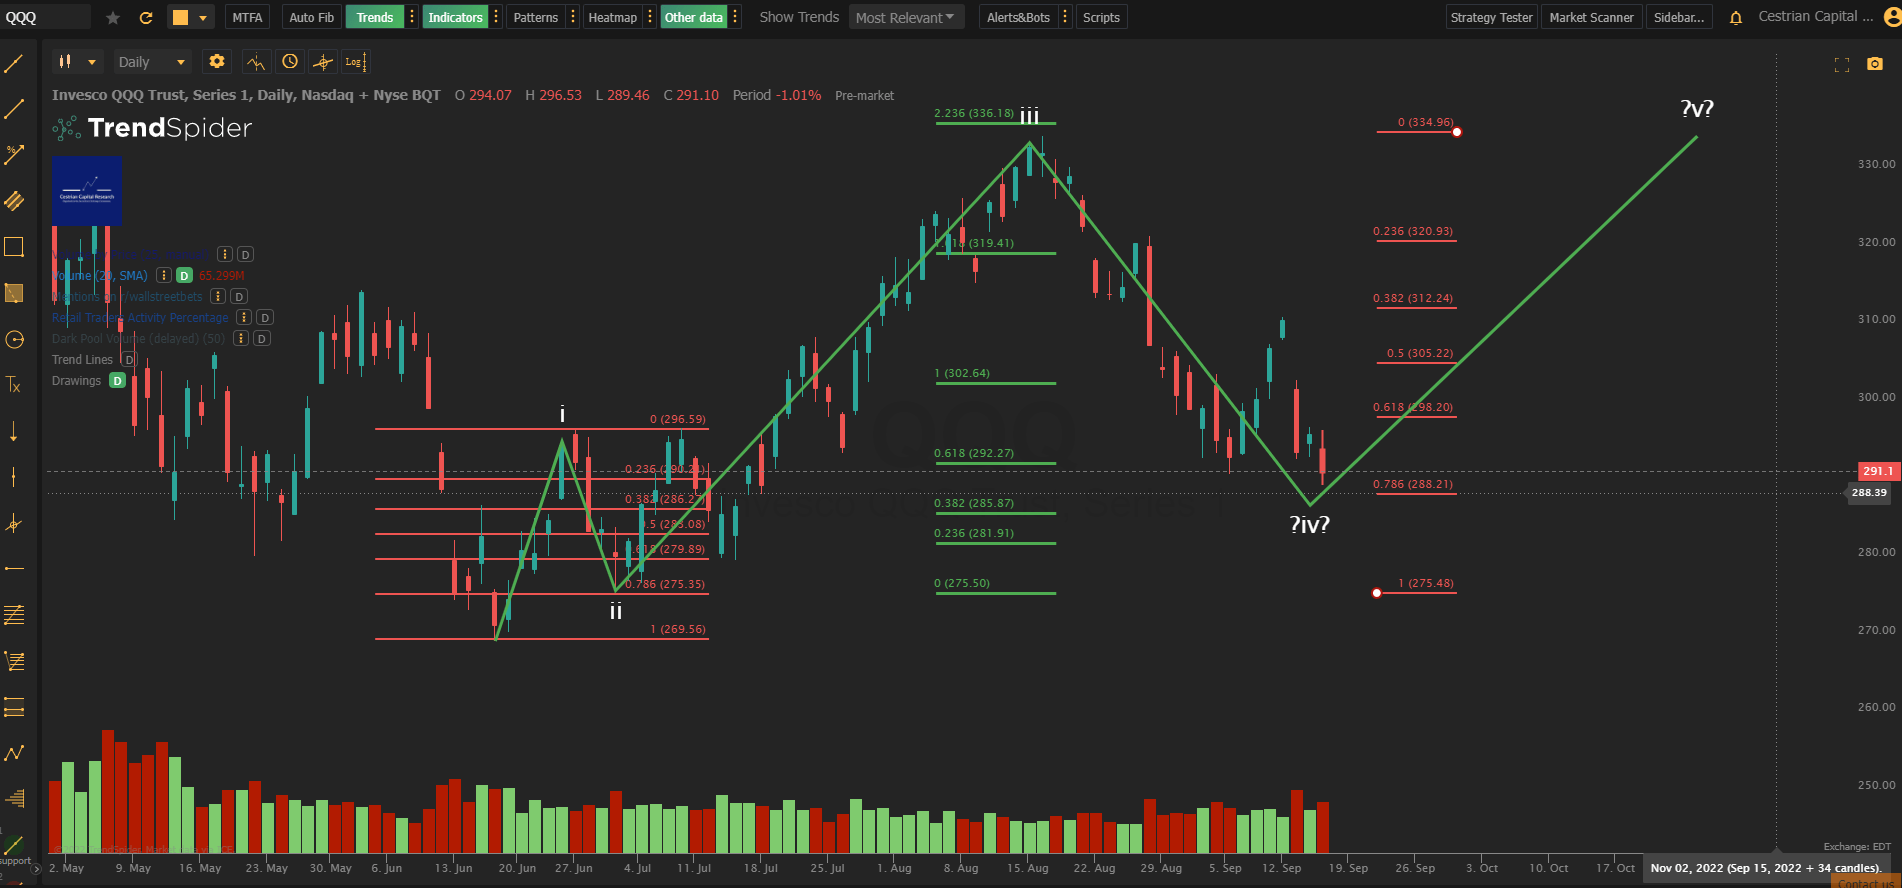
The waves & Fibonacci approach works in smaller and larger degrees. One cannot say that it’s truly fractal in nature, as is often claimed, since there’s no perfectly-repeating pattern in smaller and smaller degrees, but we can say that because the extensions and retracements are merely emotional and/or algorithmic reactions to the most recent price movements, they are self-referential in nature and that is why they scale up and down – because a larger degree move is relative to an earlier larger degree move, and a smaller degree move is relative to an earlier smaller degree move.
Look at the 5-waves up from the June lows. The Fib levels work nicely – a 78.6% retrace Wave ii, a 223.6% Wave iii extension of Wave i, and we’ll see what happens with September options expiry (that’s today at the time of writing) does to the Wave iv. But so far there is every chance we then get a smaller degree Wave v up (once September opex is done, a wall of puts will expire and market-maker short hedges will need to be covered, which can drive a move upwards).
And if that Wave v happens, and for it to be a Wave v it must peak above the Wave iii high – then that’s ongoing confirmation that the June lows were the lows. We aren’t there yet. We need to see that Wave v exceed QQQ $335ish. But if we do? Well, if that Wave v does arrive, the bear argument – that we’re in a downwards channel that started last November and has featured only countertrend rallies since then – starts to look a lot weaker. Not necessarily wrong, anything can change, but weaker.
Then the outlook can be like … this. A final flourish in the larger degree to complete a 5-wave cycle up off of those 2018 lows.
Full page chart here.
QQQ Chart (TrendSpider, Cestrian Analysis)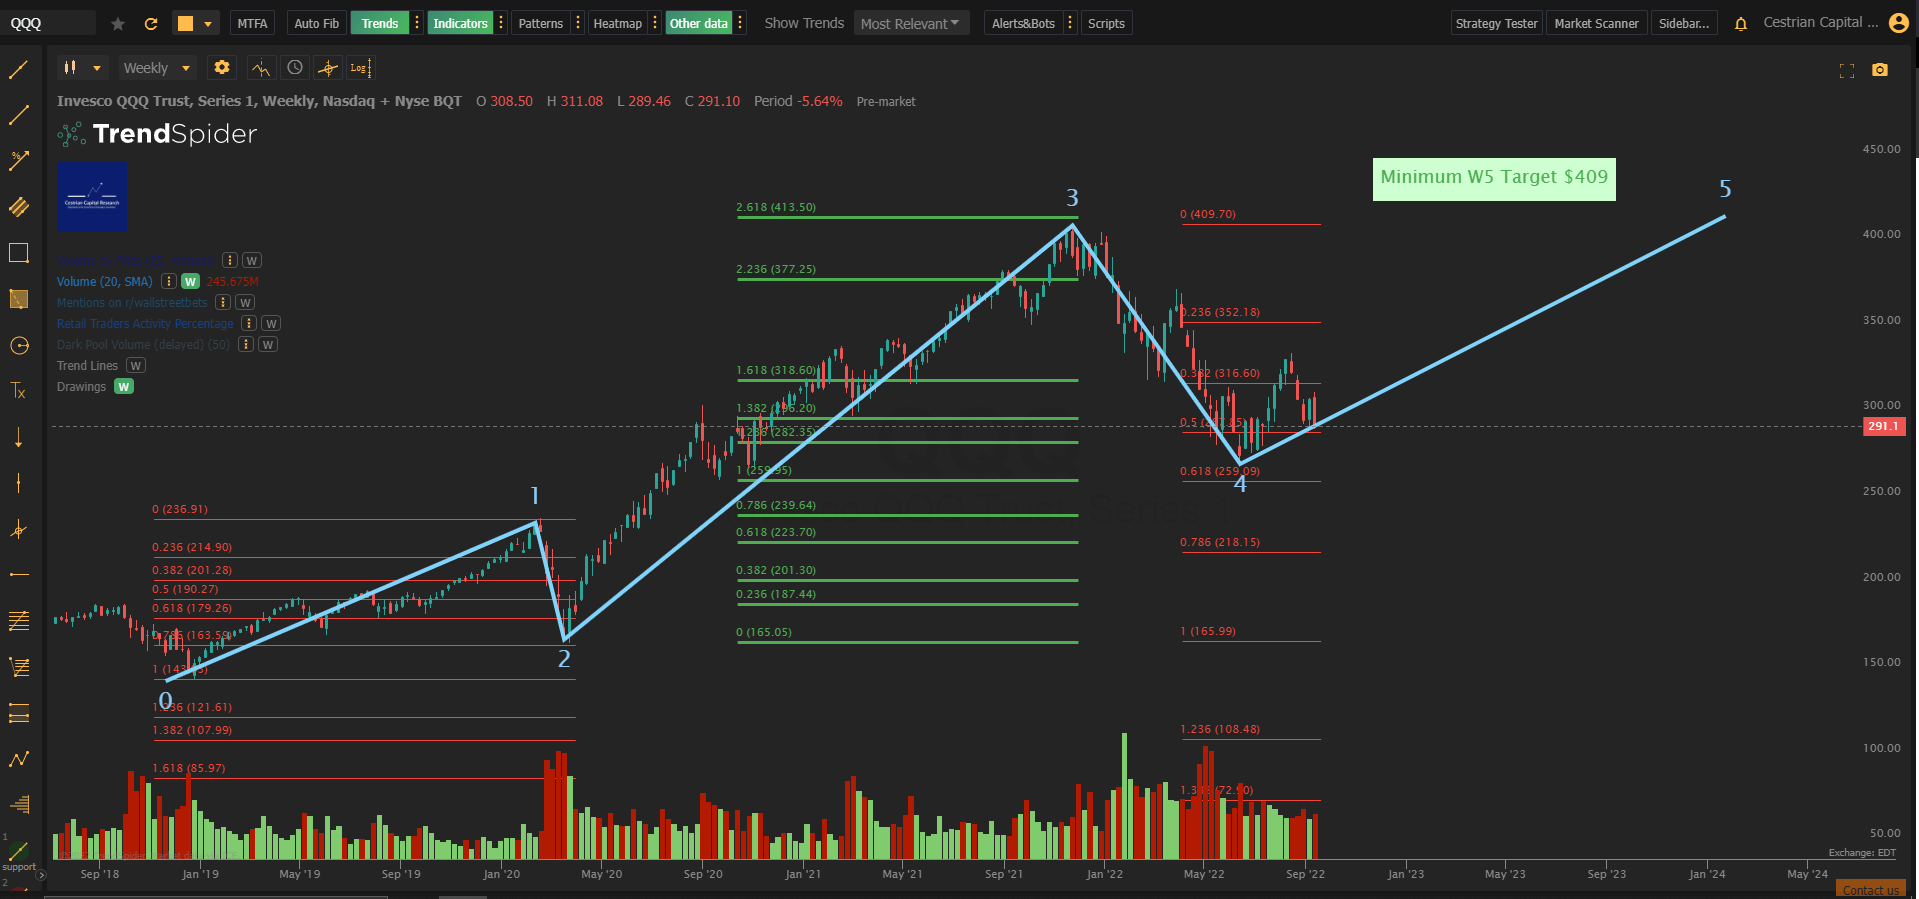
Now, we don’t think this is a Wen Moon situation. We can make a technical argument that QQQ will peak in a Wave 5 in the 500s, 550s even, and maybe it will. But for the record and until facts disturb our opinion, we think that QQQ will make a new high in 2023, maybe early 2024. And then put in a Yikes Wave 2 in the even-larger-degree. Because those 1, 2, 3, 4, 5 waves up you see from 2018 to (maybe) 2023-4? They combine to form probably a Wave 1 up. Which means a Yikes Wave 2 next. Or, maybe they combine to form a Wave 3 up. In which case it’s a Doom N Gloom Forever Wave 4 next. Either way, down. In our Growth Investor Pro service we lean bullish right now but much of our work positioning for possible upside ahead is done – we have our stocks and ETFs set up with stop ideas and accumulation price zones and price targets and all that. More of our time right now is being spent on … how do we make big from the move down that comes after the next high. And for that? Stay tuned.
Oh and by the way. Want to play QQQ to the long side? Consider this approach.
1 – Wait to see if QQQ moves up above $288, which is the 0.786 retrace of the smaller-degree Wave iv above.
2 – If no, wait. (This is like one of those early multi-user dungeon games. “Time passes ….”)
3 – If yes, consider buying with a stop-loss a little below that $288 level … $270-274 makes sense as it’s below the Wave ii low so if it gets there, something has gone wrong.
4 – Consider accumulating a position in the range of $290-$300, slowly over time, buying on red days not green days.
5 – Consider holding to see if we can make it to $335 – the potential Wave v high. That’s >10% free money if so. At which point you can set a trailing stop or move your stops up or similar and then just decide how much of an ulcer you want to develop whilst waiting to see if QQQ can indeed beat the 2021 high.
Good luck to all!
Cestrian Capital Research, Inc – 16 September 2022
Be the first to comment