

Michael Edwards/iStock via Getty Images
Price Action Thesis
We present our detailed price action analysis on D.R. Horton, Inc. (NYSE:DHI) stock as we try to make sense of the current uncertainty in the housing market. Investors are encouraged to use price action to validate their fundamental thesis, given its forward-looking perspective. As such, it provides helpful clues to investors when attempting to understand the market dynamics impacting valuations.
We observed that DHI formed a double top bull trap (significant rejection of buying momentum) in December 2021. Therefore, the market had set up the steep decline in DHI six months ago, highlighting the forward-looking framework of price structures. Double top bull traps are the most potent version of bull traps, as they often indicate early warning signals of significant reversals from their bullish bias. Notably, DHI lost its bullish momentum significantly after the double top and has remained entrenched in a bearish bias.
Our reverse cash flow model suggests that the market could be pricing in a marked downturn in the housing market. However, the consensus estimates suggest that DHI’s profitability is expected to remain robust.
We have not yet observed a bear trap price action (significant rejection of selling momentum) in DHI, even though it’s likely at a near-term bottom. Therefore, we need to see the conviction in its price action to stanch its bearish momentum, which would be instrumental in recovering its bullish bias.
However, we don’t urge investors to layer out/cut exposure now as it’s at a near-term bottom. Therefore, investors looking to cutting exposure should sell into its next short-term rally.
We rate DHI stock as a Hold for now. However, we will reassess our ratings if we observe significant developments in its price structures.
The Party Already Ended in December for DHI
DHI price chart (monthly) (TradingView)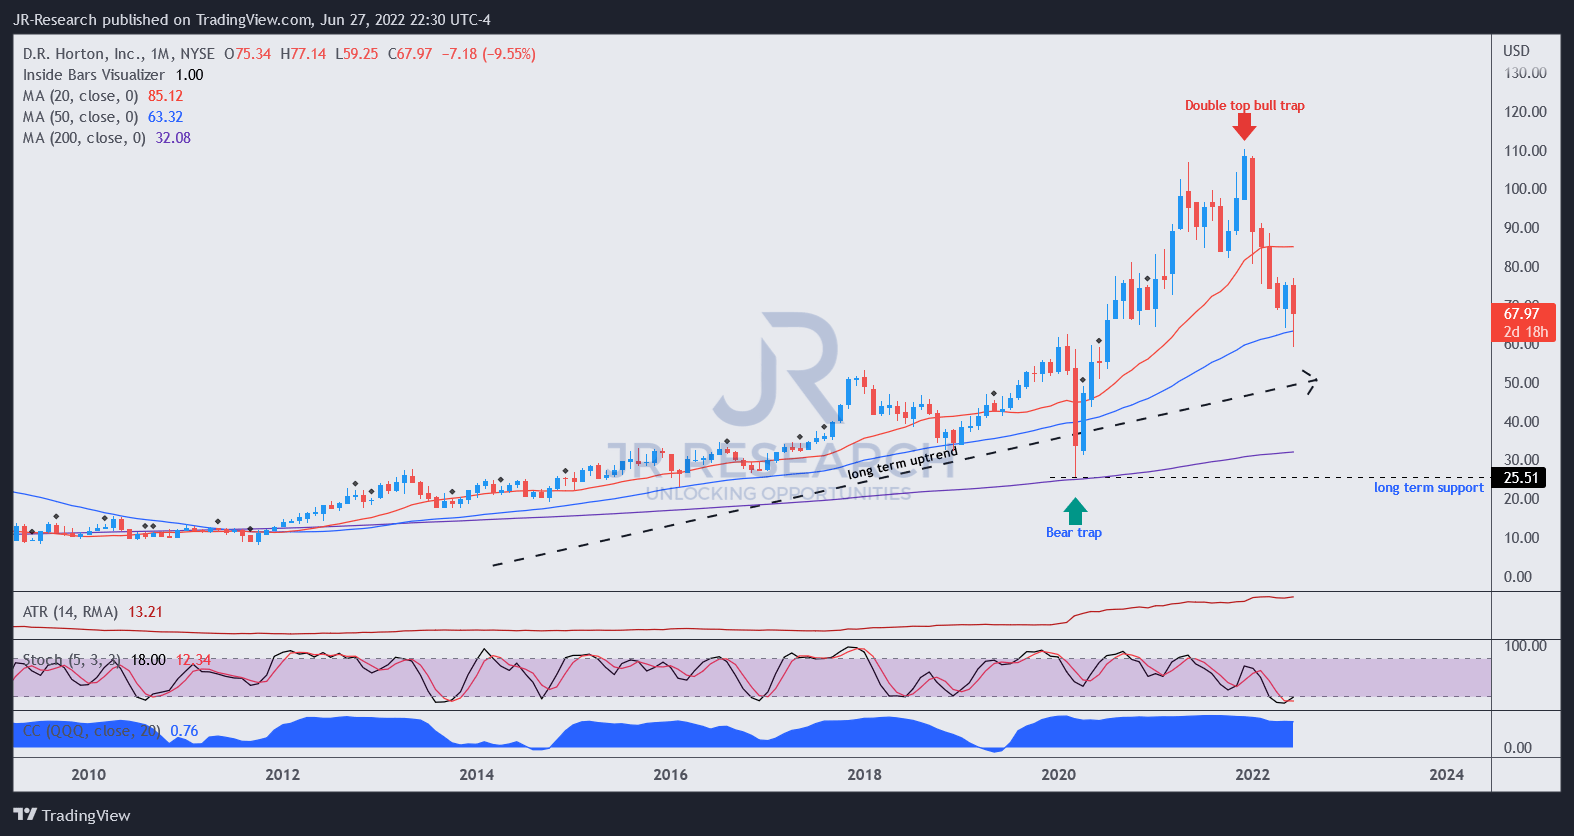
As seen above, signs of “flush-up” price action had already appeared in March-May 2021. A flush-up move indicates the market has drawn in buyers rapidly to set up a top, which is not constructive. However, there was no bull trap yet, indicating the moment to turn the bullish tide had not arrived.
However, the structure that broke the camel’s back was another rapid flush-up to set up the double top in December. It indicates that the market was ready to force a rapid liquidation, digesting DHI’s massive gains from its 2020 COVID bear trap (DHI is down more than 38% from its December highs).
Notwithstanding, DHI’s long-term uptrend remains intact. Furthermore, DHI is also testing its key 50-month moving average, which has underpinned its long-term advance. As such, long-term investors who “don’t care” about near- and intermediate-term price action may even find the entry point attractive.
DHI price chart (weekly) (TradingView)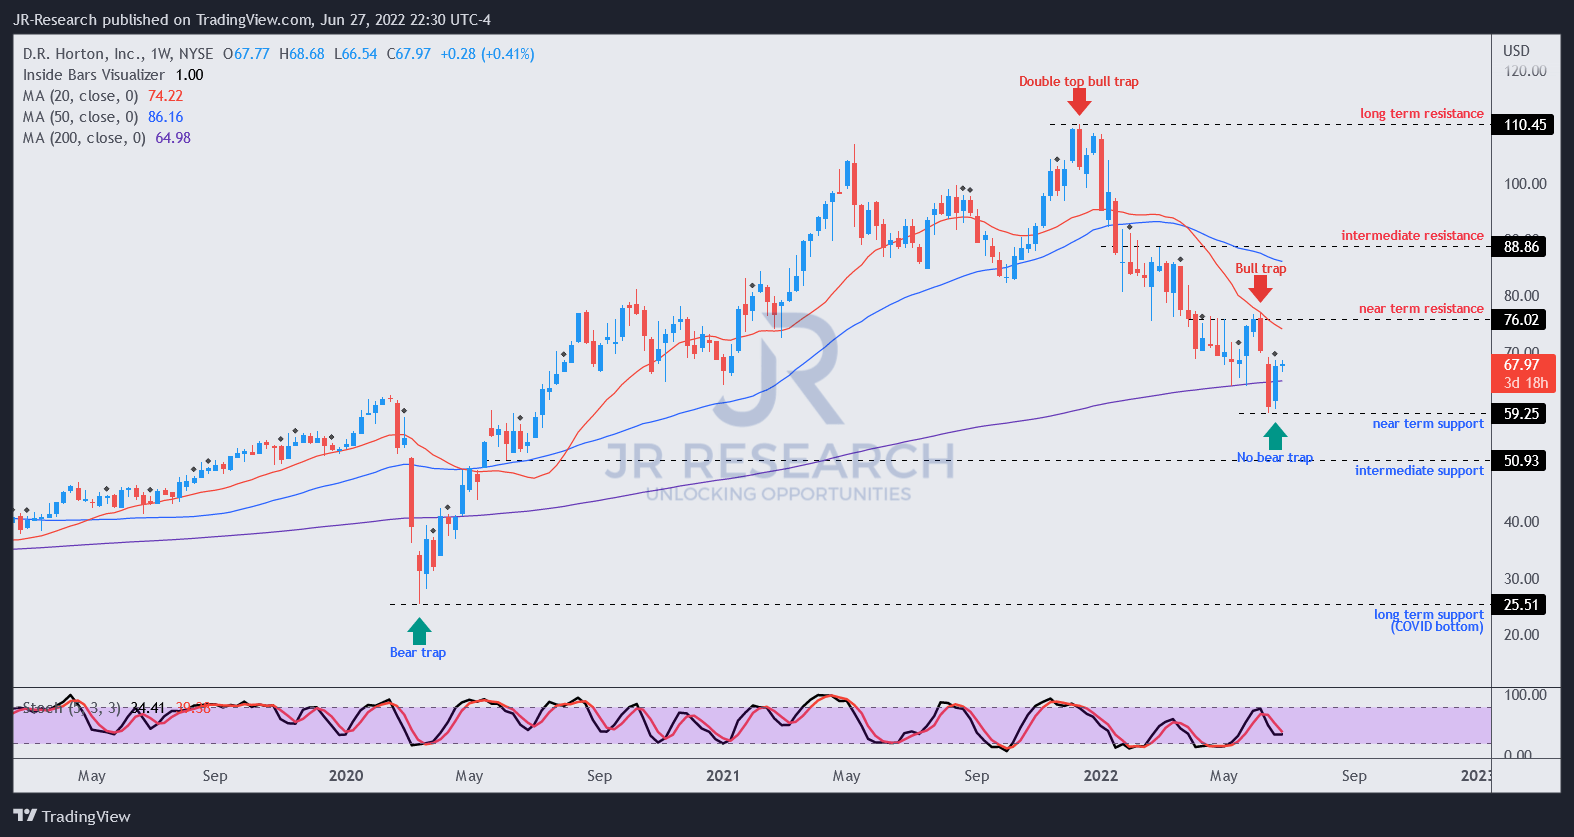
Moving into its weekly chart for the execution signals, we can glean the clear “mountain face” of its double top in December. Astute investors would have used the opportunity to take their profit and cut exposure significantly. However, when investors observe double tops, it’s better to move fast and get down safely before the “avalanche” of selling pressure subsequently forces rapid liquidation.
The rapid liquidation occurred over the next one month (December-January). That move by the market was significant because it decisively broke DHI’s bullish bias since its 2020 COVID bear trap. Therefore, DHI’s momentum has shifted convincingly from bullish to bearish in January 2022 (therefore, price action is forward-looking).
Interestingly, the market continued to distribute (slow, steady selling to prevent steep falls) its gains astutely from January to March. As a result, it effectively drew in unaware dip buyers before forcing another steep sell-off at the end of March. Notably, it also prevented DHI from retaking its bullish momentum.
DHI is likely at a near-term bottom (but no bear trap price action) after June’s rapid liquidation. Moreover, a lower-high bull trap in early June set up its near-term resistance, further sustaining its bearish bias.
Unless we observe a bear trap price action that can indicate a potential reversal of its bearish flow, DHI remains mired in negative flow, and caution is warranted.
The Street Remains Confident Of D.R. Horton’s Robust Profitability
DHI revenue change % and adjusted EBIT margins % consensus estimates (S&P Cap IQ)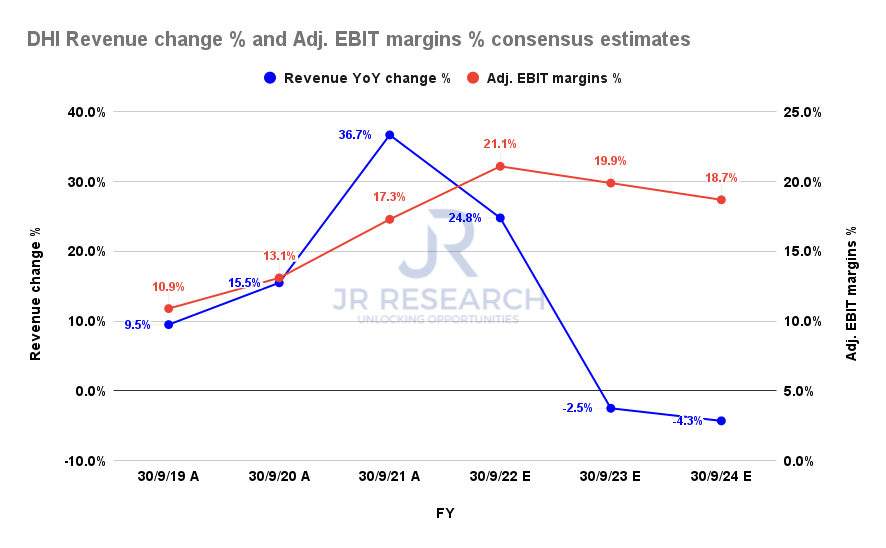
The consensus estimates (generally bullish) modeled for peak revenue growth for D.R. Horton in FY21. Furthermore, its topline growth is expected to moderate to 24.8% in FY22 but fall into negative territory from FY23. Therefore, we believe DHI’s price action has reflected such potential weakness ahead of time.
Notably, the Street expects DHI’s profitability to remain robust, even though it’s estimated to moderate. Moreover, it’s still well ahead of its pre-COVID levels, suggesting robust profitability despite expecting a downturn.
The company is also confident in its supply/demand dynamics and capital efficiency, underpinning its robust profitability. CFO Bill Wheat articulated (edited):
We own only 1.5 years of lots today. That’s the tightest owned lot supply we’ve ever had. That put us in a position to be able to grow with a more capital-efficient land pipeline and generate cash flow even as we’ve grown all the way through the cycle. Other builders have adopted at least portions of that strategy and are at different stages of the journey, but really the industry as a whole is operating more capital efficiently than historically and is generating more cash flow than ever. (UBS Global Industrials and Transportation Conference 2022)
DHI FCF margins % consensus estimates (S&P Cap IQ)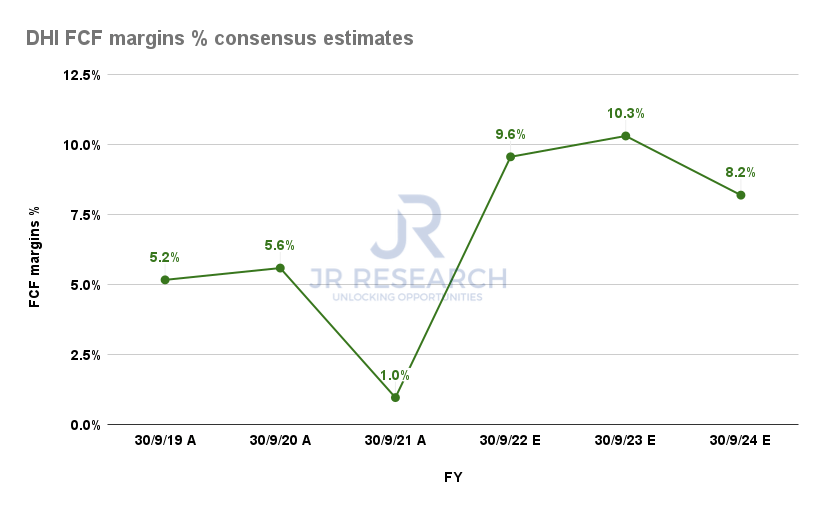
Accordingly, D.R. Horton’s free cash flow (FCF) margins are expected to remain robust, which is instrumental in helping support its valuations. Notably, it’s also projected to remain well above its pre-COVID levels through FY24.
| Stock | DHI |
| Current market cap | $23.93B |
| Hurdle rate (CAGR) | 1.5% |
| Projection through | CQ4’26 |
| Required FCF yield in CQ4’26 | 11% |
| Assumed TTM FCF margin in CQ4’26 | 7% |
| Implied TTM revenue by CQ4’26 |
DHI reverse cash flow valuation model. Data source: S&P Cap IQ, author
DHI has significantly outperformed (5Y total return CAGR of 16.18%) the SPDR S&P 500 ETF’s (SPY) 5Y total return CAGR of 11.85% over the past five years. Given its long-term uptrend, we understand if dip buyers feel a tremendous opportunity with the deep retracement, given its robust profitability.
However, we urge investors to glean critical clues proffered by the market. Notably, the market set up the double top in December, even though DHI posted an FCF yield of 8.89% (Vs. 5Y mean of 5.86%). Therefore, it suggested that the market decisively rejected the 8.9% level as too low for its forward risks.
For the bull trap in June, the market rejected its FCF yield of 12.39% but formed a near-term bottom at a yield of 15.74%. Therefore, we infer that the market currently considers 15.7% as a reasonable level (until proven otherwise by another lower-high bull trap).
Therefore, we derived a required FCF yield of 11% in our model, which we think is reasonable for now. However, our model suggests that the market expects DHI to significantly underperform the market (implied hurdle rate of 1.5%) at the current levels, given our TTM revenue target of $40.21B by CQ4’26.
Moreover, the Street’s modeling suggests a topline decline through FY24, reaching revenue of $32.35B. Hence, we think the market is pricing in a potentially steeper decline in its topline growth, despite its robust profitability.
Is DHI Stock A Buy, Sell, Or Hold?
We rate DHI as a Hold for now. However, as the stock is likely at a near-term bottom, we urge investors to cut exposure at its next rally if they want to.
Our price action analysis suggests that the market has already priced in potential weakness in its revenue growth moving ahead. However, the market could continue its bearish bias as it attempts to attract more dip buyers. Hence, we encourage investors to be patient and wait for a bear trap to form.
Our valuation analysis suggests that the market expects DHI to underperform at the current levels.
Be the first to comment