Many income investors are drawn to CVS (NYSE:CVS) and Walgreens Boots Alliance (NASDAQ:WBA) for good reasons. The healthcare sector enjoys a safe haven status because of the long-term secular support.
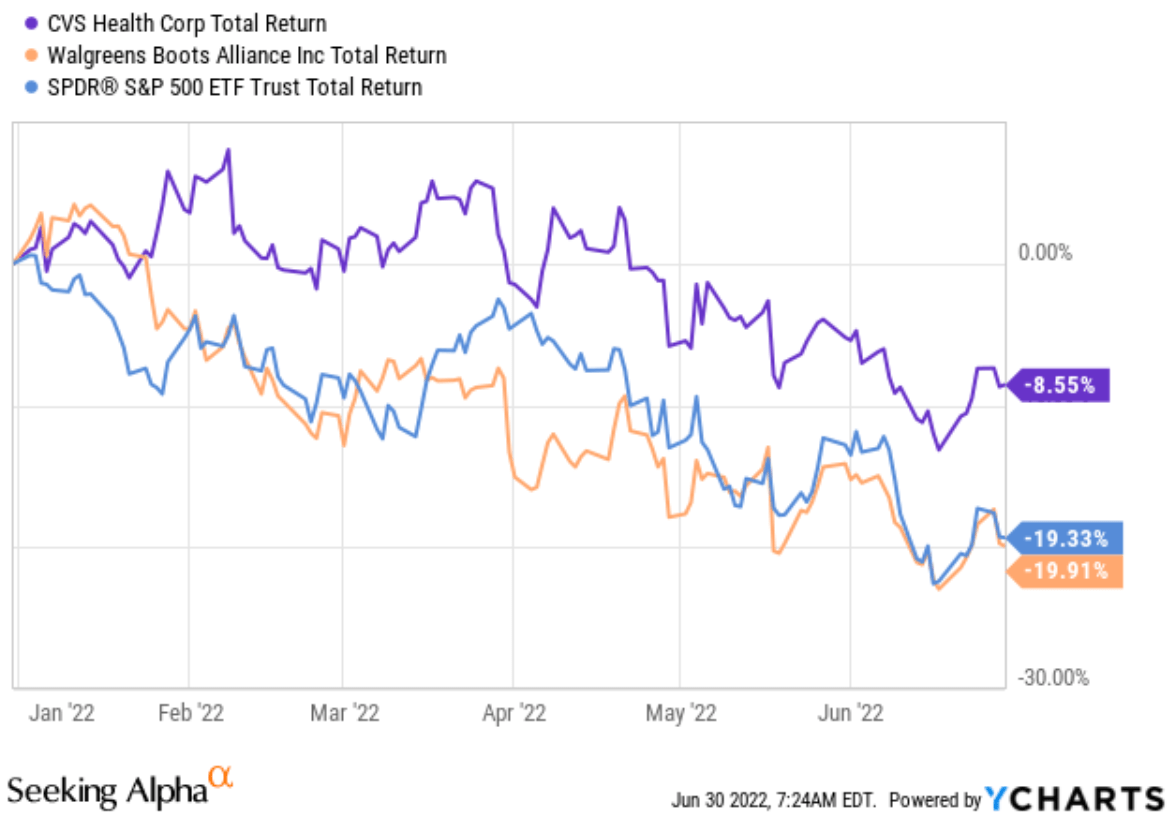
And the recent selloff has created an attractive entry opportunity for both. As you can see from the following chart, both CVS and WBA stock prices have corrected substantially together with the overall market. CVS suffered a total loss (after adjusting for dividends) of more than 8.5% YTD. And WBA suffered a total loss of more than 19.9%, closely tracking the S&P 500’s 19.3% loss.
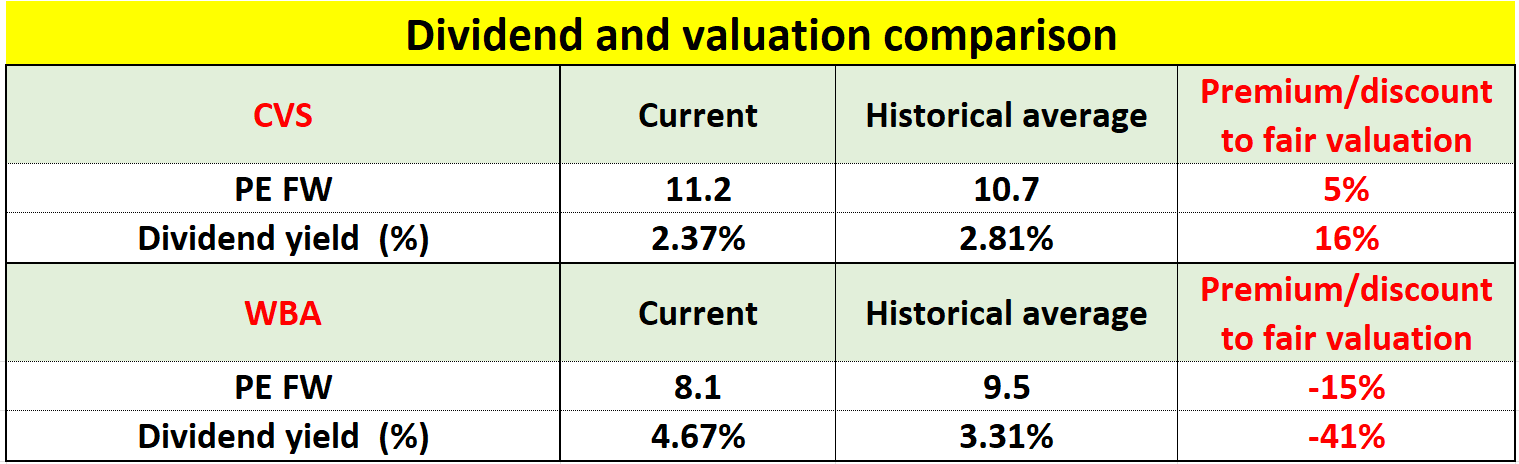
Such sizable corrections have brought their valuation and dividend yields to attractive levels as you can see from the second chart below. Currently, the dividend for CVS is about 2.8% and almost 4.7% for WBA, although WBA’s dividend yield is higher than CVS in both absolute and relative terms once we put things into historical perspective. The dividend yield for CVS has fluctuated in the past five years between 1.85% and 3.84% with an average of 2.81%. Therefore, its current dividend yield, although attractive in absolute terms, is actually below its historical average by 16%. In contrast, WBA’s dividend yield fluctuated in the past five years between 1.84% and 5.49% with an average of 3.31%. Therefore, its current 4.67% dividend yield is above its historical average by a whopping 41%.
Next, we will examine if we should be concerned with the safety of such a high dividend. And the short answer is “No” after checking their dividend payout, profitability, and also financial strength.
Seeking Alpha
Seeking Alpha
Comparison of profitability and payout management
Both stocks have demonstrated long-term dividend consistency and growth, and Walgreens is a dividend champion with 46 years of consecutive raises. I have no doubt that it will be crowned a dividend king in a few years. Their dividends are supported by healthy business fundamentals and our healthcare needs, which translate to robust and sustainable profits.
As you can see from the following chart, both enjoy strong profitability. Comparing profitability is ultimately subjective and my impression is that their profitability is quite comparable. To cite a few key metrics, WBA enjoys a gross margin of 22%, almost 5% above CVS’ 17.3%. WBA also enjoys a higher net margin of 4.6%, almost 2% higher than CVS’ 2.6%, although CVS enjoys better EBIT margin, EBITDA margin, and also better return on assets. Note that the return on equity metrics are not really applicable here due to the difference in their capital structures.
Finally, also note CVS is also larger in absolute sizes ($18.9B of cash from operations) than WBA (by more than 3x). A larger scale naturally adds another layer of safety.
Seeking Alpha
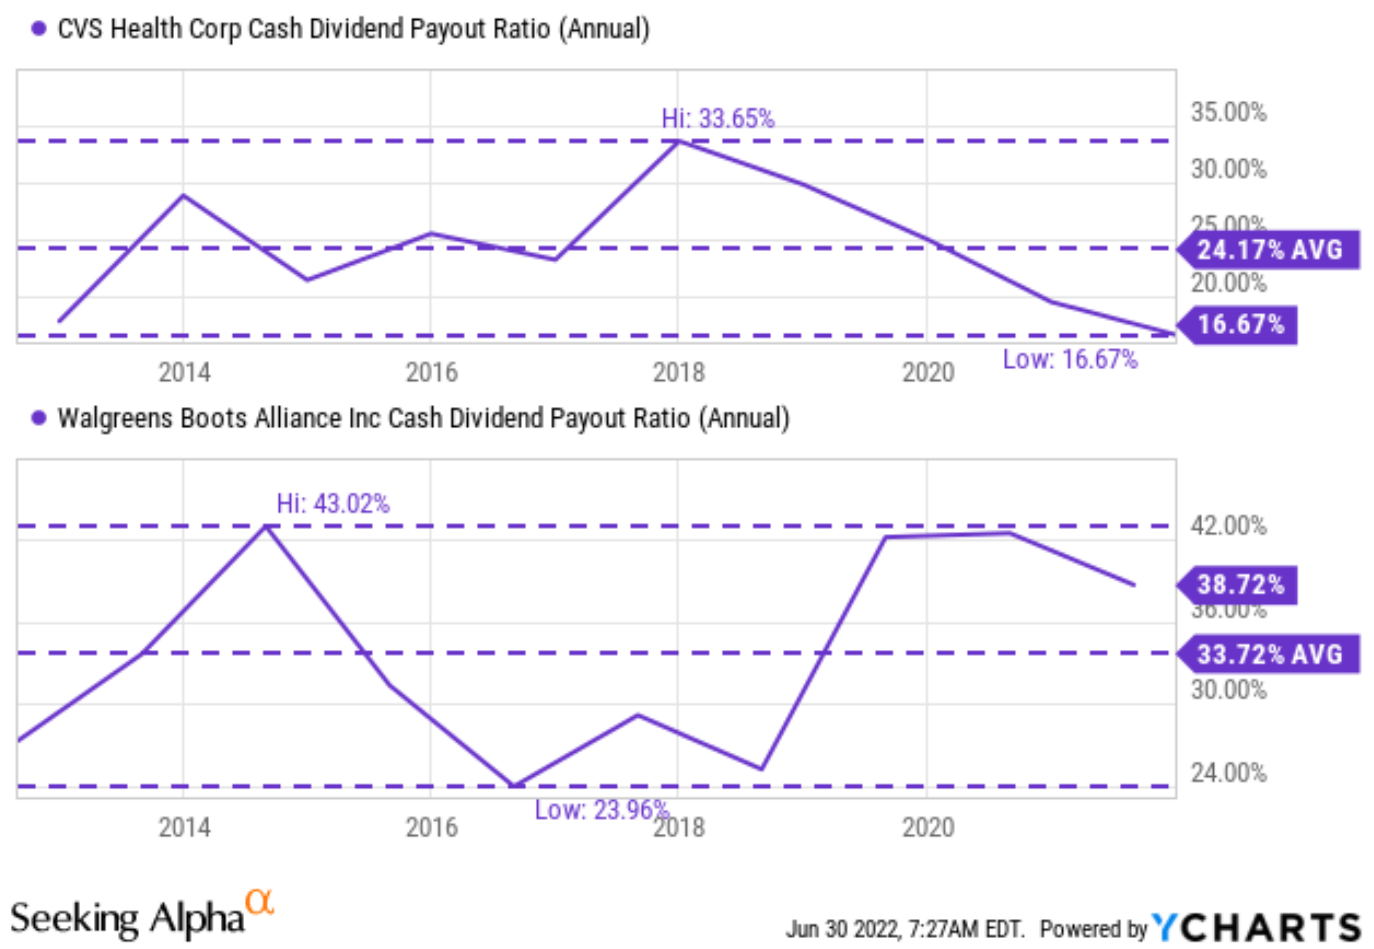
And for dividend investors, I am sure all of us know all the typical metrics to gauge dividend safety by payout ratios. The following chart shows CVS and WBA’s payout ratios in terms of cash flow. As seen, both CVS and WBA have been doing a consistent job of managing their dividend payout in the past.
In particular, the payout ratio for CVS is currently about 16.7% and about 38.7% for WBA. So, CVS’ current cash payout ratio is lower than WBA’s by more than a factor of 2x. However, investors do not have to be too alarmed once we examine their historical payouts. The payout ratio for CVS has fluctuated in the past decade between 16.7% and 33.6% with an average of 24.1%. Therefore, its current payout is indeed at its safest level in a decade.
WBA’s payout ratio fluctuated between 24% and 43% with an average of 33.7%. Therefore, its current payout is indeed a bit above the historical average. But it is nothing out of the ordinary and does not concern me. Furthermore, next, you will see that whatever WBA lags in payout ratio, it certainly makes it up with a more conservative balance sheet.
Seeking Alpha
Balance sheet management
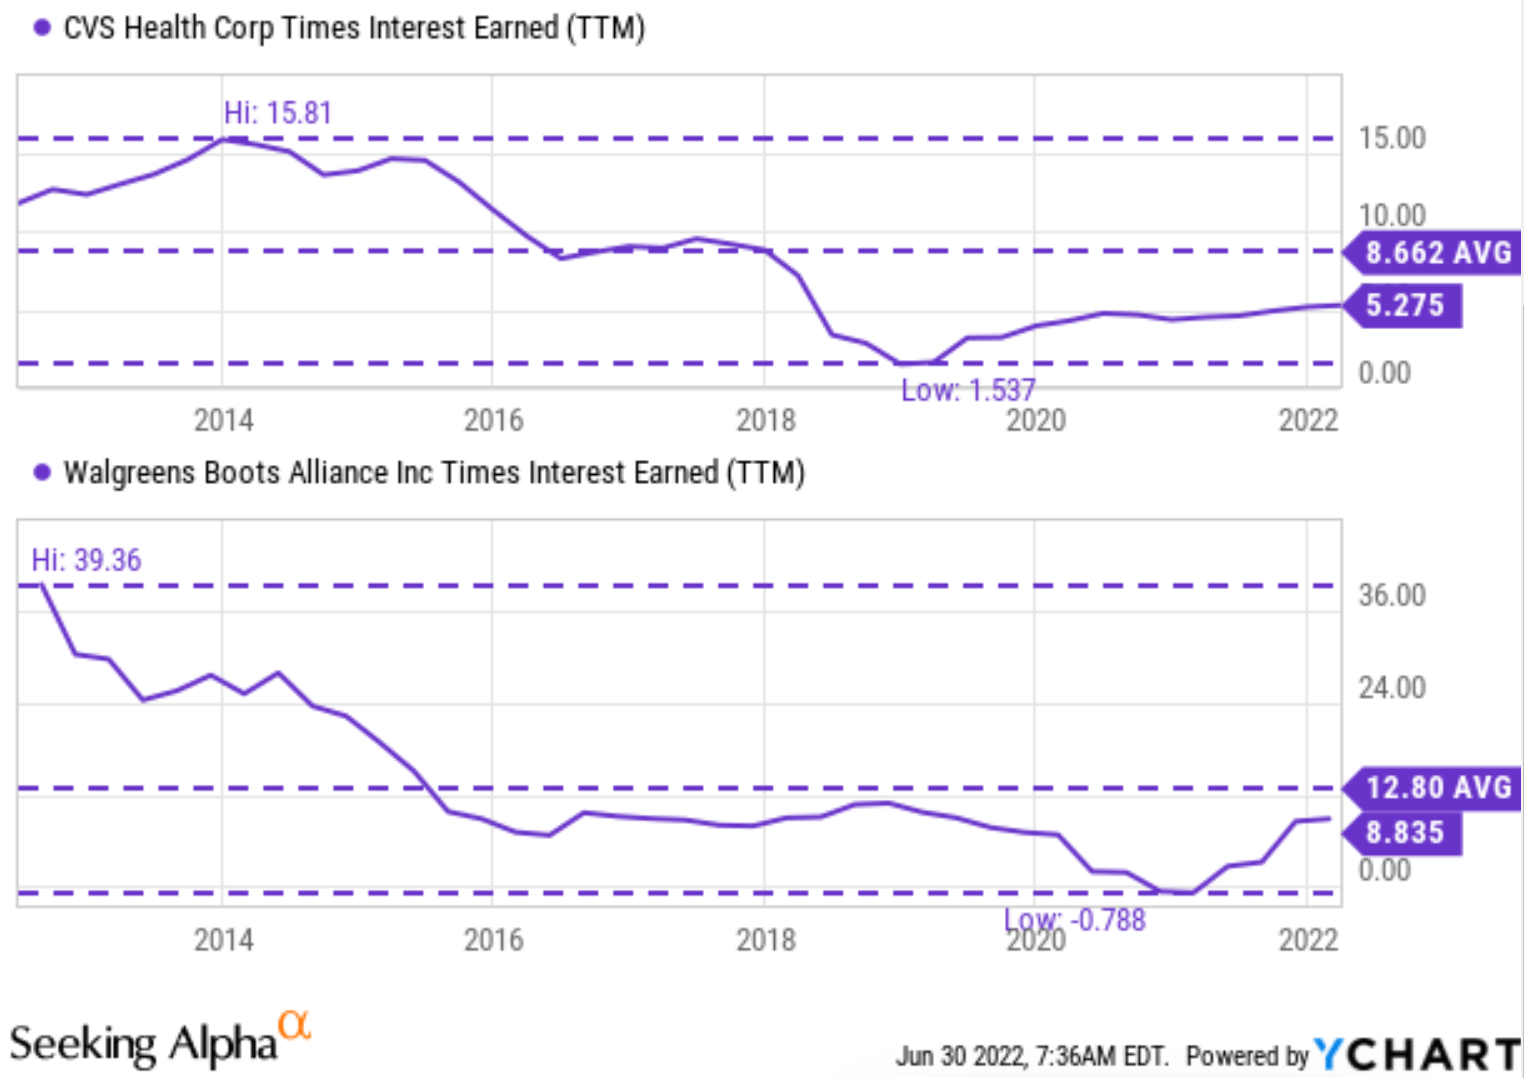
CVS’ balance sheet is more stretched in recent years than on average after its Aetna acquisition in 2017. The acquisition added about $50B of debt to its balance sheet. As you can see from the following chart, it has been deleveraging since then, but its current leverage is still higher than its historical average. In terms of interest coverage, CVS has been earning on average 8.66 times its interest in the past decade. And currently, it is only earning 5.27 times, about 40% below its historical average. Although, its management is confident about the financial strength of the business and is very clear about maintaining an investment-grade rating balance sheet, as reiterated in the following Q&A during its recent earnings presentation. The emphases were added by me.
Question from Justin Lake from Wolfe Research: Got it. And if I can just ask a follow-up. You mentioned capital. So, running some numbers there, I am getting to over that 3-year period you talked about the Investor Day ‘22 to ‘24, about $20 billion of potential capital above and beyond what you have already kind of earmarked, but about two-thirds of that coming from free cash flow generation, about a third from potential leveraging up to about 3.5x. Is that a reasonable ballpark number in terms of what you think your excess capital could be that’s already not guided?
Answer from Shawn Guertin (CVS CFO): I think that probably assumes some leverage ratio that’s a little bit higher than where we are today, but still consistent with sort of our investment-grade rating strategy. But I think that ballpark is in the neighborhood.
WBA, in contrast, maintains a much more conservative balance sheet. It has been earning on average 12.8 times its interest in the past decade. And currently, it is earning 8.8 times. So its interest coverage is much healthier than CVS’ 5.27x. Admittedly, 8.8x is lower than the historical average of 12.8x by about 30%. However, note that the historical average is distorted by its 30+ interest coverage in the early part of the decade. And to put things into an even broader perspective, the overall economy has an interest coverage somewhere in the 6x to 7x range. So WBA is finally stronger than the majority of the business already.
Seeking Alpha
Valuation and Projected Returns
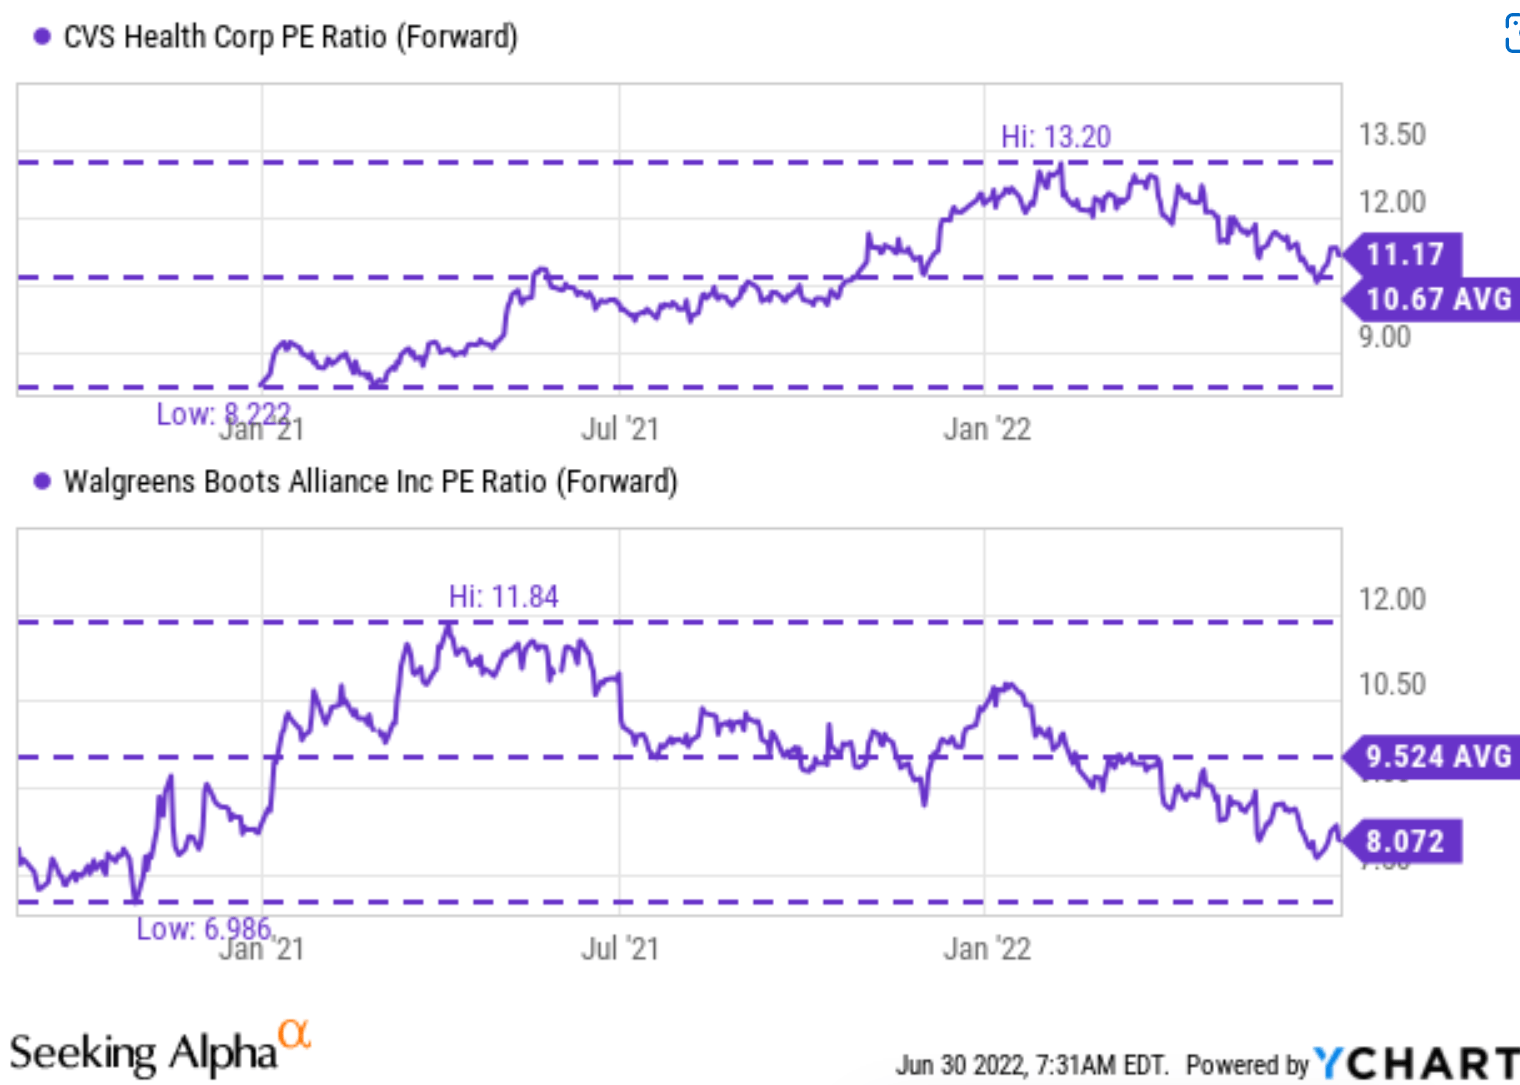
As shown in the chart below, CVS is more expensively valued than WBA despite their comparable profitability. CVS’ current FW P/E is about 11.2x, about 31% above WBA’s 8.1x.
The valuation premium is even more pronounced when we compare it against their own historical range. In recent years, CVS FW P/E has fluctuated from a bottom of 8.2 to a peak of 13.2 in the past decade with an average of 10.7x. Its current 11.2x FW P/E is actually about 5% above its historical average. In contrast, WBA FW P/E has fluctuated between a bottom of 6.9x to a peak of 11.8x in the past decade with an average of 9.52x. Its current 8.1x FW P/E is about 15% discounted from its historical average.
Seeking Alpha
Author based on Seeking Alpha data
Final thoughts and risks
Recent market corrections have created an entry opportunity for both CVS and WBA. Both are attractive dividend stocks with a good combination of consistent and safe dividends, and both are well poised for long-term growth thanks to a strong secular tailwind.
But I find WBA more appealing for several reasons. WBA dividend yield is higher than CVS in both absolute and relative terms. WBA is currently yielding 4.67%, almost double that of CVS. Compared to their historical record, WBA’s current yield is above its historical average by a whopping 41%, while CVS’ yield is actually below its historical average by 16%. Furthermore, the valuation discount for WBA is too large to ignore. Its FW P/E is discounted by 18% relative to CVS despite comparable profitability and a stronger balance sheet.
Finally, a word about risks. Both businesses face inflation, supply chain, labor, and interest rate risk in the near term. CVS will be more sensitive to the interest rates because of its higher leverage as aforementioned. The following Q&A from the CVS’ earnings presentation best illustrates these risks (abridged and emphases added by me). Although these comments came from CVS, they apply to WBA equally well.
Question from A.J. Rice (Credit Suisse): Okay. Just a brief follow-up, you haven’t been asked this way at the call, so surprising on inflation, supply chain, labor. Any updated thoughts on any of that?
Answer from Shawn Guertin (CVS CFO): I don’t think we felt a lot of pinch, but the one obviously the one place that we did see it is actually a result of the kind of cousin of inflation, and that’s interest rates and some of the losses that – realized capital losses that we took in the portfolio related to that… As you mentioned, I mean as we think forward, there is a potential across all of our businesses for both the labor and G&A aspects, but I think as I have thought about this it’s the cost of goods sold aspect that I have – we have certainly thought about a lot.
Please note that foreign exchange and other leveraged trading involves significant risk of loss. It is not suitable for all investors and you should make sure you understand the risks involved, seeking independent advice if necessary.


Be the first to comment