

JHVEPhoto
CVS Health Corporation (NYSE:CVS) has delivered strong results for investors over the past year. CVS’ total 12-month return is +10.9% vs. +0.87% for the Healthcare Select SPDR ETF (XLV) and -14.6% for the S&P 500 (SPY). CVS operates 3 major business lines: healthcare benefits, pharmacy services, and retail pharmacy / long-term care. For the most recent quarterly results, for Q2, YoY operating income for these three segments grew by 13.4%, 5.7%, and -0.1% (respectively). The healthcare plan industry (as tracked by Morningstar) has performed especially well over the past year, with a 24.6% total return. CVS’ strong performance in this business line has contributed substantially to the share performance.
On October 6th, the Centers for Medicare and Medicaid Services (‘CMS’) downgraded the CVS-owned Aetna national preferred provider organization (‘PPO’) plan. CVS shares declined sharply following this news even though CVS management stated that the downgrade did not change the earnings guidance for 2022 as a whole.
Seeking Alpha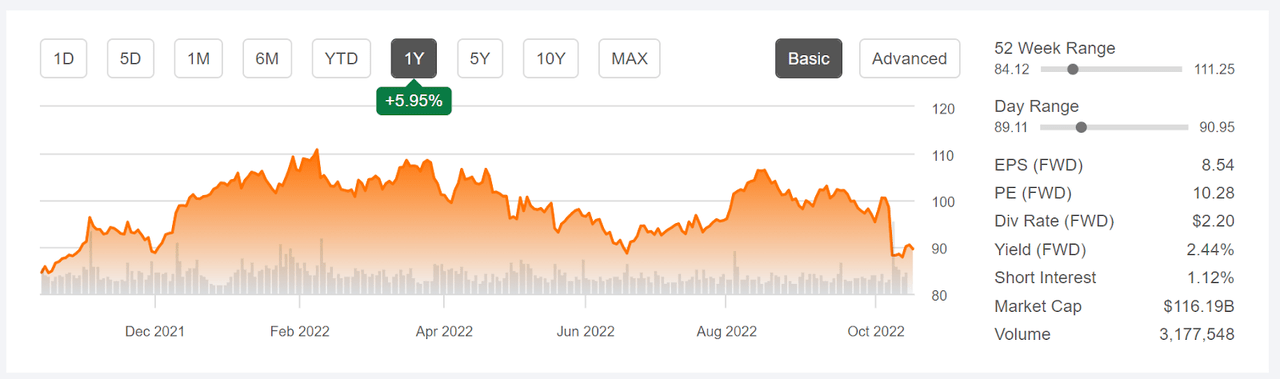
12-Month price history and basic statistics for CVS (Source: Seeking Alpha)
CVS’ earnings have been boosted by COVID vaccinations since late 2020, but the consensus outlook is for little growth in the coming year. The consensus outlook for EPS growth is a modest 6.4% per year over the next 3 to 5 years.
ETrade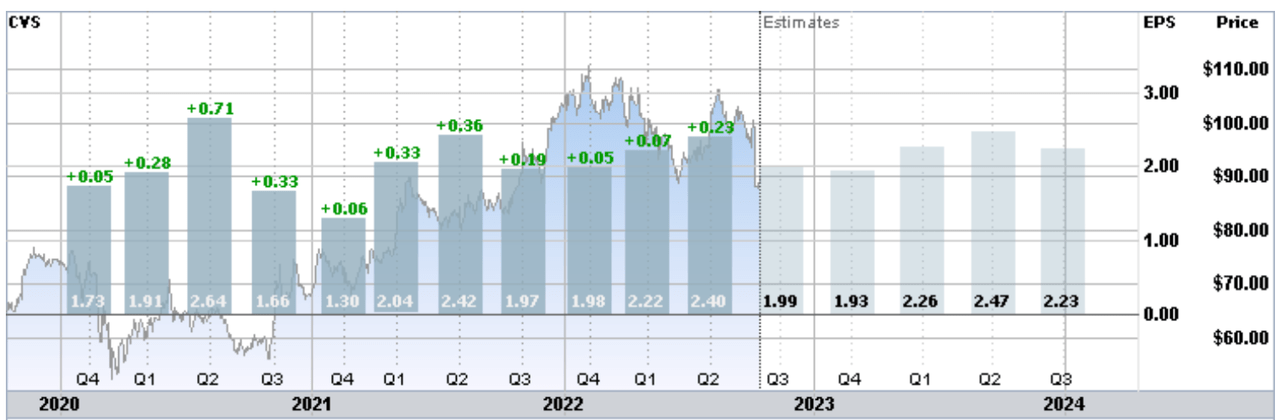
Trailing (3 years) and estimated future quarterly EPS for CVS. Green values are amounts by which quarterly EPS beat the consensus expected values (Source: ETrade)
I last wrote about CVS almost 5 months ago, on May 17, 2022, when I maintained my buy rating. Since the close on that date, CVS has returned a total of -9.5% vs. -11.4% for the S&P 500 (SPY) and -4.9% for the Healthcare Sector SPDR (XLV). As of May 17th, the forward P/E was 11.6, on the lower end of CVS’ P/E over the past 10+ years.The Wall Street consensus rating for CVS was a buy and the consensus 12-month price target was 20% above the share price at that time, for a total expected return (including the 2.3% dividend yield) of 22.3%. The dispersion among the individual analysts’ price targets was quite low, adding confidence in the predictive value of the consensus. The market-implied outlook, a probabilistic price forecast that represents the consensus view among buyers and sellers of options, was slightly bullish with a moderate expected volatility of 30% (annualized). As a rule of thumb for a buy rating, I want to see an expected 12-month return that is at least ½ the expected volatility. Taking the Wall Street consensus price target at face value, CVS substantially exceeded this threshold (22.3% expected return vs. 30% expected volatility).
For readers who are unfamiliar with the market-implied outlook, a brief explanation is needed. The price of an option on a stock is largely determined by the market’s consensus estimate of the probability that the stock price will rise above (call option) or fall below (put option) a specific level (the option strike price) between now and when the option expires. By analyzing the prices of call and put options at a range of strike prices, all with the same expiration date, it is possible to calculate a probabilistic price forecast that reconciles the options prices. This is the market-implied outlook. For a deeper explanation and background, I recommend this monograph published by the CFA Institute.
Since my May post, CVS’ forward P/E has fallen to 10.3% and the company reported Q2 results with EPS 10.4% above expectations. CVS reports Q3 results on November 2nd. I have calculated updated market-implied outlooks for CVS and I have compared these with the current Wall Street consensus outlook in revisiting my rating for CVS.
Wall Street Consensus Outlook for CVS
ETrade calculates the Wall Street consensus outlook for CVS using ratings and price targets from 13 ranked analysts who have published their opinions in the past 3 months. The consensus rating is a buy, as it has been for all of the past 12 months. The consensus 12-month price target is 36.6% above the current share price. The spread in the individual price targets is quite narrow, suggesting that the consensus is likely to provide useful forward guidance.
ETrade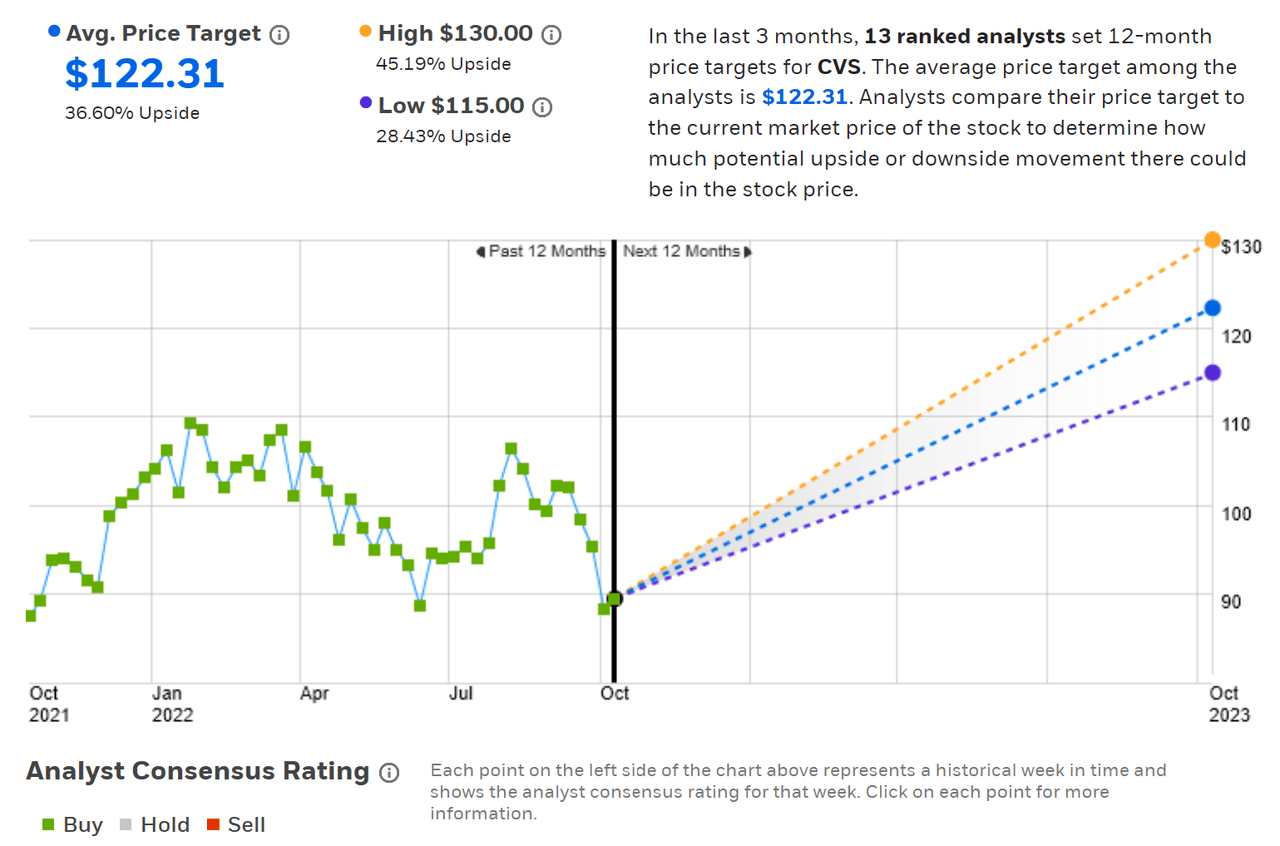
Wall Street analyst consensus rating and 12-month price targets for CVS (Source: ETrade)
Seeking Alpha’s version of the Wall Street consensus outlook for CVS is calculated using the views of 27 analysts who have published ratings and price targets over the past 90 days. The consensus rating is a buy and the consensus 12-month price target is 33.6% above the current share price.
Seeking Alpha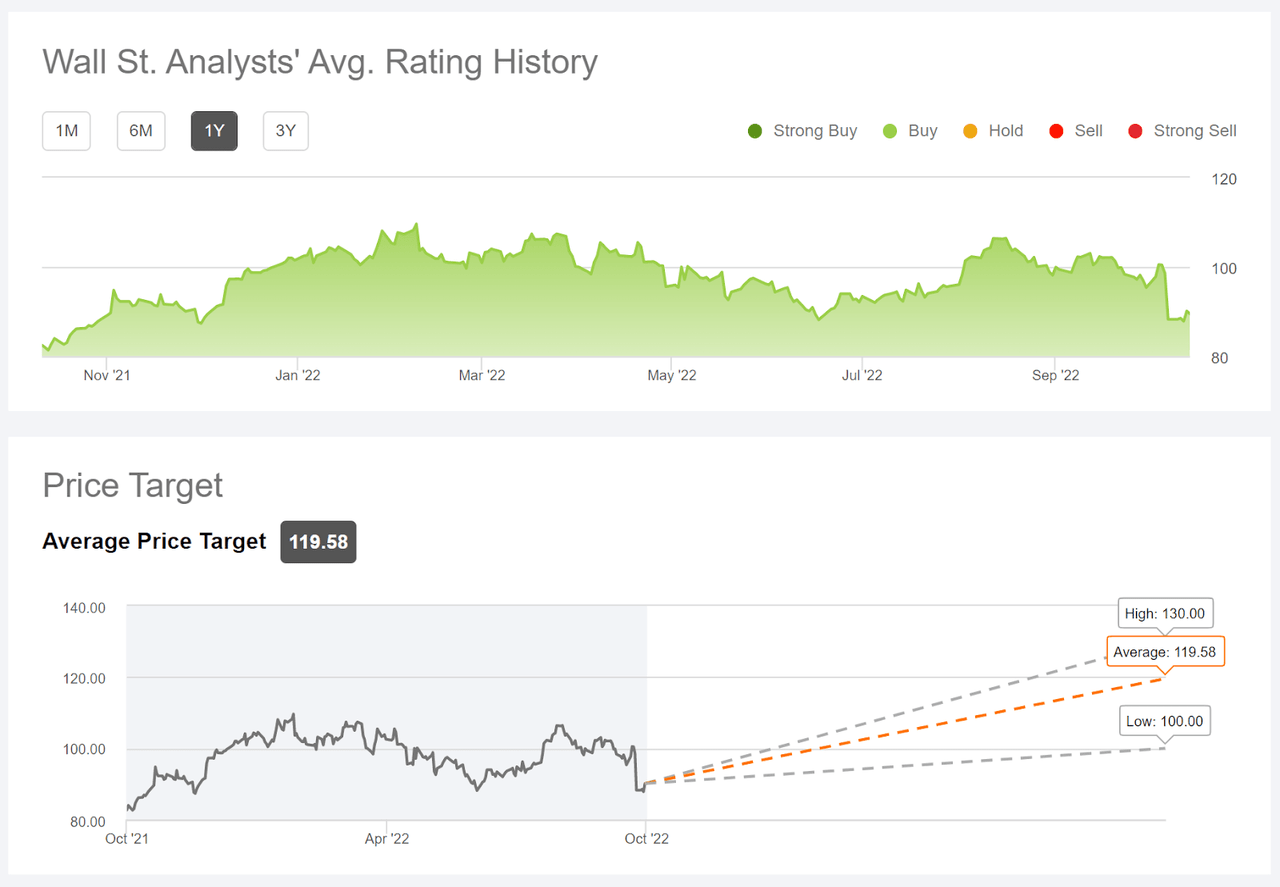
Wall Street analyst consensus rating and 12-month price targets for CVS (Source: Seeking Alpha)
For a fairly low risk stock like CVS, having the consensus price target more than 30% above the current share price is quite unusual. The implied return is much higher than it was back in May.
Market-Implied Outlook for CVS
I have calculated the market-implied outlook for CVS for the 3.2-month period from now until January 20, 2023 and for the 8-month period from now until June 16, 2023, using the prices of put and call options that expire on these dates. I selected these specific expiration dates to provide a view through the end of 2022 and to the middle of 2023. In addition, the options that expire in January and June tend to be among the most liquid, adding confidence in the representativeness of the outlooks.
The standard presentation of the market-implied outlook is a probability distribution of price return, with probability on the vertical axis and return on the horizontal.
Geoff Considine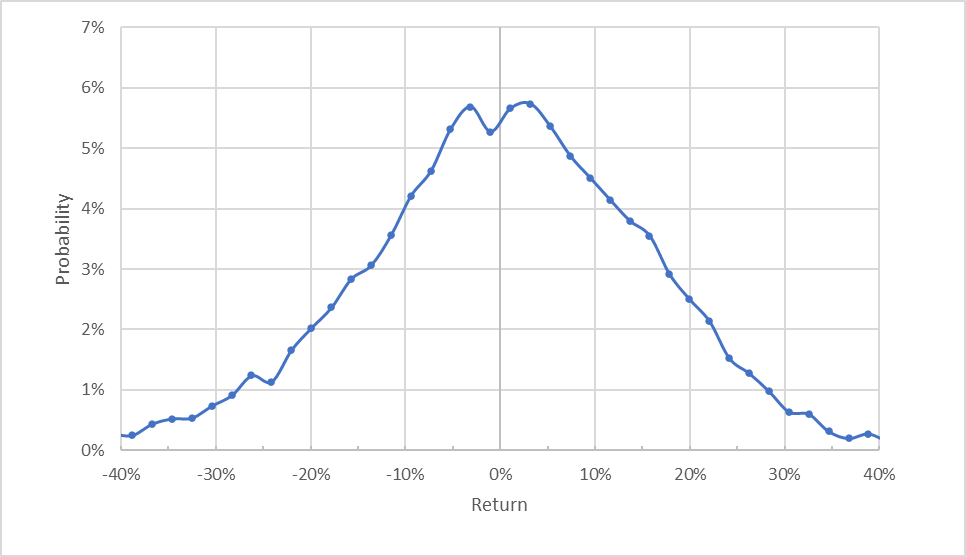
Market-implied price return probabilities for CVS for the 3.2-month period from now until January 20, 2023 (Source: Author’s calculations using options quotes from ETrade)
The market-implied outlook is generally symmetric, with comparable probabilities for positive and negative returns of the same magnitude. The expected volatility calculated from this outlook is 33.3% (annualized), slightly higher than the value calculated in May. This increase corresponds to the modest rise in overall market volatility since May, rather than indicating anything specific about CVS.
To make it easier to compare the relative probabilities of positive and negative returns, I rotate the negative return side of the distribution about the vertical axis (see chart below).
Geoff Considine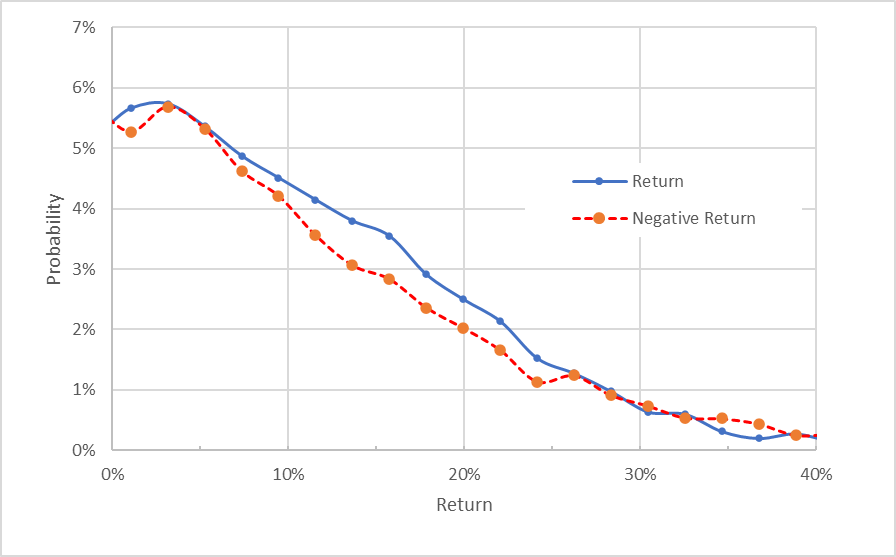
Market-implied price return probabilities for CVS for the 3.2-month period from now until January 20, 2023. The negative return side of the distribution has been rotated about the vertical axis (Source: Author’s calculations using options quotes from ETrade)
This view shows that there is a small but consistent asymmetry in the outlook, with the probabilities of positive returns slightly higher than those for negative return, across a wide range of the possible outcomes for CVS. This is a slightly bullish outlook.
Theory indicates that the market-implied outlook is expected to have a negative bias because investors, in aggregate, are risk averse and thus tend to pay more than fair value for downside protection. There is no way to measure the magnitude of this bias, or whether it is even present, however. The expectation of a negative bias in the outlook reinforces the bullish interpretation of the 3.2-month outlook.
The 8-month outlook is similar to the shorter-term outlook, with a small bullish tilt and expected volatility of 32.2% (annualized).
Geoff Considine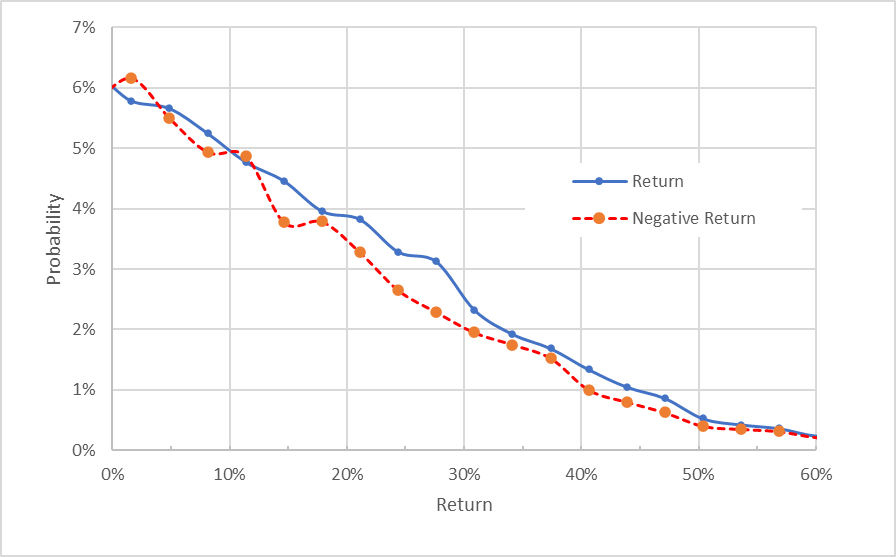
Market-implied price return probabilities for CVS for the 8.0-month period from now until June 16, 2023. The negative return side of the distribution has been rotated about the vertical axis (Source: Author’s calculations using options quotes from ETrade)
The market-implied outlooks to mid-January and to mid-June of 2023 are both slightly bullish, with expected volatility of 32%-33%. These outlooks are similar to the results from mid-May.
Summary
The market has favored companies in the healthcare plan industry, and CVS has gotten a boost from this effect. The healthcare benefits segment of CVS has also been a bright spot in earnings, with 13.4% operating income growth YoY. CVS has substantially outperformed the S&P 500 and the healthcare sector over the past 12 months, but has lagged the healthcare plan industry group. CVS’s diversification across its 3 business segments should provide valuable diversification benefits, however. CVS’ current valuation is reasonable. The Wall Street consensus rating continues to be bullish and the consensus 12-month price target implied a total return of 37.4% (averaging the ETrade and Seeking Alpha consensus price targets and adding the dividend yield), exceeding the expected volatility. This is a very high expected return relative to the volatility. The market-implied outlooks to early- and mid-2023 are both slightly bullish. I am maintaining my buy rating on CVS.
Be the first to comment