

Mohammed Haneefa Nizamudeen/iStock via Getty Images
Investment Summary
Since our last publication on CVRx, Inc. (NASDAQ:CVRX), we’ve seen the stock pull away to the upside. The stock has run from $5.83 to $14.44 and all but proved our hold thesis wrong. Thankfully, the tides have changed and after a solid set of Q3 numbers, we’re back today to discuss our latest findings and present our technical studies on the stock. Q3 revenues came in 82% higher YoY to $6.2mm, with the heart failure business growing to $4.9mm for the quarter. This was built on 167 units for the period versus 84 revenue units the year before.
Exhibit 1. CVRX 18-month return [weekly bars, log scale]
Data: Updata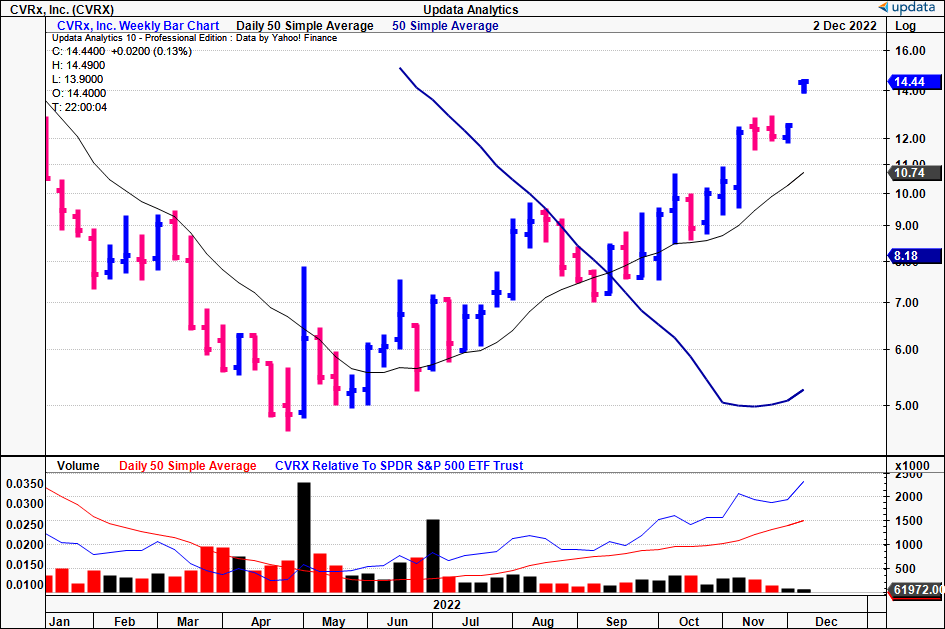
As a reminder, our previous analysis [which you can check by clicking here] uncovered the following:
- Total addressable market for the Barostim Neo (“Barostim”) at roughly $3Bn.
- Barostim backed by robust clinical evidence that stands up well in safety and peer review.
- Market data at the time suggested investors were shying away from low-profitability, high revenue stocks.
Alas, macro-data is now improving and the market looks to have priced in a good portion of the downside risk looking ahead. Therefore, we see an improving market, backed by the company’s latest numbers, as key factors changing our thesis to a buy, seeking a technically-derived price target to $19.45.
Importantly, key downside risks to our investment thesis include the following:
- Market technicals becoming disconnected from fundamentals, causing short-term pricing volatility in CVRX stock.
- Reversal in broad equity markets to the downside from worse-than-expected macroeconomic data, such as inflation, rates.
- Barostim growth tapers off or slows drastically over the next 1 or 2 reporting periods.
- Loss of market share from competitors.
- Inability to absorb cost increases into gross and operating margins, resulting in a substantial decrease in earnings growth.
- Investors should identify and understand these risks before considering any position in CVRX.
Macroeconomic backdrop
In order to understand our change in rating it’s prudent to discuss the macro-drivers to our assumptions. Equity markets have caught a strong bid in the back end of FY22 with US stocks rallying off lows from October. This has been good for CVRX, as it too began to curl up from around July.
Question is, how much of the stock’s latest returns is just equity beta, and how much is idiosyncratic return?
You can see below, that as CVRX began to turn off its low points in July, its covariance structure against the S&P 500 began to shift down. In our opinion, this is a good trend as it demonstrates investors are rewarding CVRX for company specific factors, versus tacking onto the benchmark’s rally.
Exhibit 2. As CVRX caught a bid equity beta has shifted downwards
Data: Updata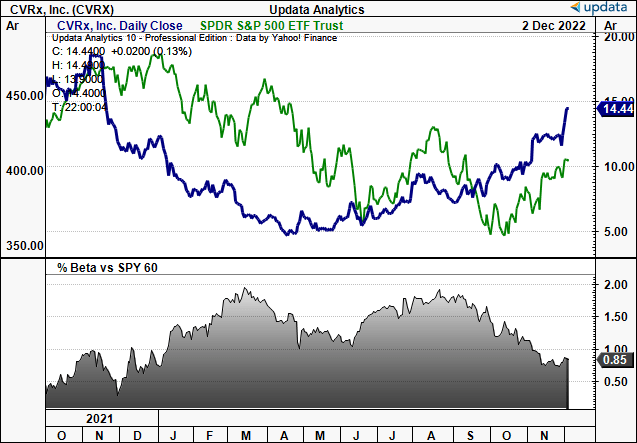
At the same time, treasury yields have cooled off somewhat resulting in longer-dated treasuries to catch a bid since October as well. The stock-bond correlation has rolled over whilst yields have leveled off, however, this still remains a key systematic risk to equity valuations.
This is especially true with the latest employment data coming out of the US last week, suggesting further Fed tightening may be on the cards.
Exhibit 3. Treasuries catching a bid alongside equities in October, yields leveling
Data: Updata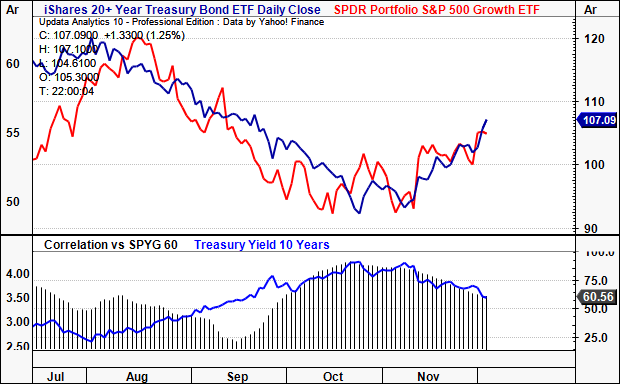
Turning to factor premia, value still retains its positive spread over growth [Exhibit 4]. This has remained in situ from the beginning of the year, with the spread fairly constant in dispersion across the time.
This should be taken in by investors, especially when positioning against growth-type names.
Despite its negative spread, the growth factor has bounced off its lows in October/November as well.
Exhibit 4. Value retains positive spread over growth this year to date.
- Value factor [blue] proxied by SPYV
- Growth factor [red] proxied by SPYG
Note: Rebased to 100 from January 2022. (Data: HBI, Updata)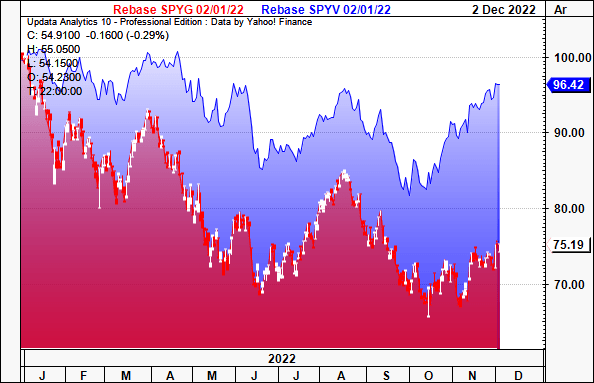
Finally, we’ve seen the USD pullback from its October highs, in what looks to be another positive sign for equities.
Of course, another recessionary tilt is the key upside risk to the USD, especially given the flight to quality seen this year.
Exhibit 5. USD vs. SPX, with the former receding back to Jan FY22′ levels.
Data: Updata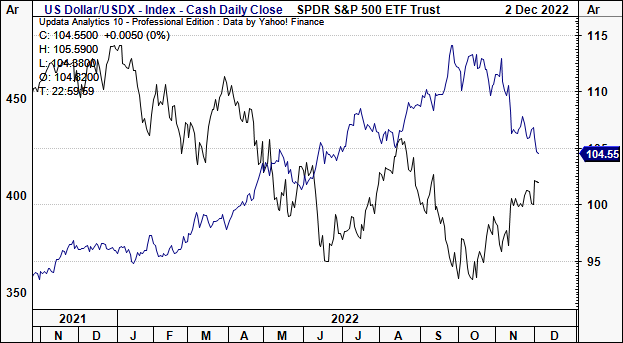
CVRX: The technical picture
One major factor in our revised thesis is CVRX’s technical studies. As seen below, tracing the fibs’ down from the November high, the stock has already retracted 78.6% of the downside move.
It has retained its ascending base and continues to push higher, closing above the April low for 32 weeks in a row now. The next technical target based on the fibonacci levels shown is $19.45, then $47 [not shown]. At the lower bound, this implies a return potential of c.35%. You can see the stock has conformed to these levels on the fibonacci retracement well.
Exhibit 6. Next target based on fibonacci levels: $19.45
Data: Updata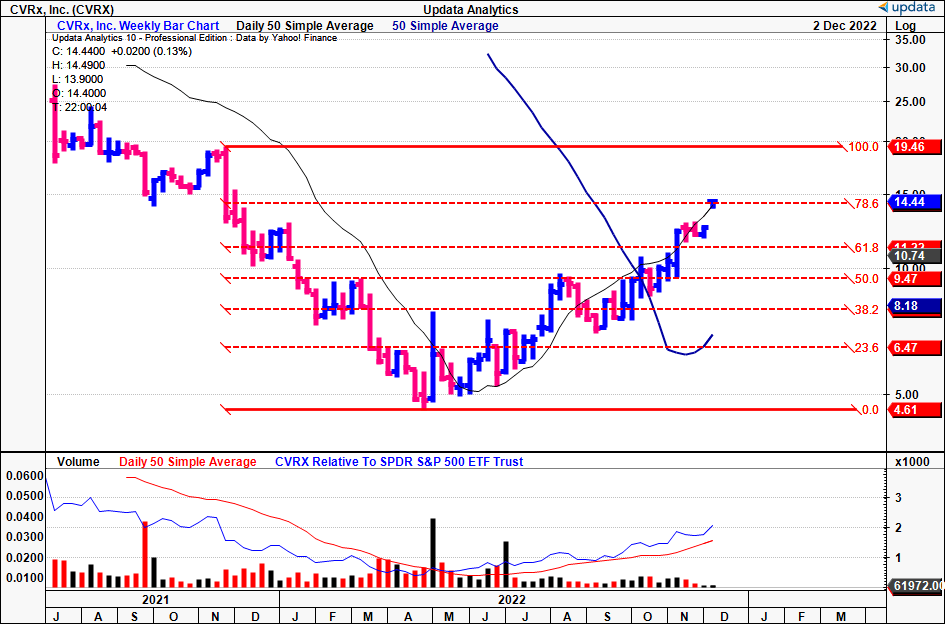
Looking at the trend, we see CVRX trading above cloud support with the lag line well above the cloud as well. It is in fact pulling away from cloud support and the fact it’s set new highs in recent weeks is a very bullish tilt in the risk/reward symmetry.
Moreover, on balance volume (“OBV”) has lifted from its sideways trend with momentum following suit, thereby adding validity to the direction and strength of the trend.
Exhibit 7. Trading above cloud support, cloud blue and widening, OBV and momentum shifting up with accelerated rate of change
Data: Updata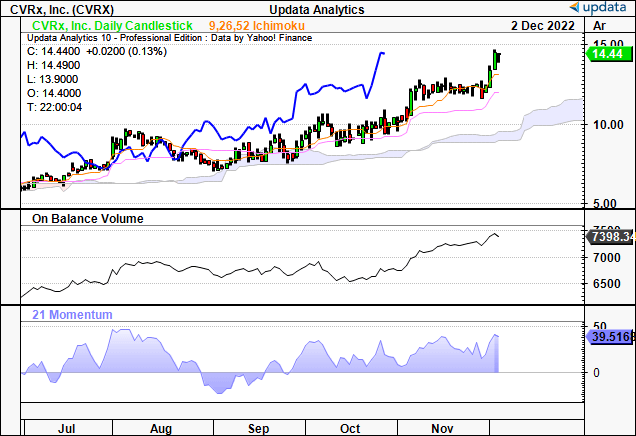
Our point and figure charting is also showing the stock pushing towards the resistance line seen in red below. We had a previous target to $14.50 which has been met, and we therefore look for additional upside targets from this type of analysis with further price action down the line. Right now, we like technical support to $19.45.
Exhibit 8. Upside targets being met, awaiting further confirmation on upside objectives looking ahead.
Data: Updata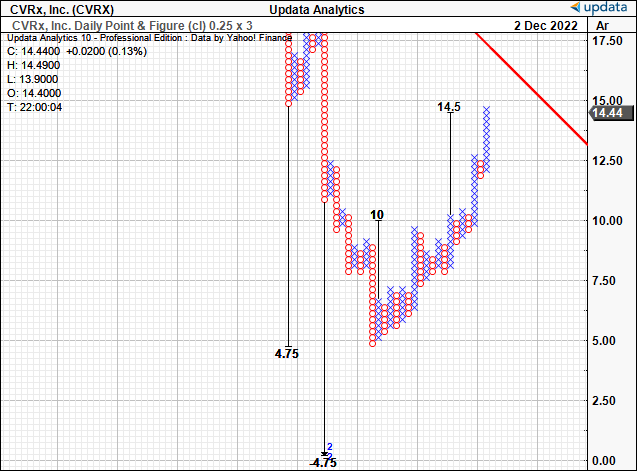
Conclusion
Net-net we revise our rating on CVRX to a buy, as market fundamentals are improving and the latest technical studies indicate the stock has potential to run a further 35% to $19.45 based on our analysis.
Be the first to comment