

deepblue4you
Financial markets are intricately linked, and price action and charts from different asset classes help paint a more complete picture of where money flows are moving towards.
I wrote here that the Forex markets were pointing towards further weakening in the Japanese Yen. As the Yen has been the whipping boy amidst a higher inflation / higher yield narrative due to the Bank of Japan’s stubborn refusal to raise interest rates, Yen weakness would most likely indicate further rise in yields and consequently, the USD.
USD/JPY has since gone on a very strong 2-3 day run, and is now interestingly, testing trendline resistance.
Daily Chart: USD/JPY
Tradingview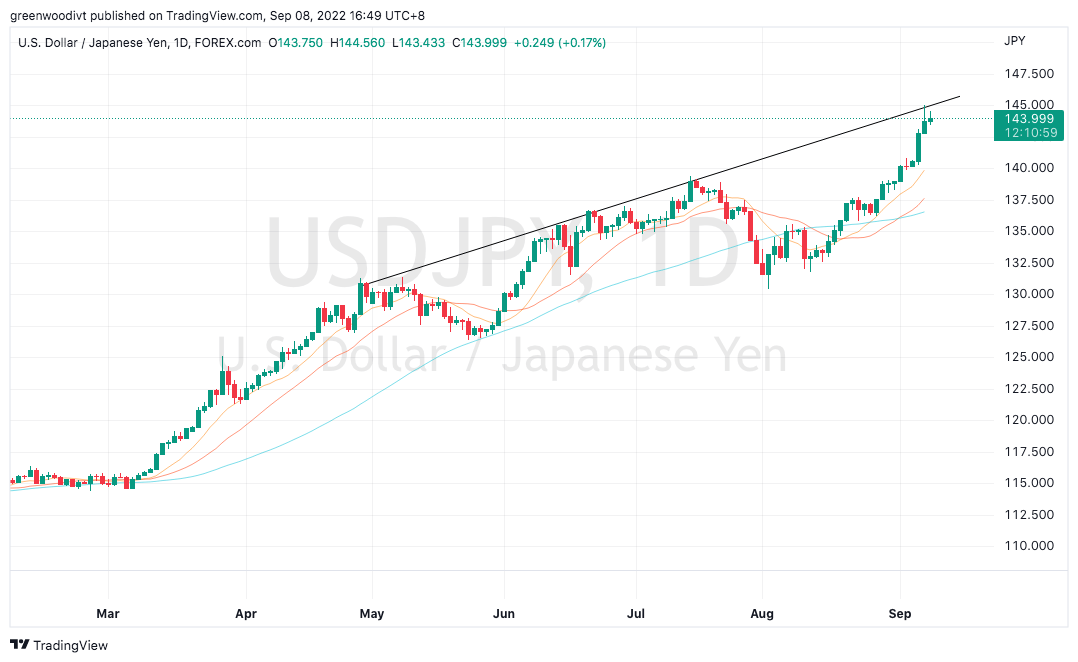
The Yen has weakened against other major currencies as well. Below are the medium term weekly charts of the Yen against the EUR, AUD, CAD, and CHF. These pairs have all gone on to make new 52-week highs (i.e., new 52-week lows for the Yen).
Daily Chart: EUR/JPY
Tradingview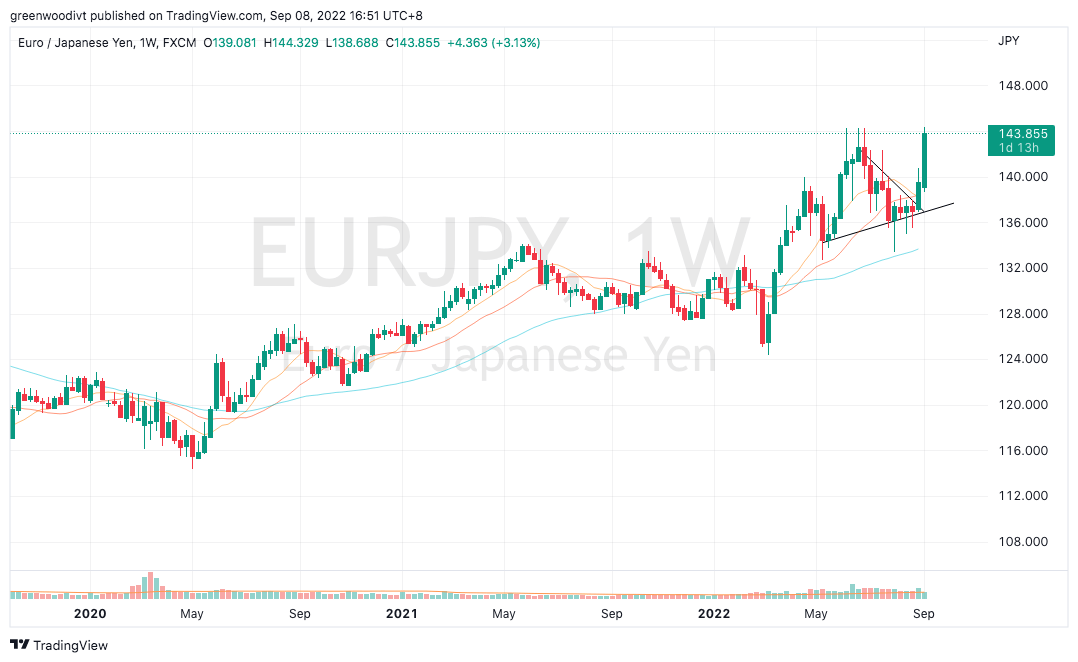
Daily Chart: AUD/JPY
Tradingview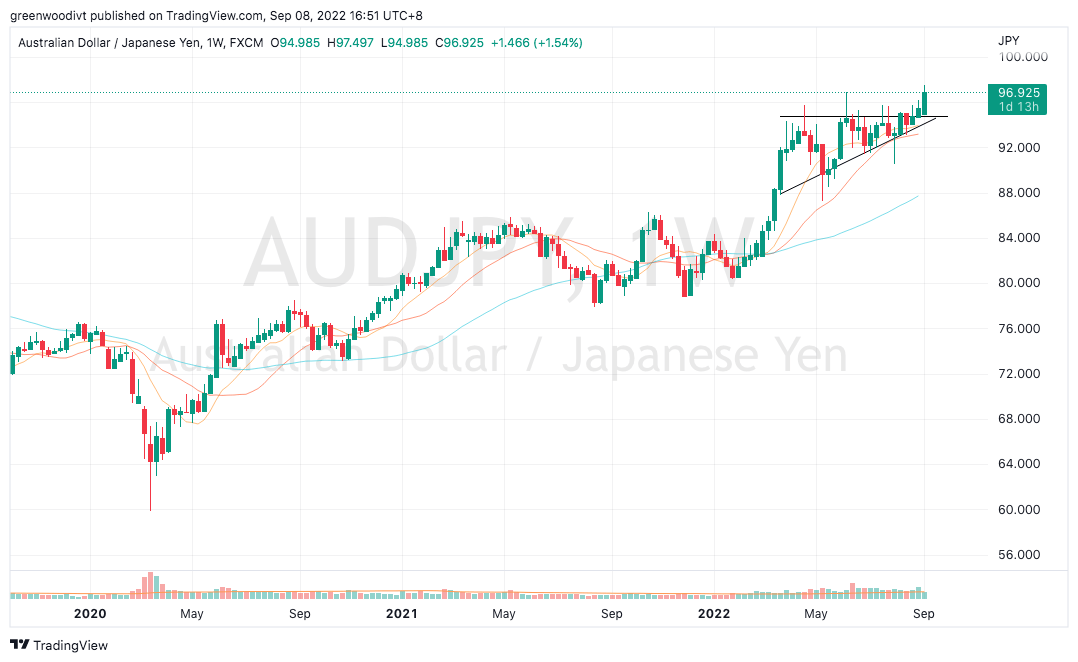
Weekly Chart: CAD/JPY
Tradingview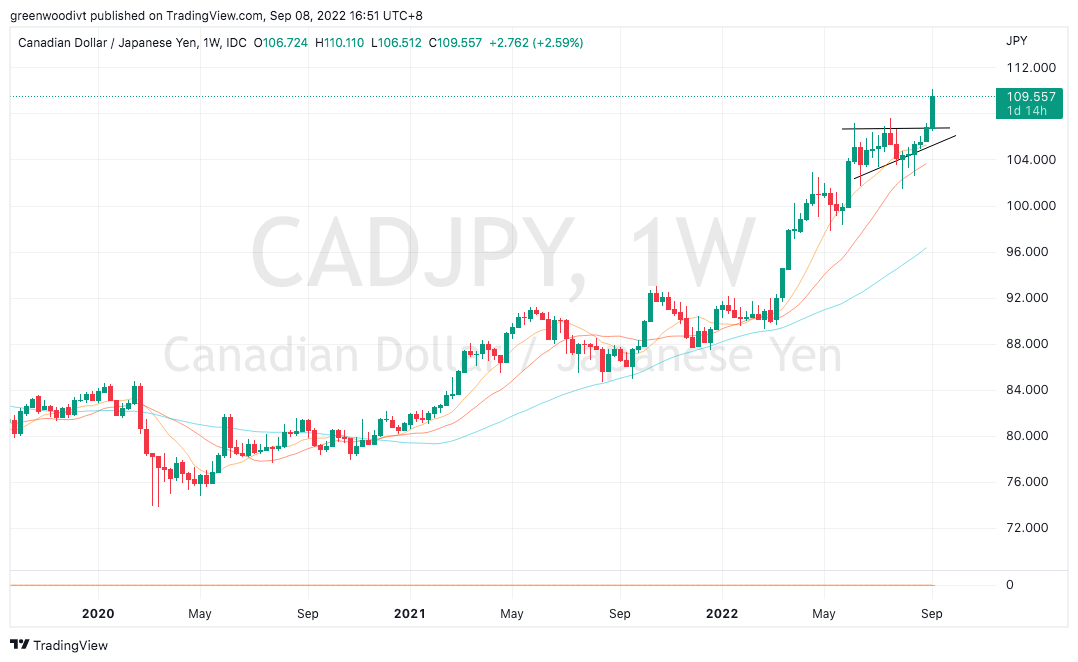
Weekly Chart: CHF/JPY
Tradingview
There is a fresh development brewing in the markets now, that majority of participants may not be anticipating.
Amidst a higher inflation / higher yield narrative, commodity markets are actually facing strong selling pressure. Below is the daily chart of WTI Crude, which shows price breaking down via a number of bearish patterns – one as early as end July, and the second in end August. Despite production cuts by OPEC, the market made new 52-week lows.
Daily Chart: WTI Crude
Tradingview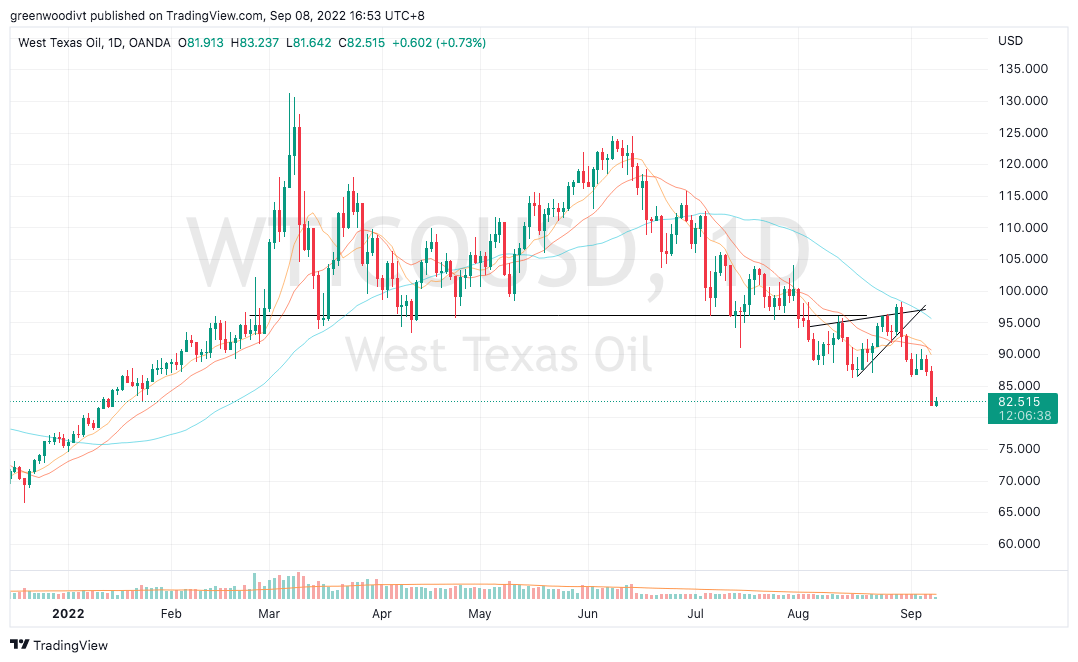
Below is the daily chart of the Commodity Index ETF (DBC), which reflects a diversified portfolio of spot commodity prices from base metals, agriculture, energy and precious metals. Even though the news and media firmly believe that high inflation is here to stay, DBC is actually lurching towards the pivotal neckline of a big 6 month distributive pattern. Break below the neckline, and we can expect further selling in commodity prices. There is a big divergence between news and price action!
Daily Chart: Commodity Index ETF
Tradingview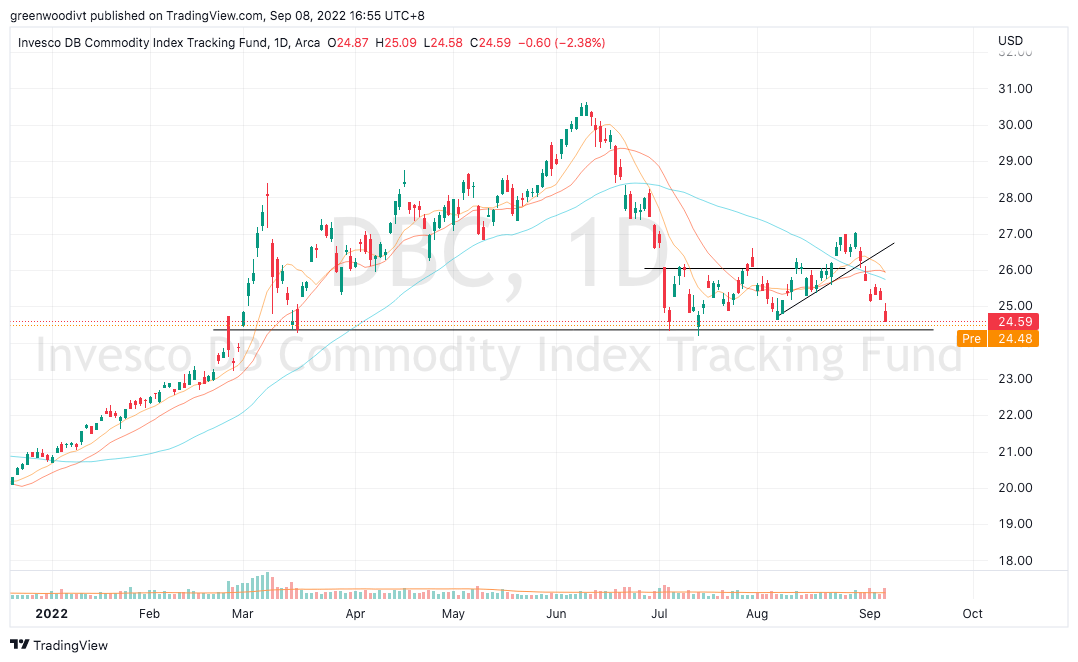
Now, going back to the daily chart of USD/JPY, what happens here at trendline resistance if commodity prices fall further? Lower commodity prices are likely to lead to softer yields and consequently a softer USD. I will be closely watching how this develops.
Daily Chart: USD/JPY
Tradingview
For now, oil & gas explorers (XOP) are still on a clean uptrend. However, there are sufficient clues in the charts to hint at potential trouble.
Weekly Chart: Oil & Gas Exploration ETF
Tradingview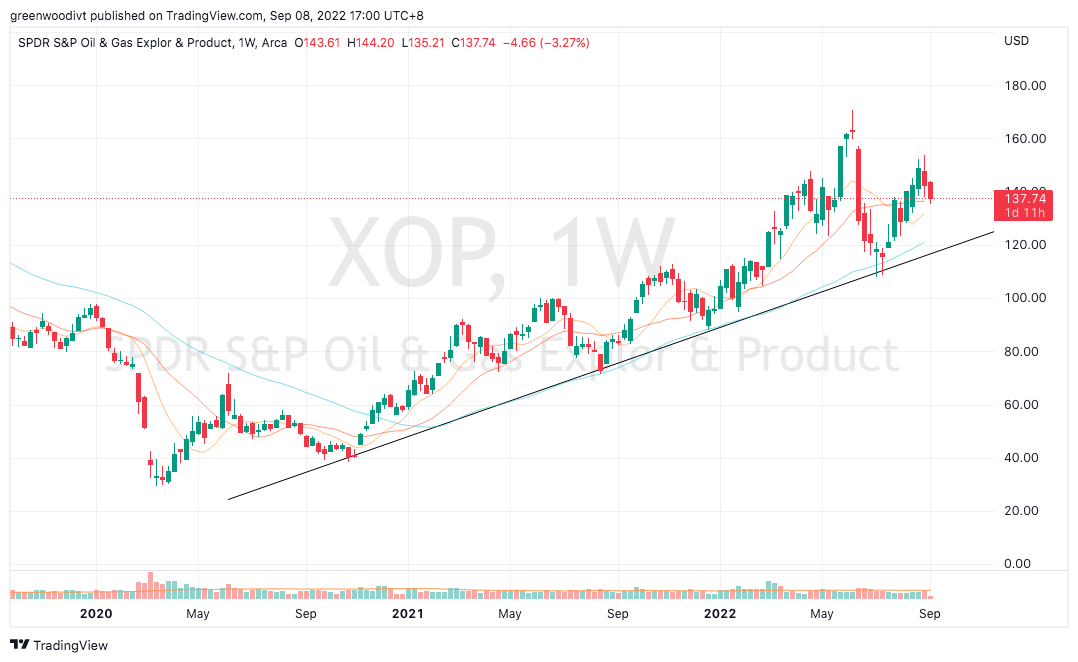
Be the first to comment