

jetcityimage
Cummins (NYSE:NYSE:CMI) shares shot upwards from the COVID-driven lows of early 2020. After closing at a low of $102.76 on March 23, 2020, the shares rose to an all-time high of $275.99 on March 15, 2021. Since then, the shares have been in a steady decline, although they have risen somewhat since the start of July. At the current level, about $214, the shares are 22.5% below the all-time high close in March of 2021. CMI has substantially outperformed the S&P 500 (SPY) year to date, with a total return of 2.7% vs. -13.8% for the S&P 500. Over the last 3 years, CMI’s total return (12.7% per year) has been slightly higher than for SPY (12.2% per year).
Seeking Alpha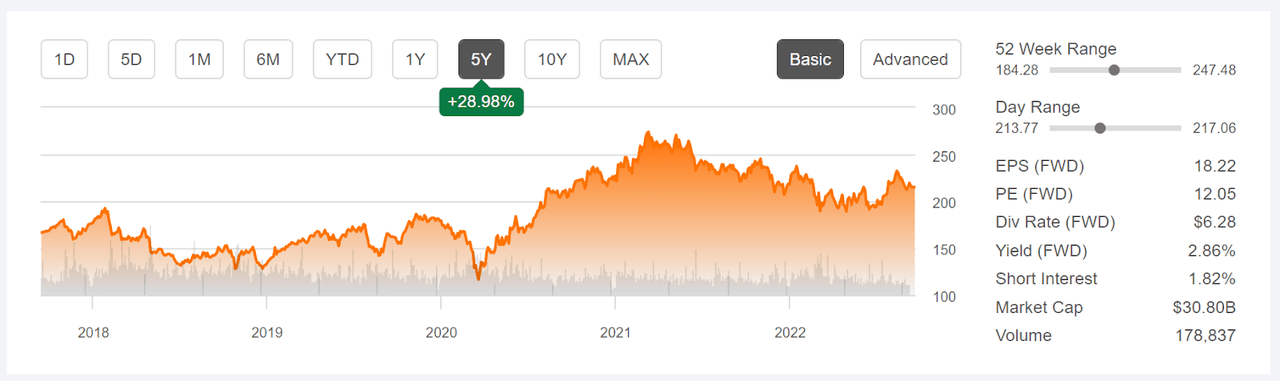
5-Year price history and basic statistics for CMI (Source: Seeking Alpha)
The company’s forward view focuses on the Destination Zero strategy, which is about transitioning the company to a decarbonized future. Cummins’ goal is to reach net zero carbon emissions by 2050. The current manifestations of this strategy include a 15-liter hydrogen engine, planned for full production in 2027, fuel cell engines, and battery electric powertrains. Werner Enterprises (WERN), a trucking and logistics company, recently signed a letter of intent to purchase 500 of Cummins’ 15-liter hydrogen engines.
The variability of CMI’s share price has largely followed earnings. The share price peaked in March of 2021, as earnings were rising to reach a peak of $4.10 per share for Q1 (reported on May 4, 2021) and $4.10 per share for Q2 of 2021 (reported on August 3rd). Quarterly EPS subsequently fell, as did the share price. The company reported very strong earnings for Q2 on August 2, and the share price rose from late July until the middle of August. The consensus outlook is for sustained high earnings, albeit with a small drop for Q3 and Q4 from the Q2 levels.
ETrade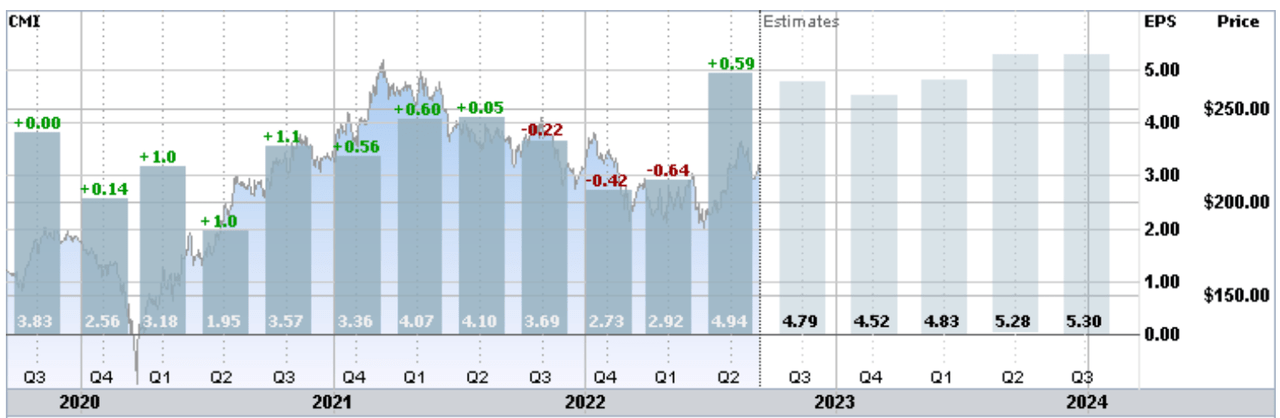
Historical (3 years) and estimated future quarterly EPS for CMI. Green (red) values are amounts by which quarterly EPS beat (missed) the consensus expected value (Source: ETrade)
CMI’s TTM P/E of 14.4 is slightly below the trailing 5-year average. The forward PEG ratio is also slightly below the 5-year average. Overall, then, the valuation looks reasonable. The consensus estimate for EPS growth over the next 3 to 5 years is 9.2% per year, which is solid if unexceptional. The 3-, 5-, and 10-year dividend growth rates are 7.8%, 7.3%, and 13.3% per year. With the forward dividend yield of 2.9%, the Gordon Growth Model suggests that expected total returns in the range of 10% per year are plausible. For context, the trailing 10-year annualized total return for CMI is 10.3% per year.
Along with looking at fundamentals in analyzing a stock, I rely on two forms of consensus outlooks. The first is the well-known Wall Street analyst consensus rating and price target. The second is a probabilistic price forecast implied by the prices of call and put options, the market-implied outlook. The prices of options represent the market’s consensus view on the probability that a stock price will rise (call option) or fall (put option) relative to the option strike price. By calculating the probability distribution of future prices that reconciles the prices of call and put options, the market-implied outlook provides what is effectively the consensus view from buyers and sellers of options. For a deeper explanation and background, I recommend some of the resources listed in the previous link and this monograph published by the CFA Institute.
Wall Street Consensus Outlook for CMI
ETrade calculates the Wall Street consensus outlook for CMI using price targets and ratings from 12 ranked analysts who have published their views over the past 3 months. The consensus rating is a buy, as it has been for most of the past 12 months, and the consensus 12-month price target is 12% above the current share price. There is a fairly high spread among the individual price targets, which reduces confidence in the predictive value of the consensus price target, although this spread is not extreme.
ETrade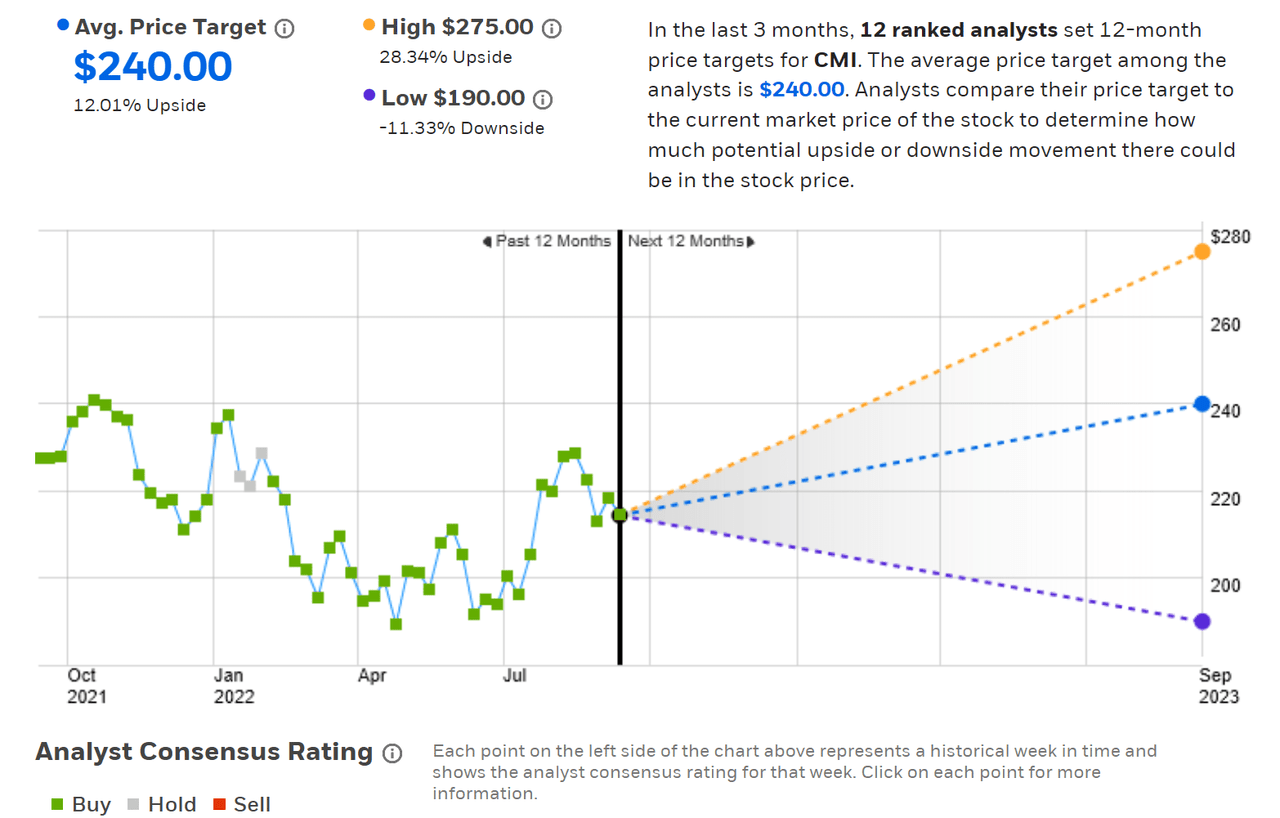
Wall Street analyst consensus rating and 12-month price target for CMI (Source: ETrade)
Seeking Alpha’s version of the Wall Street consensus outlook for CMI is based on the views of 25 analysts who have published price targets and ratings in the last 90 days. The consensus rating is a buy and the consensus 12-month price target is 14.1% above the current share price. The spread in the individual price targets is consistent with the ETrade results.
Seeking Alpha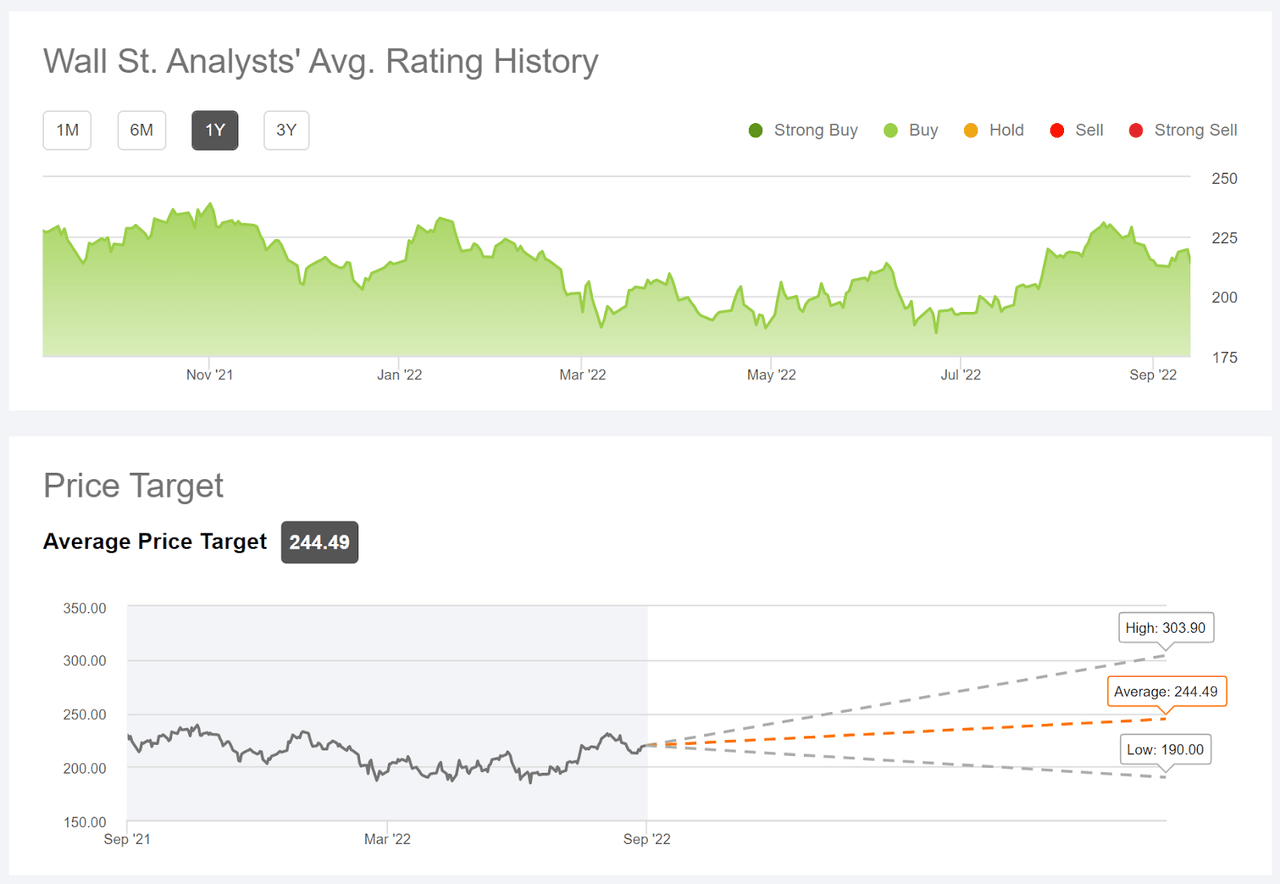
Wall Street analyst consensus rating and 12-month price target for CMI (Source: Seeking Alpha)
These two versions of the Wall Street consensus outlook are very consistent, as one hopes, with a buy rating for CMI and an expected total return of 15.9% (averaging the two consensus price targets) over the next year.
Market-Implied Outlook for CMI
I have calculated the market-implied outlook for CMI for the 4.2-month period from now until January 20, 2023 and for the 9.1-month period from now until June 16, 2023, using the prices of call and put options that expire on each of these dates. I analyzed these 2 expiration dates to provide views to the start and middle of 2023, as well as because the options expiring in January and June tend to be among the most liquid.
The standard presentation of the market-implied outlook is a probability distribution of price return, with probability on the vertical axis and return on the horizontal.
Geoff Considine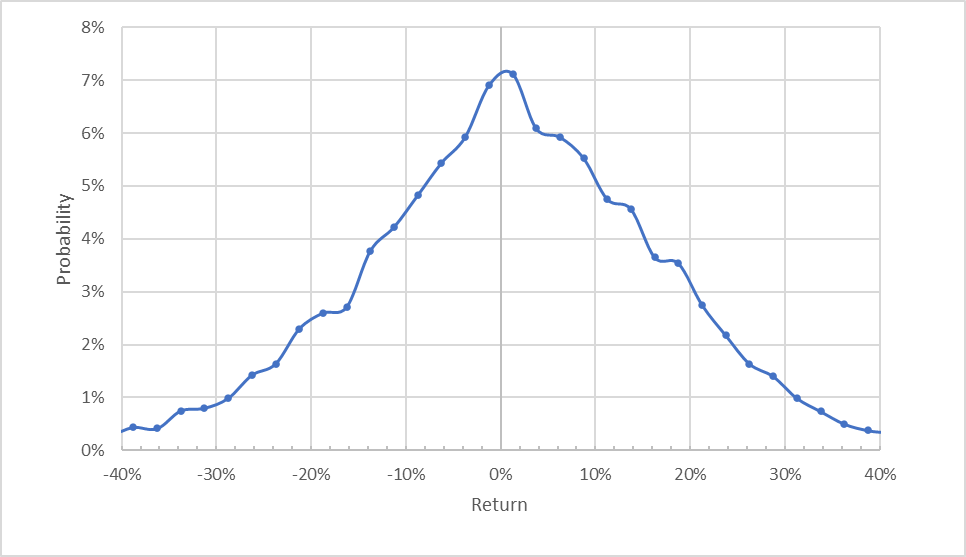
Market-implied price return probabilities for CMI for the 4.2-month period from now until January 20, 2023 (Source: Author’s calculations using options quotes from ETrade)
The market-implied outlook for the next 4.2 months is generally symmetric, with comparable probabilities of positive and negative returns of the same size. The expected volatility calculated from this outlook is 29.7% (annualized). For comparison, ETrade calculates a 27% implied volatility for the options expiring on January 20, 2023.
To make it easier to compare the relative probabilities of positive and negative returns, I rotate the negative return side of the distribution about the vertical axis (see chart below).
Geoff Considine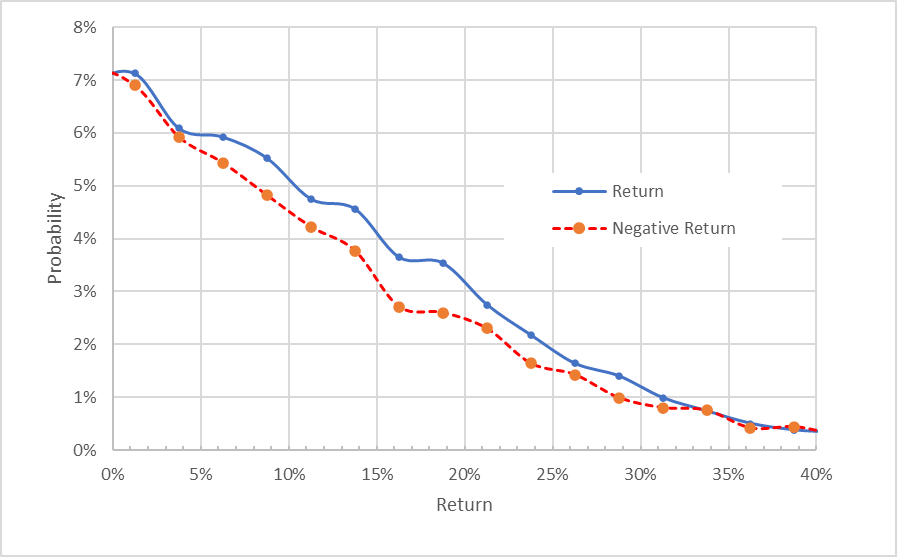
Market-implied price return probabilities for CMI for the 4.2-month period from now until January 20, 2023. The negative return side of the distribution has been rotated about the vertical axis (Source: Author’s calculations using options quotes from ETrade)
This view shows that the probabilities of positive returns are consistently higher than the probabilities of negative returns of the same size (the solid blue line is above the dashed red line over almost all of the chart above). This is a bullish outlook for the next 4.2 months.
Theory indicates that the market-implied outlook is expected to have a negative bias because investors, in aggregate, are risk averse and thus tend to pay more than fair value for downside protection. There is no way to measure the magnitude of this bias, or whether it is even present, however. The expectation of a negative bias reinforces the bullish interpretation of this outlook.
The market-implied outlook for the 9.1-month period from now until June 16, 2023 has probabilities of positive returns that are at or above the probabilities of same-magnitude negative returns. This is less bullish than the shorter-term outlook, but still shows a tilt favoring gains. I interpret this outlook as slightly bullish. The expected volatility calculated from this outlook is 31.7% (annualized).
Geoff Considine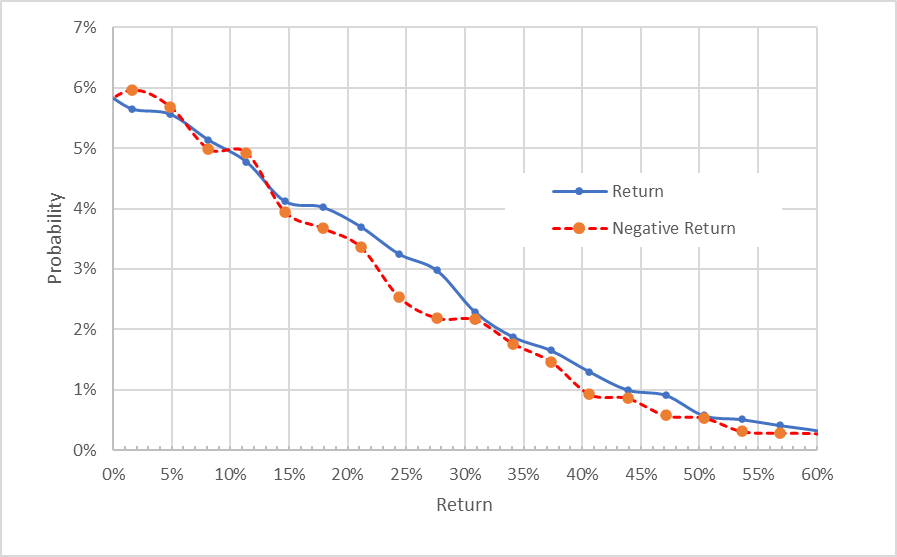
Market-implied price return probabilities for CMI for the 9.1-month period from now until June 16, 2023. The negative return side of the distribution has been rotated about the vertical axis (Source: Author’s calculations using options quotes from ETrade)
The market-implied outlook for CMI to mid-January of 2023 is bullish and the outlook to mid-June of 2023 is slightly bullish. The expected volatility is fairly stable, going from 29.7% for the shorter-term outlook to 31.7% for the longer outlook, for an average of 30.7%.
Summary
Cummins is on a healthy earnings growth trajectory and the valuation is reasonable. Management is emphasizing a focus on hydrogen and battery electric motors. This makes sense in the long term, with an expectation that carbon emissions will be regulated, as well as because investors are currently particularly enthusiastic about clean energy. One need only look at valuations of Tesla (TSLA) and NextEra (NEE), as compared to their more traditional peers, to see how large a premium investors are willing to pay for reducing carbon emissions. The Wall Street consensus rating on CMI is a buy and the consensus 12-month price target implies a 12-month total return of 15.9%. As a rule of thumb for a buy rating, I want to see an expected 12-month total return that is at least ½ the expected annualized volatility (30.7%). Taking the consensus price target at face value, CMI narrowly exceeds this threshold value. The market-implied outlook for CMI is bullish to mid-January of 2023 and slightly bullish to mid-June. I am assigning a buy rating for CMI.
Be the first to comment