

SeventyFour
Why select LSI and CUBE to compare?
Self-storage REITs are intriguing to invest in 2023 as demand remains strong and stock prices dropped from 20% to 46% last year. Bank of America (BAC) analyst Jeffrey Spector advocated self-storage REITs being a quality investment in 2023. Six self-storage REITs are publicly traded: PSA, EXR, CUBE, LSI, NSA, and SELF (listed from largest to smallest market cap). As SELF is a micro-cap, I will not consider it in my analysis.
As an individual investor, I think it is essential to identify a stock with advantages and put money into it. Diversifying your investment into multiple stocks in the same sector is unwise if you have done sufficient research.
In this article, I will compare CubeSmart (NYSE:CUBE) and Life Storage (NYSE:LSI) based on the following reasons:
1. Both are among the best-performing stocks in the sector
CUBE has been the second-best performing stock in the past decade, generating a 10-year total return of 313.66%. LSI also outperformed its peers over the past five years. The stock has provided investors with a 128.44% total return in the period, slightly better than EXR.
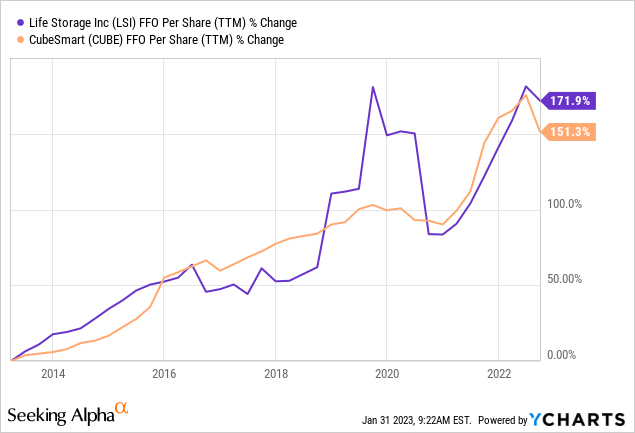
Seeking Alpha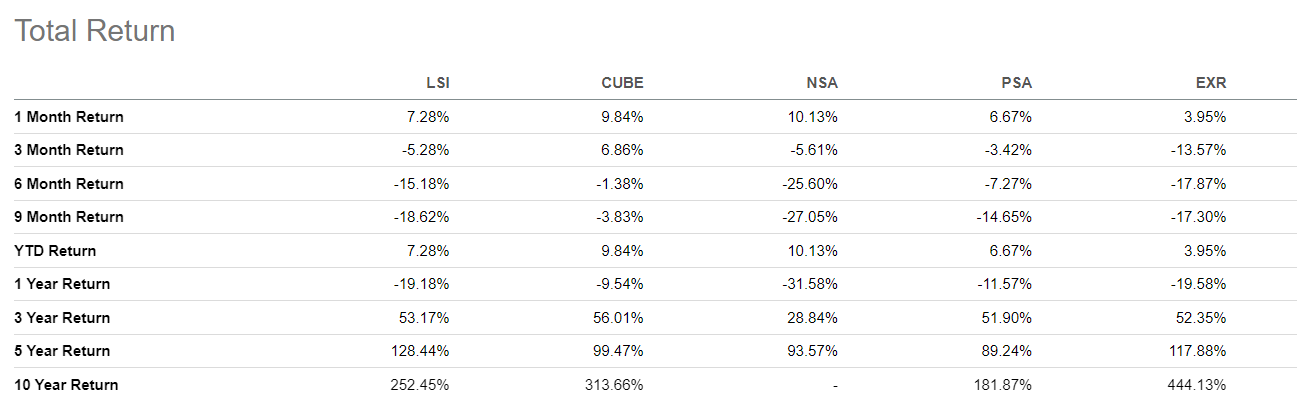
2. Similar dividend yield
Both REITs have a similar level of dividend yield. Last December, CUBE announced an increase in its quarterly dividend payment by 14% to $0.49/share, providing shareholders with a 4.12% dividend yield TTM and a 4.6% yield forward. On the other hand, LSI raised its latest quarterly dividend payment from $1.08 to 1.20. Currently, the REIT has a dividend yield of 4.37% and a 4.72% yield forward.
3. Similar operating scale
CubeSmart owns 611 self-storage properties across the District of Columbia and 24 states, and manages 663 stores for third parties in 38 states. In comparison, Life Storage owns 758 self-storage properties, has 141 properties operating as a joint venture, and manages 268 stores with no ownership interest.
The graph below from EXR shows that CUBE and LSI have 4.4% and 4% market share in the self-storage industry respectively, being the 3rd and 4th largest in the industry.
EXR Investor Presentation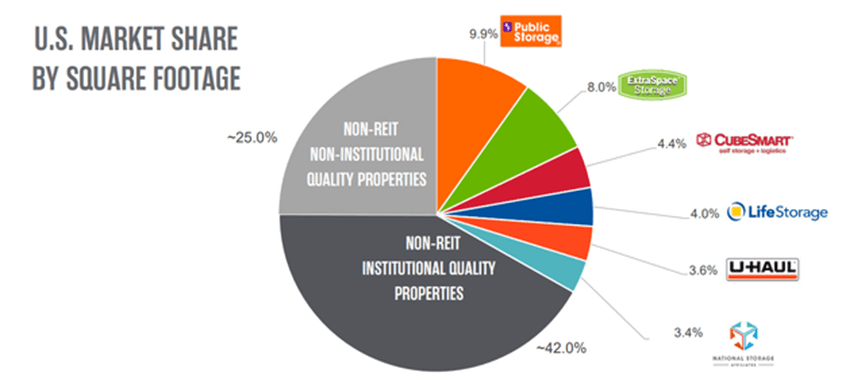
4. Both companies are magnificent businesses
Both companies are investment grade and possess great growth records. Seeking Alpha’s Quant rating gives CUBE an “A-” growth grade, and LSI an “A”.
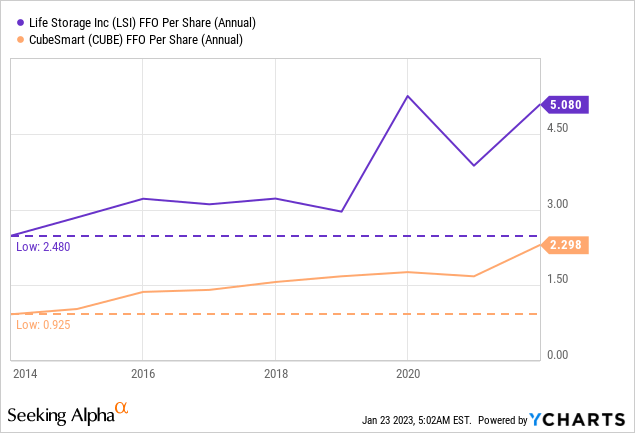
Both REITs significantly outperform their specialized REITs peers. From 2014 to 2022, CUBE grew its FFO per share from 0.93 to 2.23, while LSI’s FFO per share increased from 2.48 to 5.08.
Led by a pessimistic market atmosphere, both stocks retreated about 30% in 2022. Peter Lynch once mentioned in his book “Beating the Street” that stocks declined because they had gotten terrifically overpriced relative to current earnings. So, a 30% decline has led both stocks back below their 5-year P/FFO average, implying that the stocks may be at a discount entering 2023.
Industry Headwinds and Tailwinds
The demand for self-storage is solid and approaching pre-pandemic levels, especially in urban areas.
Urbanization and small living spaces are critical drivers in the self-storage market. The U.S. Census Bureau defines an urban area as “the territory identified according to criteria must encompass at least 2,000 housing units or a population of at least 5,000.” The U.S. urbanization rate has kept rising for several decades. It rose from around 79% in 2000 to almost 83% in 2021.
In urban areas like New York, small homes are in domination. It was estimated that approximately 84% of the housing units in New York are multi-family homes, which have a median size of 1,032 square feet (for rent). As people lack storage spaces at home, self-storage has become one of the popular ways to solve the problem.
Besides, large self-storage players like LSI and CUBE have the pricing power to raise rents amid intense competition. Their short-term leases also enable them to re-price monthly. The below bar chart from LSI shows that the company increased rents by around 15% in both 2021 and 2022. And occupancy rate remains high (91.8% in Oct 2022).
As the company reflected in its latest conference call:
We’re obviously very pleased with where occupancy is today. We’re still above pre-pandemic levels, and we don’t see a lot of new supply coming on.
LSI Investor Presentation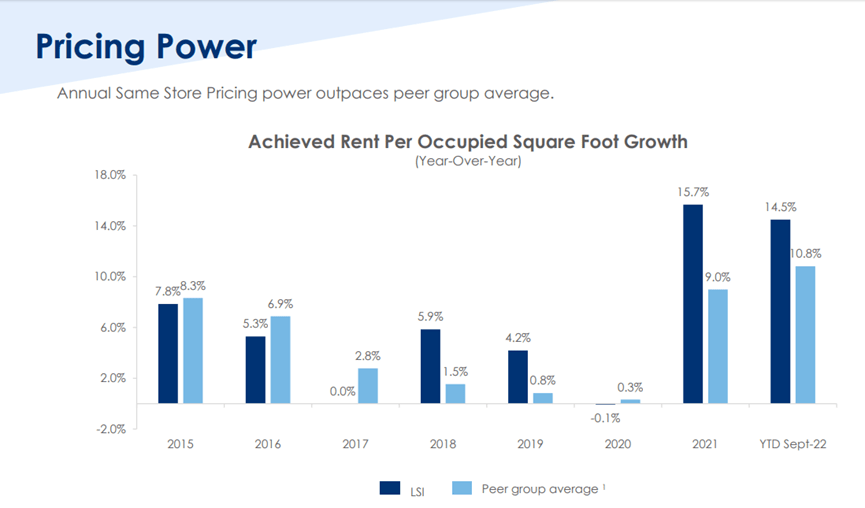
The above factors have contributed to solid self-storage demand over the years. However, I also see two major headwinds that may adversely affect the industry’s ability to grow: competition and Americans’ tendency to move to the suburbs.
Competition in the self-storage industry is intense as it is highly fragmented and comprises of many players. The dominant players in the industry are only accountable for one-third of the total market share. In theory, fierce competition may lead to lower prices and better service quality.
Besides, it was observed that the urbanization growth rate has been slowing down in recent years. During Covid, mega-cities like New York, LA, Chicago, and San Francisco lost more than 700,000 people from mid-2020 to mid-2021, as the work-from-home mode allowed people to work remotely. The trend continues still, and people relocate to search for more affordable and larger homes as mortgage rates surged.
Despite the incredible performance in the past few quarters, CUBE’s CFO believed that the double-digit same-store sales growth rate will not be sustainable. Indeed, Producer Price Index for mini-warehouse and self-storage unit Operators and occupancy rates are ticking downward, which may imply a slowing acceleration of same-store sales growth. LSI recorded more move-outs (63,859) than move-ins (58,051) in 2022 Q3.
Quantitative Comparison
Dividends
Dividends is one of the crucial factors that REIT investors will consider when picking one to invest in. LSI now enjoys a slightly higher dividend yield and growth rate over the past three years, while CUBE has a more consistent dividend growth history and increased its dividend more rapidly than LSI over the past decade.
History showed LSI is more likely to halt dividend hikes as LSI did not increase its dividend in 2019. However, the company has a record of 26 consecutive years of dividend payments. Besides, as tabled below, LSI accelerated its dividend growth rate in recent years and has a lower dividend payout ratio. It would not be surprising to see the yield-on-cost difference to be widened in future.
| LSI | CUBE | |
| Dividend Yield TTM (%) | 4.37% | 4.12% |
| Dividend 3-Year CAGR (%) | 17.13% | 11.13% |
| Dividend 10-Year CAGR (%) | 13.58% | 17.66% |
| Dividend Growth | 3 Years | 12 Years |
| Dividend Payout to FFO | 70% | 73% |
(Source: Author, data from Seeking Alpha)
Balance Sheet
A solid balance sheet is also critical to consistent dividend payments. Both companies are investment-grade (rated Standard & Poor as BBB, and Moody as Baa2).
LSI has no debt maturities until 2024, and 86% of its debt is fixed interest rate.
LSI Investor Presentation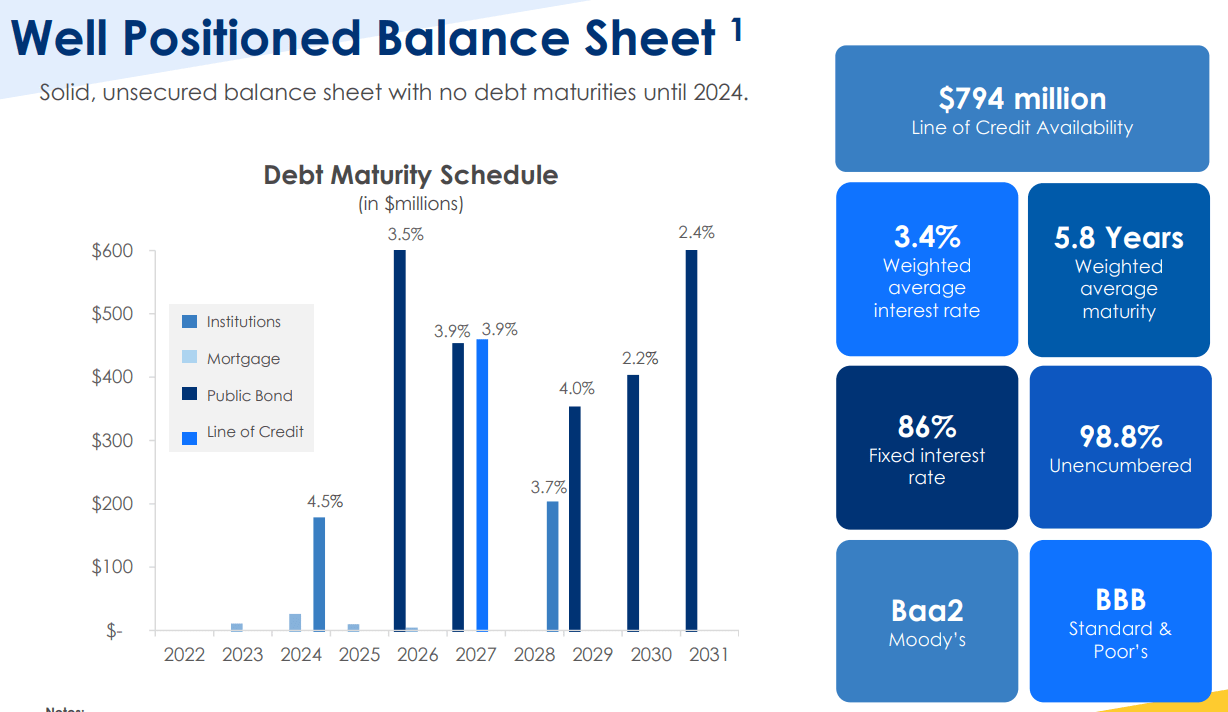
CUBE borrows money from 3 sources: issuing of fixed rates unsecured senior notes, entering an unsecured revolving credit facility with $750 million availability, and mortgage loans.
The weighted average effective interest rate for the three months ended September 30, 2022 was 2.99%, and CUBE has over 90% of its debt being fixed interest rate. Besides, the company has no debt maturities until 2025.
As displayed in the table below, both companies have solid balance sheets. LSI is slightly better in financial health metrics, but CUBE’s cost of borrowing is 41 basis points lower than LSI’s. The latter mentioned in its latest quarterly report that “Based on our outstanding unsecured floating rate debt of $456.0 million at September 30, 2022, a 100 basis point increase in interest rates would have a $4.6 million effect on our annual interest expense”. Thus, a 41 basis points reduction in borrowing cost would save $1.89 million in interest expenses annually, which is approximately 0.5% of LSI’s net income.
| LSI | CUBE | |
| Current Ratio | 0.09 | 0.41 |
| Debt to Asset Ratio | 0.45 | 0.48 |
| Debt to Equity Ratio | 0.9 | 1.08 |
| Equity to Asset Ratio | 0.5 | 0.45 |
(Source: Author, data from Gurufocus)
Growth
As mentioned above, large self-storage REITs have the pricing power to navigate through different economic conditions. Same-store sale is an essential metric to evaluate the organic growth of the company and to determine the effectiveness of the management of a retail chain in producing revenue growth from existing assets.
LSI has a better same-store sales growth rate, but CUBE has a higher occupancy rate. I will put more emphasis on the former as it has a more direct impact on the company’s top line and bottom line.
| LSI | CUBE | |
| Same-store Sales Growth (YoY) (%) | 14.9% | 12.2% |
| Average Occupancy Rate in Q3 2022 | 93.1% | 94.4% |
(Source: Author, data from 2022 Q3 LSI and CUBE Earnings Call)
Besides, LSI is the better-performing company in terms of growth as it achieves better revenue and FFO growth rate over short-term (3-year) and mid-term (10-year).
| LSI | CUBE | |
| Revenue 3-Year CAGR Growth (%) | 20.36% | 15.44% |
| Revenue 10-Year CAGR Growth (%) | 16.63% | 14.46% |
| FFO 3-Year CAGR Growth (%) | 11.34% | 8.76% |
| FFO 10-Year CAGR Growth (%) | 11.76% | 10.78% |
(Source: Author, data from Seeking Alpha)
Qualitative Comparison
Demographics
Over 20% of CUBE’s portfolio is situated in New York as the mega-city has a huge competitive advantage for self-storage operators. The U.S. Census Bureau revealed that New York is the most densely populated city in the U.S., but self-storage supply is way below the country’s average.
The company had located its properties near densely populated areas, where the demand for self-storage should be higher. This offers a huge comparative advantage over other companies. In October 2022, LSI has a 3-mile population density of approximately 92,000, which is about half of CUBE.
CUBE Investor Presentation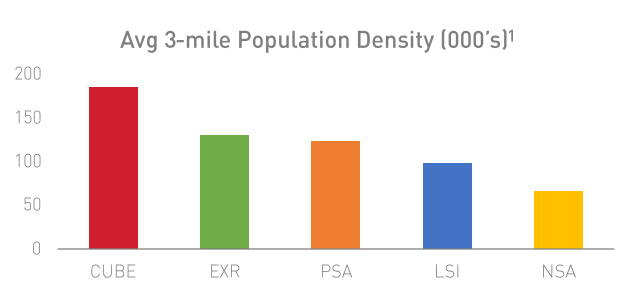
LSI has 49.8% of its revenue from stores situated in the top 10 core-based statistical areas (CBSA), which underperformed CUBE as 59% of its net operating income from the top 10 metropolitan statistical areas (MSA).
Although the operation of LSI is less concentrated in densely populated areas, it accentuates markets with growing demographics. The bar chart below reflected that LSI would be best positioned to enjoy the tailwind from population growth in the coming years.
LSI Investor Presentation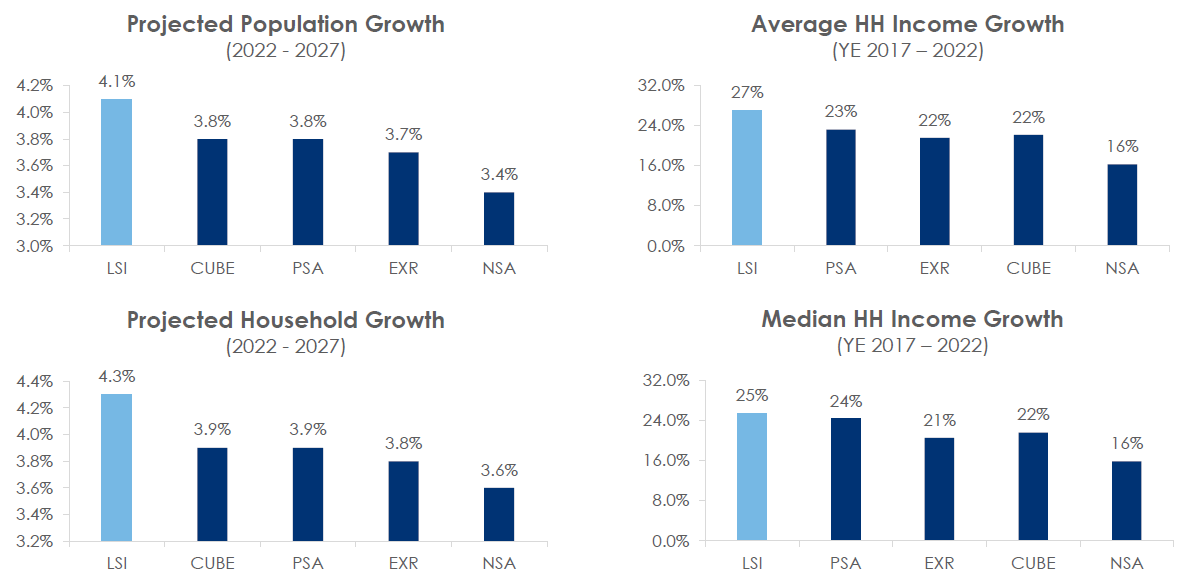
CUBE still has a clear competitive advantage over LSI by locating its stores close to densely populated areas, but the latter may narrow the gap gradually.
Development and Acquisitions
Acquisition activities play an important role in expanding market share and financial performance. CUBE and LSI operate joint ventures and manage third-party platforms, which are potential targets for acquisitions.
Both focus on areas with strong demographics and higher rents. For the first nine months of 2022, CUBE acquired three properties in Washington, San Antonio, and Atlanta, all of which are top 25 MSAs. On the contrary, LSI was much more active in carrying out acquisition activities. The company acquired 43 self-storage facilities during the same period. A majority of the facilities are located in the sunbelt states.
CUBE also partnered with local developers to source quality land and built its self-storage property. The company has a $46.2 million project in New York through a joint venture (CUBE owns a 70% stake), which is expected to be completed in the fourth quarter of 2023. The benefit of developing a self-storage property include the followings:
1. Improve the balance sheet
2. Future rental payment is not necessary
3. The property is purpose-built and more suitable for daily operation
4. Create rental income for the company, which improves cash flow
LSI’s proactive approach to M&A activities has not put the company into a debt spiral. Its balance sheet is comparable with CUBE, but it could be envisaged that LSI would have a faster pace of growth in future years.
Valuation
Subsequent to a 10% to 14% rebound year-to-date, both stocks are still modestly undervalued. As growth is anticipated to slow down in 2023, I believe the market will give both REITs lower multiples. Thus, I will apply a 10% discount on the 5-year average for valuation purposes.
LSI is now trading at a P/FFO (TTM) of 17.01, while CUBE is trading at a P/FFO “TTM” of 18.32 (based on the closing price on 27 January 2023). The fact that CUBE is trading at a higher multiple than LSI may reflect the latter as a better buy right now, given it has outpaced CUBE in growing its business in the last decade.
Below display my bullish and bearish cases of valuation for both REITs, assuming the stocks return to 90% of the current 5-year average P/FFO ratio. The result suggested that LSI is undervalued right now, even with no growth in a recession-anticipated 2023.
| Bullish Case (FFO Growth %) | Bearish Case (EPS Growth %) | |
|
2022 |
27.56% (LSI) 20% (CUBE) |
25% (LSI) 19% (CUBE) |
| 2023 |
6.88% (LSI) 7.3% (CUBE) |
0% (LSI) 0% (CUBE) |
| Fair Value |
$141.6 (LSI) $49.8 (CUBE) |
$129.8 (LSI) $46 (CUBE) |
| Implied Growth |
33.5% (LSI) 11.4% (CUBE) |
22.5% (LSI) 2.9% (CUBE) |
Conclusion
LSI and CUBE are magnificent companies with so many similarities that they are worth a detailed look into. Both companies face similar risks such as competition from other self-storage providers or changes in consumer demand for self-storage services due to economic conditions.
The former is a company with stronger growth and better valuation. Thus, I think LSI will be a better buy in 2023. The company has a solid balance sheet (BBB Grade), accelerated its dividend growth rate and unleashes great growth potential. In terms of valuation, LSI is cheaper than CUBE and would offer a 22.5% to 33.5% return for shareholders in 2023.
Thus, I will give a “Buy” rating to LSI, and give a “Hold” rating to CUBE as the latter lacks a margin of safety.
Please feel free to leave a comment below to discuss your opinion.
Editor’s Note: This article covers one or more microcap stocks. Please be aware of the risks associated with these stocks.
Be the first to comment