

Key Talking Points:
- Amazon denies claims that they will accept Bitcoin by year-end
- Will buyers achieve a follow-through in BTC/USD?
Bitcoin has slumped below $40,000 once again after the biggest crypto jumped over 17% in yesterday’s session after reports that Amazon would accept the digital currency as a form of payment by year-end. There was little foundation to the story other than some source reports but as with many crypto rallies, it only takes a rumor to convince traders to buy Bitcoin and lead into a rally.
But the enthusiasm dried out into the evening as Amazon came out to deny the claims, calling it mere speculation. They did mention that they were interested in the crypto space and would continue exploring options, which has likely helped save some of yesterday’s rally.
BTC/USD1-hour chart
It is interesting to note that within the rally we saw hesitation at the $40,000 mark before extending higher, but even then the push higher only managed another 500 points before reversing, which isn’t much of a range for BTC/USD. This area had previously been a strong resistance since the crypto meltdown back in May so there is no confirmation of further bullish momentum until buyers are able to settle above $40,000. The daily chart is also showing resistance at the 100-DMA which is converging towards the $40,000 mark putting further downside pressure on BTC/USD.
BTC/USD Daily Chart
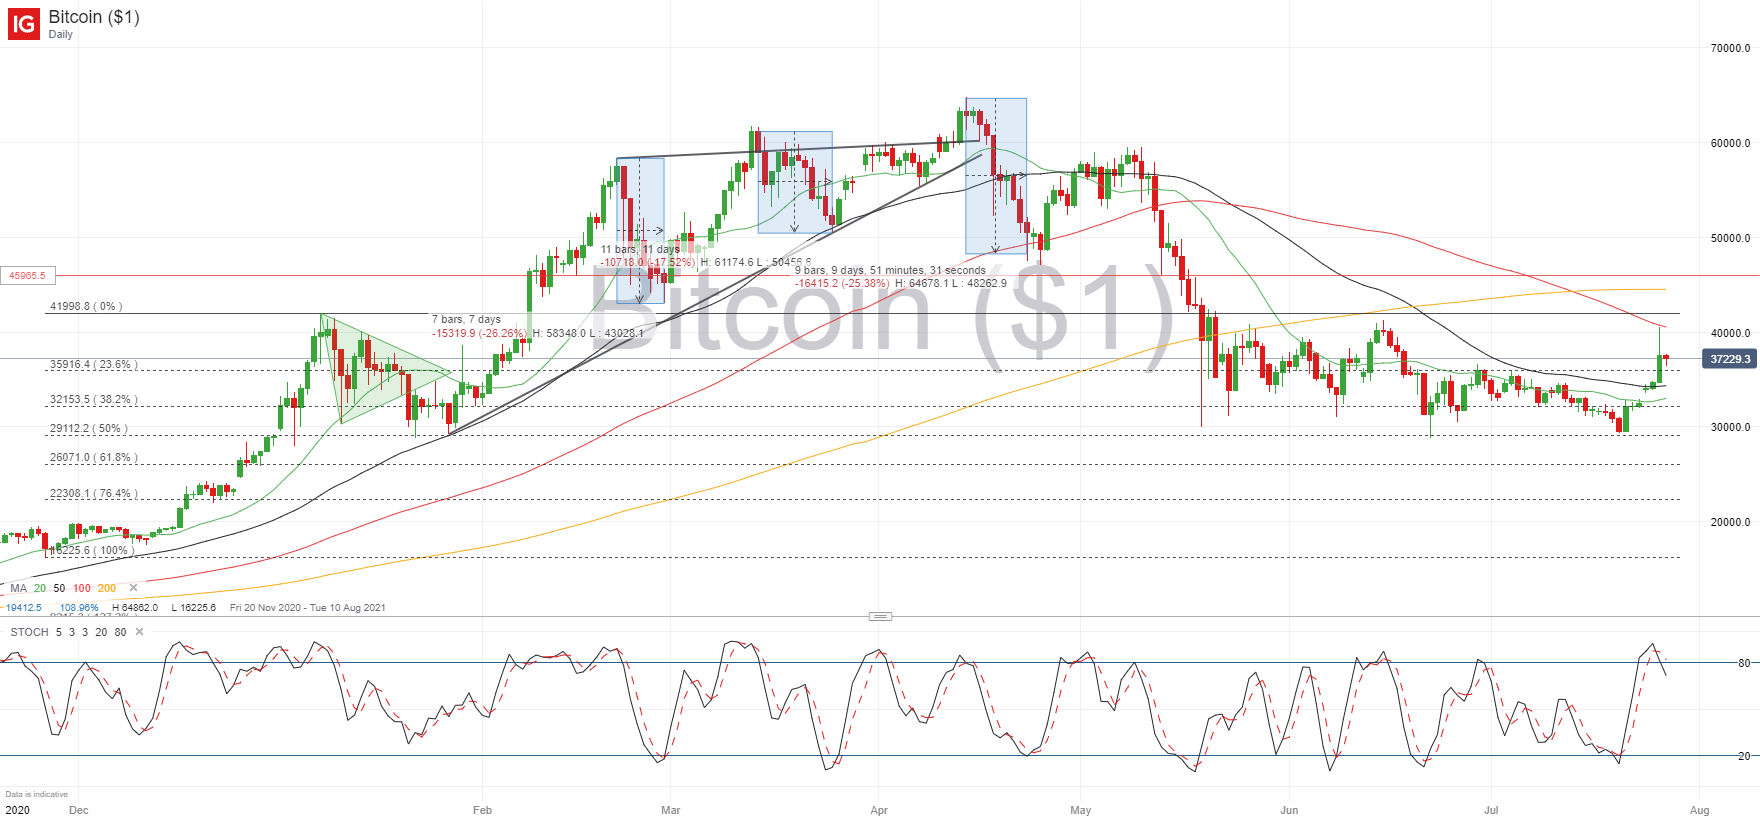
The question now is whether we’re going to see any further follow through to this rally, because new buyers may find it trickier to enter at this level. If the pullback brings BTC/USD even lower then we may see some dip-buying and therefore a possible extension to the rally. If not, sideways consolidation is a big possibility as it continues the recent two-month trend, but a drop below the 38.2% Fibonacci (32,153) could increase the risk of a renewed drop below the $30,000 mark.
How to Read a Candlestick Chart
Learn more about the stock market basics here or download our free trading guides.
— Written by Daniela Sabin Hathorn, Market Analyst
Follow Daniela on Twitter @HathornSabin
Be the first to comment