

remotevfx
One for the bulls and the bears
Despite crypto markets being one of the hardest hit throughout the bear market that has engulfed almost all risk assets over the past 12 months, we have seen crypto not only hold up relatively well since the June lows but indeed be one of the better-performing asset classes. The following chart from Pantera Capital summarises this development well, highlighting crypto’s positive performance relative to the S&P 500, gold and treasuries.
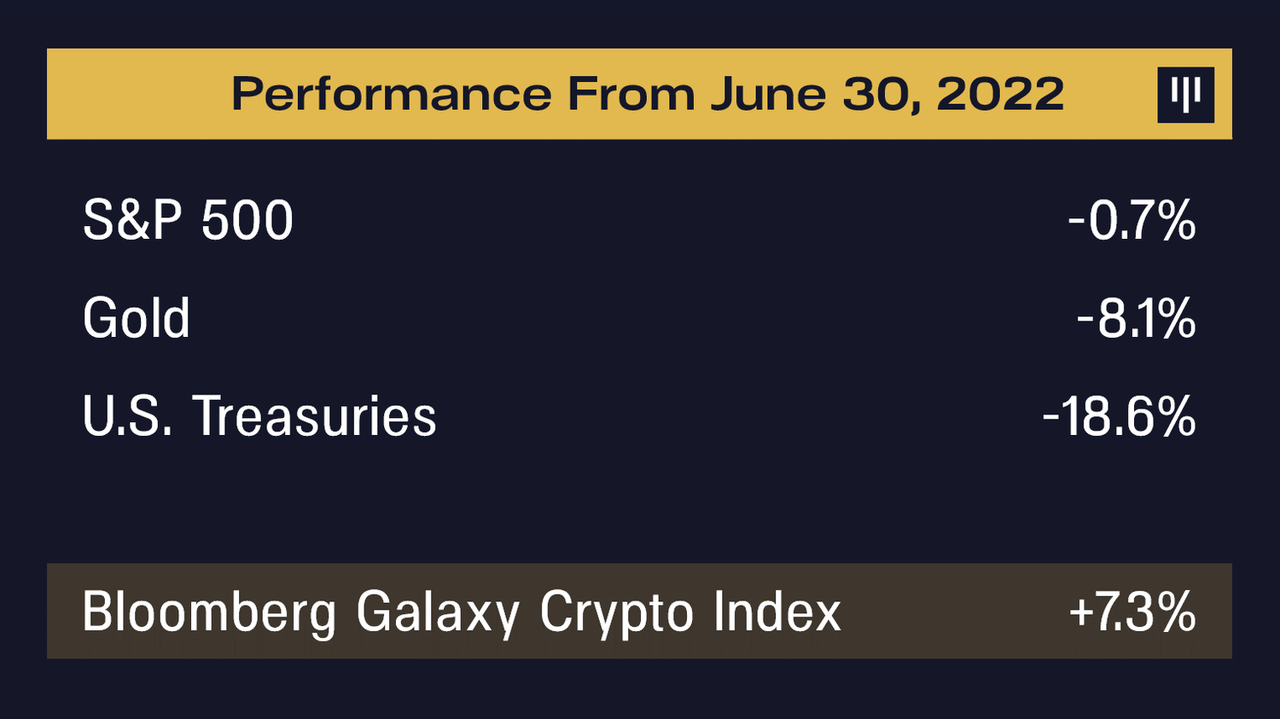
Given how relative outperformance of higher-risk assets tend to precede positive returns in the short term, this could well offer critical insight of things to come as we close out 2022.
Indeed, from a technical perspective there are a number of positive signs suggesting favourable price action in the short term. The $20,000 level for Bitcoin appears to have become an important area of support. This level has held since the June lows with price consolidating thereabouts since, and encouragingly the recent test of this support level has coincided with both a completed 9-13-19 DeMark Sequential buy signal and a positive divergence in momentum (per the RSI). Such developments could easily precede Bitcoin again testing its 200-week moving average, and at the very least portend some form of rally.
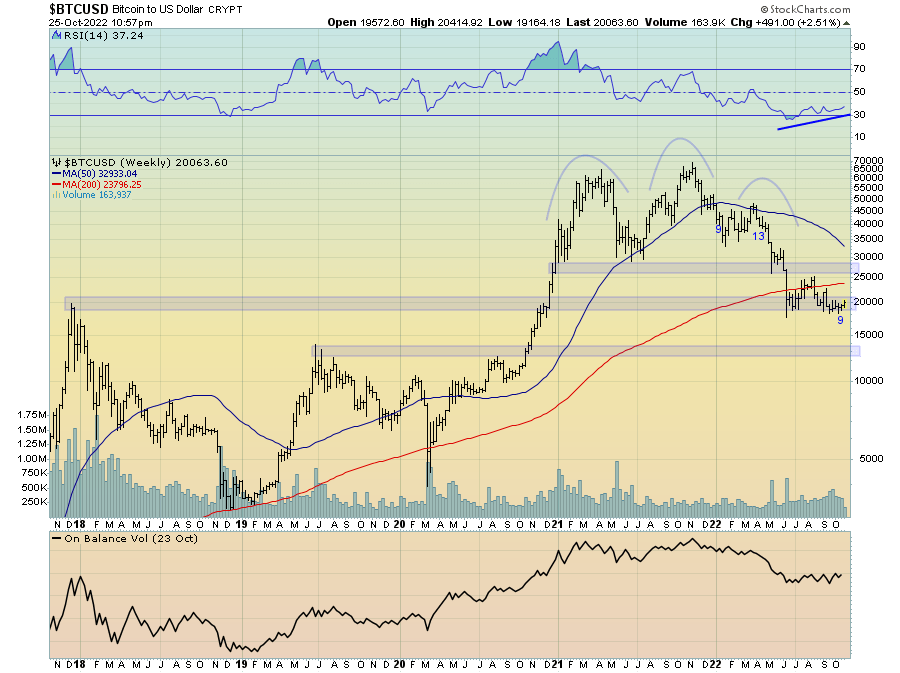
Longer term however, given the macro outlook covered in detail below, I still favour a test of the next area of support down around $14,000 as some form of final capitulation-like event unfolds. Accordingly, investors ought to use any positive price action wisely.
Ethereum too looks poised for a big move either higher or lower in the weeks ahead, having formed a symmetrical wedge pattern. Depending on the sustainability of any short-term rally, a breakout to the downside from this pattern would also coincide with a loss of the 200-week moving average and the $1,300 support level. Such an outcome would point to a move down toward the $500-$750 support area for Ethereum. A break to the upside however could see prices move as high as $2,250 in short order. One way of another, such technical patterns tend to precede volatility.
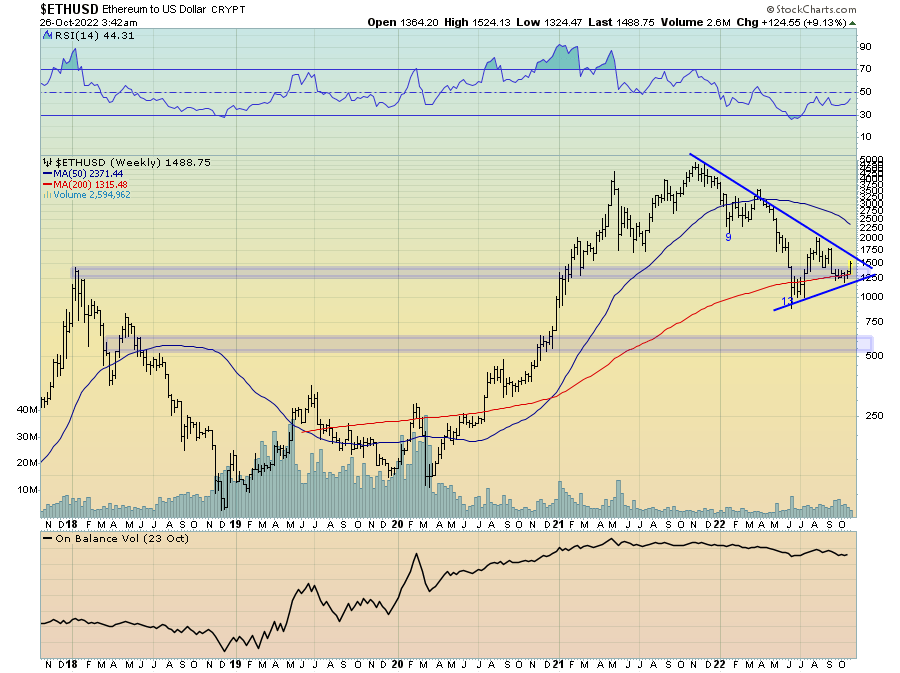
Similar to Bitcoin, given the growth and liquidity outlook I suspect we will eventually see the $500-$750 level to the downside reached at some point, and depending on your outlook for digital assets would likely be an attractive entry point.
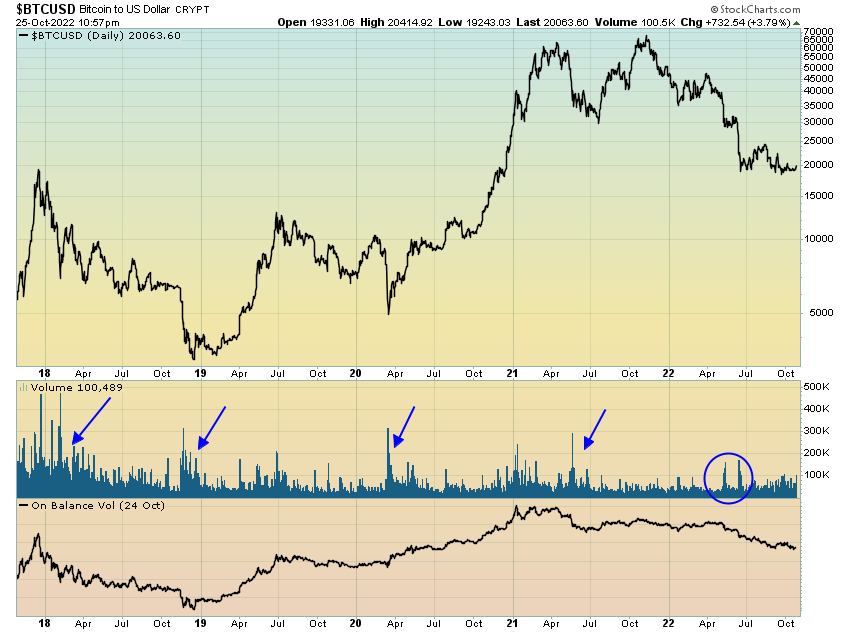
One thing I continue to keep an eye out for to help signal a final bottoming of crypto assets is a capitulation-like spike in volume accompanying a downside move in price. Though we did see a moderate volume spike amid the June lows, it was not to the extent seen during previous cycle bottoms. Whilst not a prerequisite for a market bottom, a significant spike in volume helps to provide comfort that selling pressure has abated and true capitulation occurred.
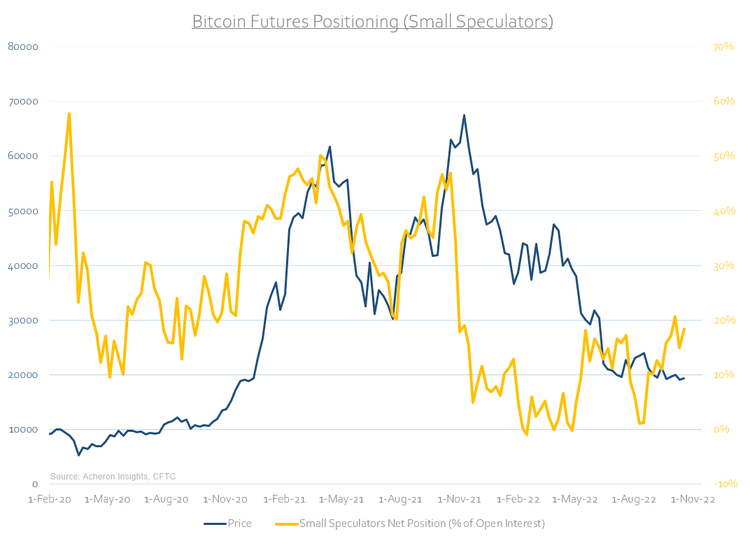
Where the long-term outlook for crypto assets continues to trend in a positive direction is from a sentiment, positioning and on-chain perspective. Indeed, if we look at hedge fund and small speculator positioning in the futures market, both are at or nearing attractive levels. Within the short history of crypto futures markets, the positioning of small speculators (i.e. the dumb money) has tended to be an excellent contrarian indicator, with small speculator positioning as a percentage of open interest generally being elevated at recent market tops. Small speculator positioning has become much less bullish over the past 12 months.
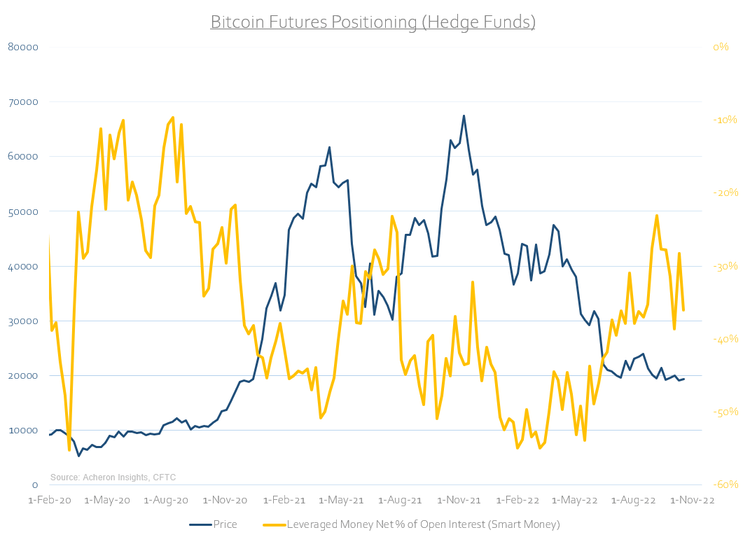
Meanwhile, large speculators (i.e. hedge funds) within the crypto futures space tend act as the “smart money”, unlike most futures markets whereby their positioning tends to serve as a contrarian signal similar to small speculators. Perhaps this is due to crypto hedge funds being more fundamentally and longer-term focused in their trading when it comes to digital assets. Nonetheless, should their futures positioning continue to act as the “smart money”, they are no longer net-short the market to the extent we saw during the May and October highs of last year, an encouraging sign for contrarians.
For long-term bulls, these positioning dynamics should be encouraging. Similarly, several on-chain metrics continue to indicate we are slowly completing the bottoming process whilst also supporting the long-term strength and adoption of the Bitcoin network (and by extension digital assets as a whole). It is from these two viewpoints that I find on-chain analysis valuable.
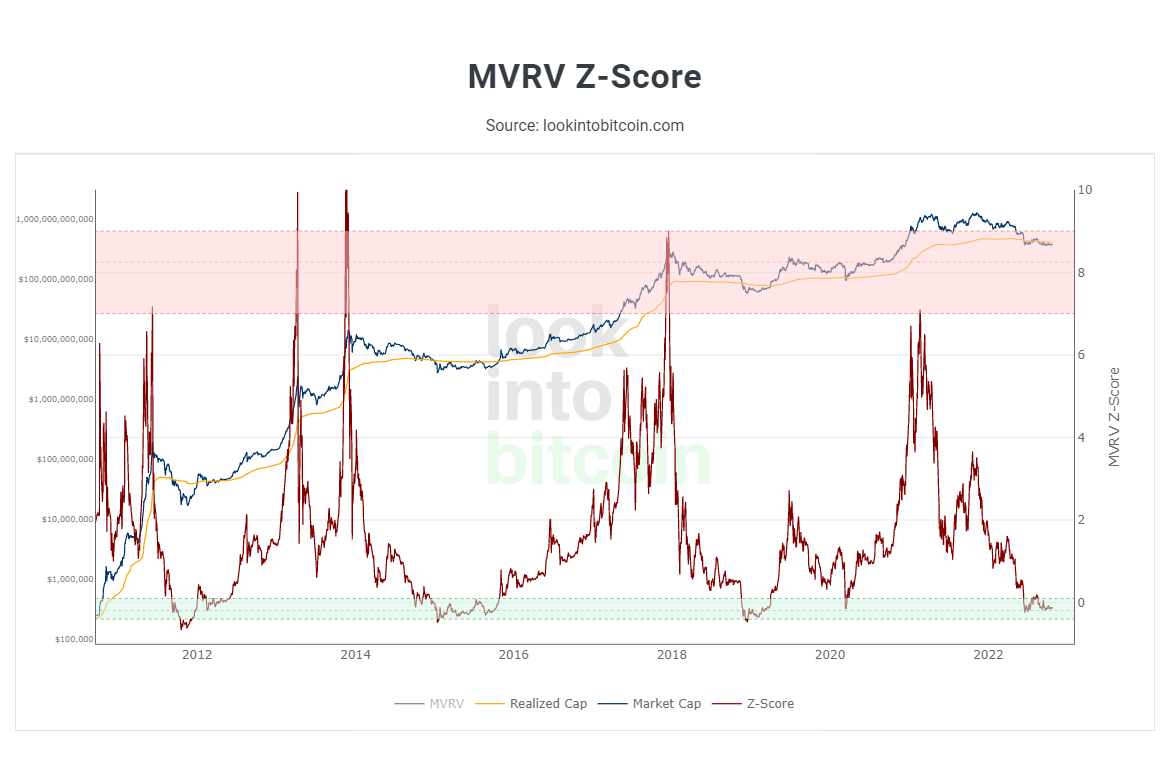
Indeed, if we examine several of the on-chain indicators representative of attractive long-term buying opportunities historically, many are at or near such levels. One such popular measure is the Market Value to Realised Value (MVRV) ratio, which serves as a proxy for the average profit or loss position of investors and has reached the “buy zone” on a z-score basis.
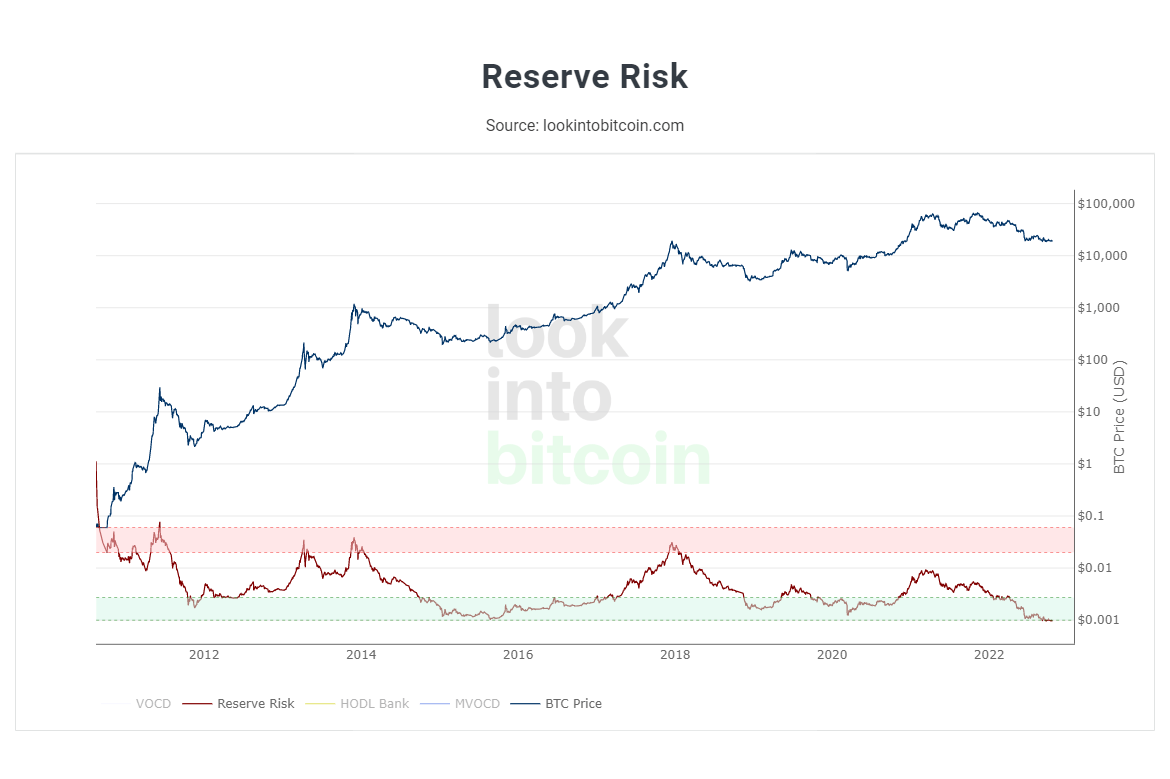
Another is the Reserve Risk indicator, which measures the confidence of long-term holders relative to the price of the native coin at any given point in time. When confidence of long-term holders is high and price is low, there is an attractive risk/reward to invest (i.e. Reserve Risk is low). Conversely, when long-term holder confidence is low and price is high then the risk/reward setup may be unattractive (i.e. Reserve Risk is high). Currently the Reserve Risk reading is near its lowest in history.
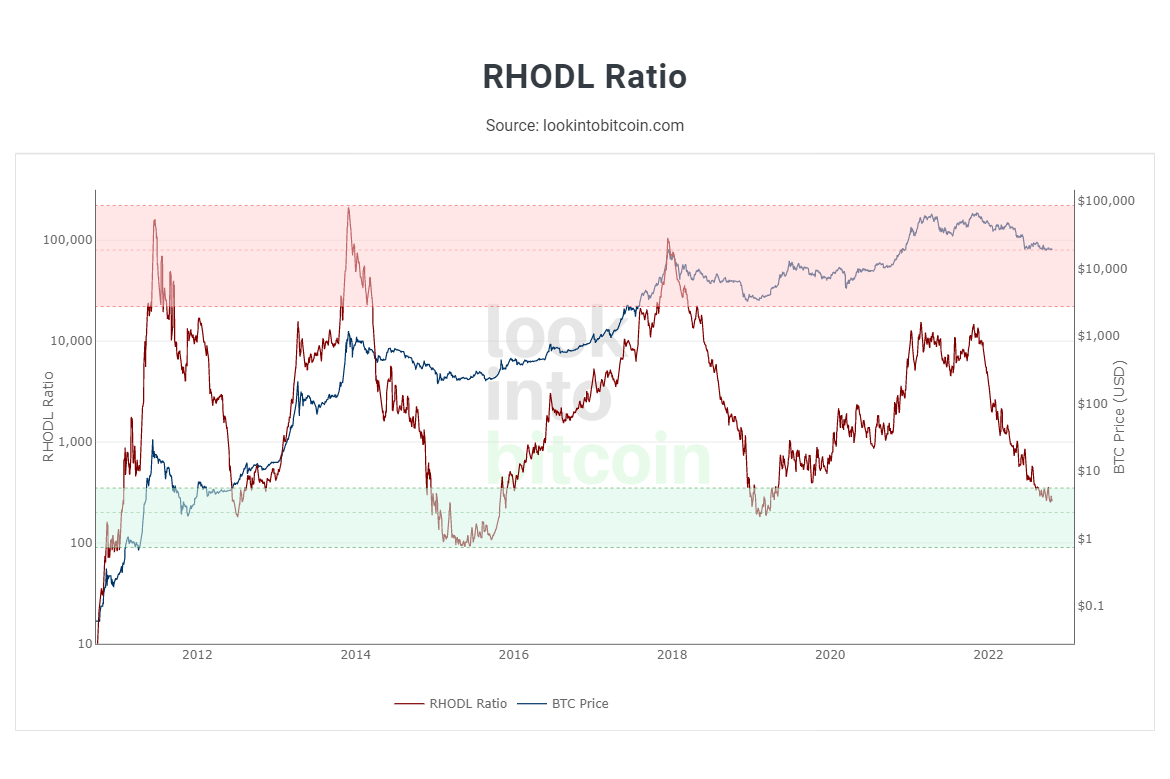
And finally, the Realised HODL Ratio (detailed here) is also reaching attractive long-term buy levels.
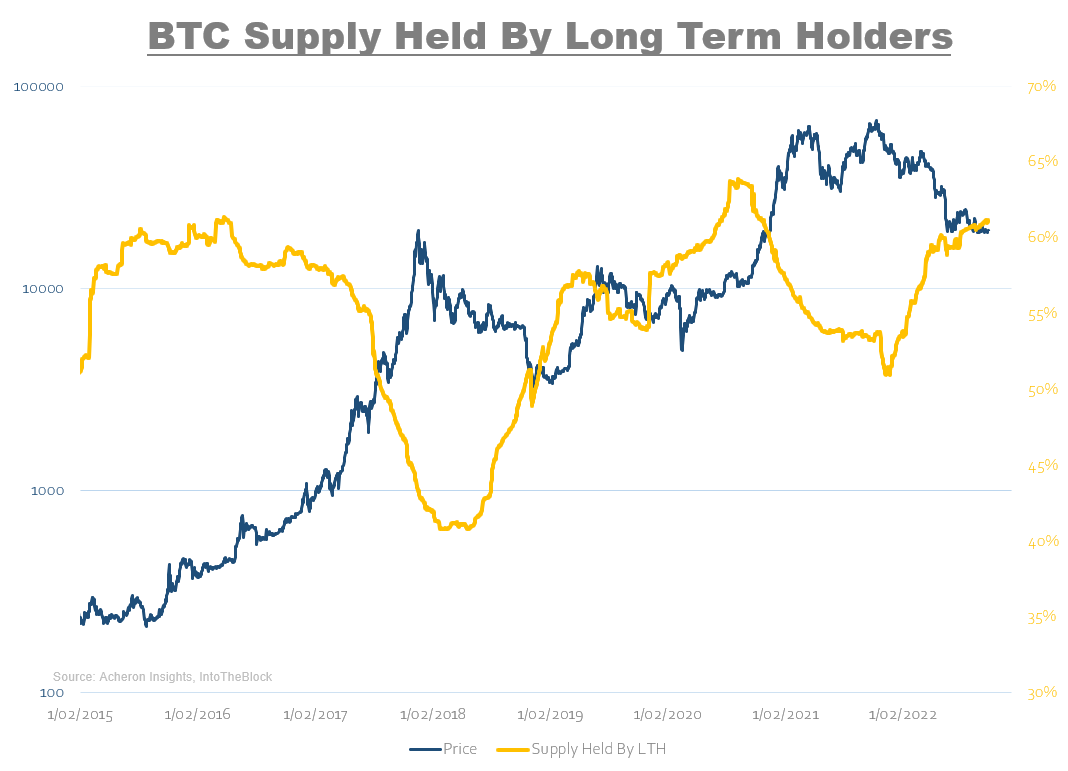
In terms of network activity, adoption and the activity of long-term holders, all continue to trend in a positive direction. If we look at the percentage of Bitcoin supply held by long-term holders (i.e. those who have retained their holdings for over one year), these investors continue to increase their positions in a similar manner to what occurred during previous bear markets.
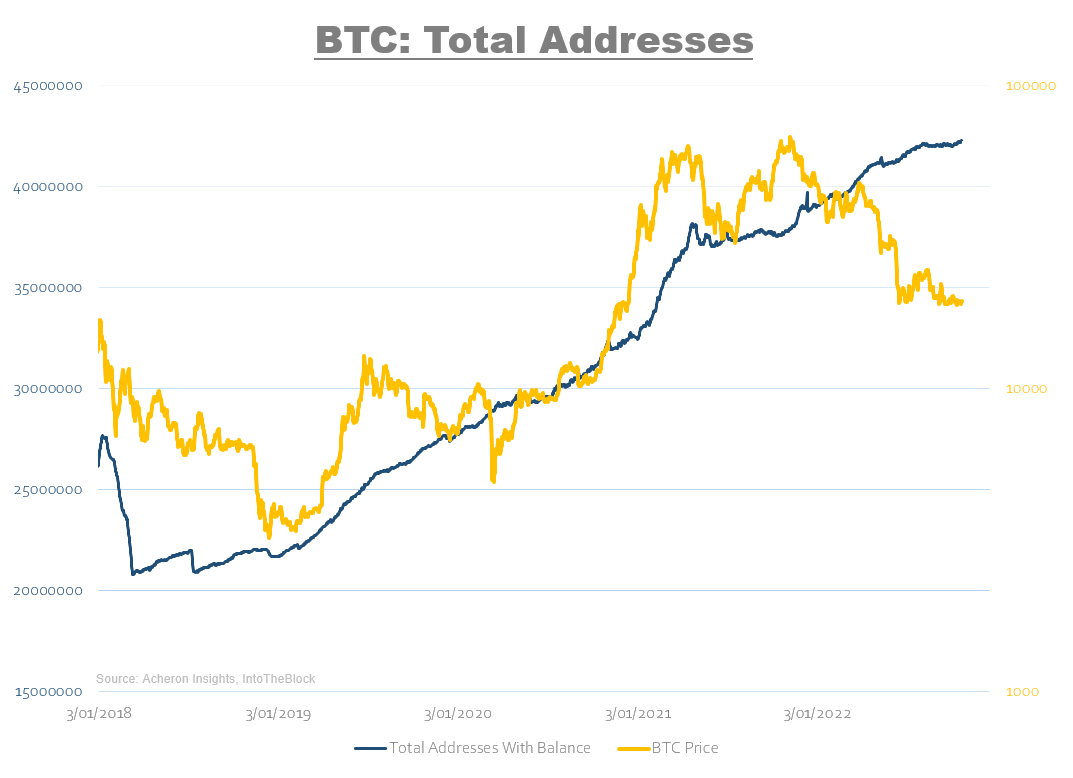
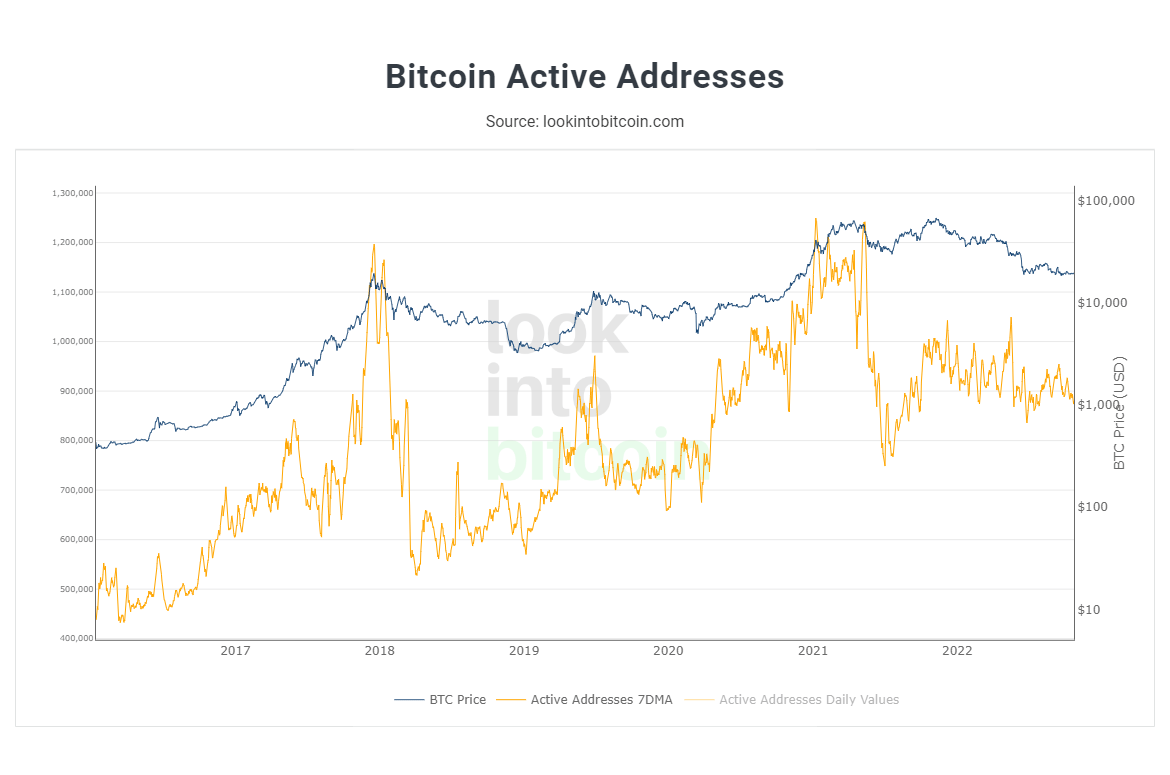
In similar fashion total addresses utilising the Bitcoin network continue to trend positively despite the recent sell-off. This is certainly a favourable trend for the long-term viability and adoption of digital assets.
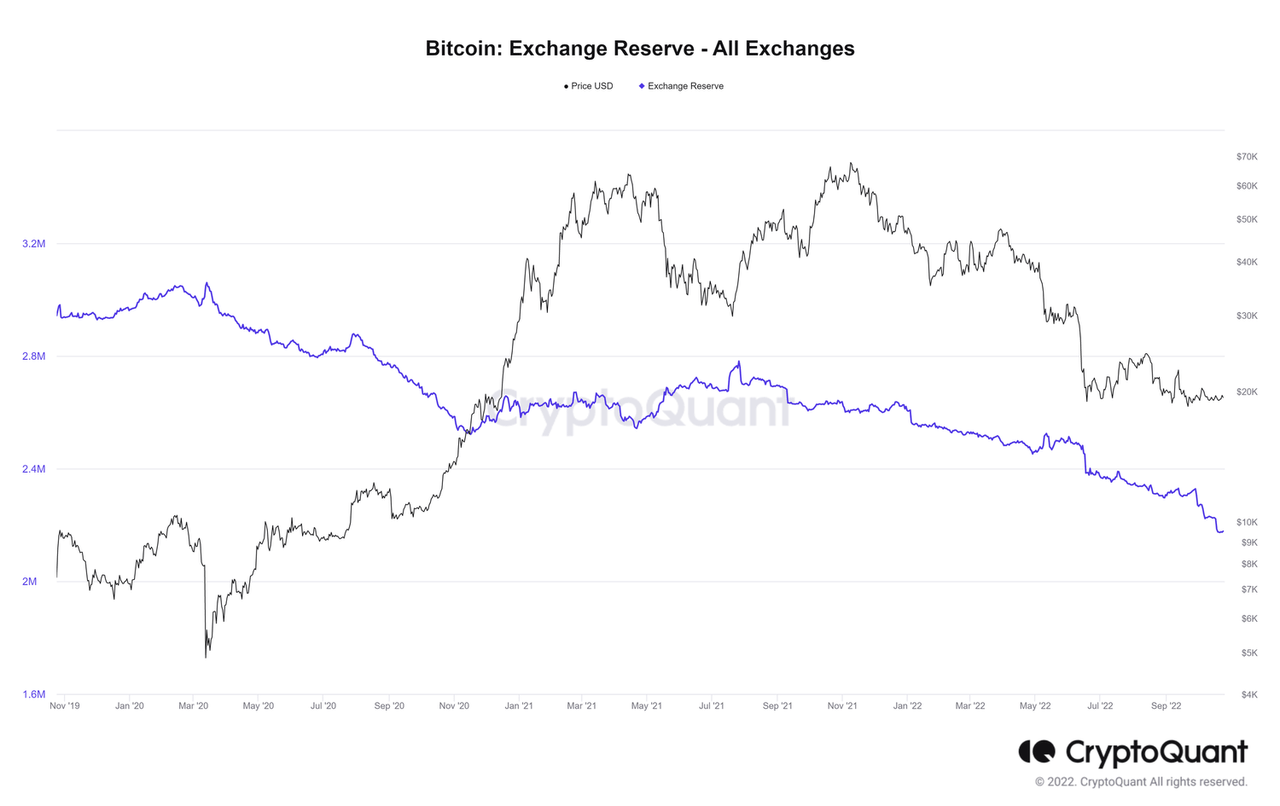
Likewise, balances held on exchanges continues to trend downward. Whilst some of these flows off-exchange are likely to be attributed to the use of crypto assets on other platforms, this downward trend does point to continued accumulation by long-term holders who are moving purchases off-exchange and into cold storage.
Despite these encouraging trends however we must remember that sentiment, positioning and on-chain indicators such as these should never be solely relied upon when making investment decisions, particularly in a high-beta asset class such as crypto. While these measures are seemingly at or near levels indicative of prior market bottoms or attractive entry points, we must remember they can remain at these levels for a prolonged period time, with the 2015 being an excellent example. As I will detail shortly, the economic, liquidity and business cycle dynamics are of greater importance for investors who are unable to stomach the extreme volatility of such a market. It is best to be long risk with the growth and liquidity cycles as tailwinds, not headwinds.
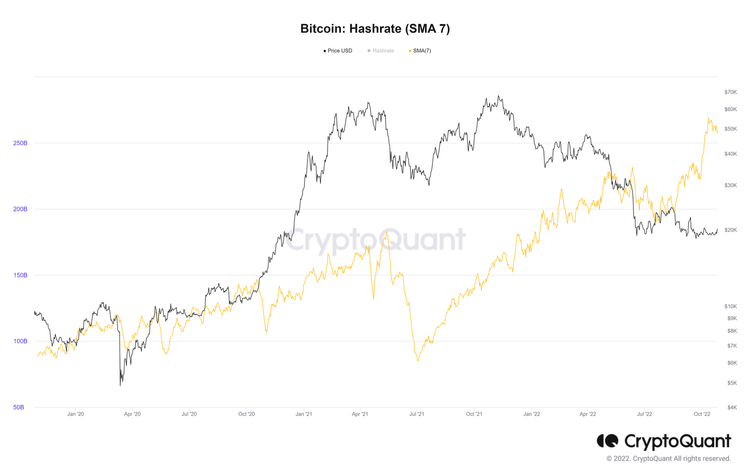
Indeed, during periods when these aforementioned cycles are headwinds, downside risk is ever present. Indeed, one such risk to the market right now is the predicament Bitcoin miners currently find themselves in. With Bitcoin’s hash rate and difficulty adjustment trending higher during this sell-off, this means the environment for miners has become far more competitive and less profitable as both the cost of mining has risen as the reward for mining fallen, dynamics which we can observe below.
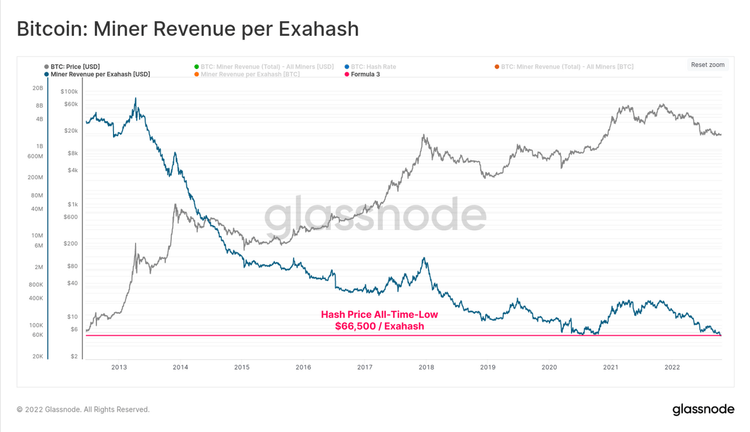
As a result, we are nearing levels whereby the price of Bitcoin is no longer above the miners cost of production, and as a such are beginning to see miners sell-off some of their Bitcoin reserves in order to cover costs. This dynamic presents significant downside risk for digital assets over the medium term should prices fall below the $19,000-$20,000 area, at which point the miner capitulation would seemingly occur and usher in further downside.
Turning now to the growth and liquidity cycle outlook, as I have mentioned both suggest now is not the time to be overweight digital assets as they are indicating further downside appears inevitable over the coming quarters. As I detailed here, the outlook for the business cycle is poor with nearly all short and long-term leading economic and liquidity indicators pointing down. With peaking inflation seemingly upon us and the growth deceleration set to continue, we know historically this is an environment not suited to high-beta risk assets to which crypto can be classified. Do not expect this time to be different.
Source: Hedgeye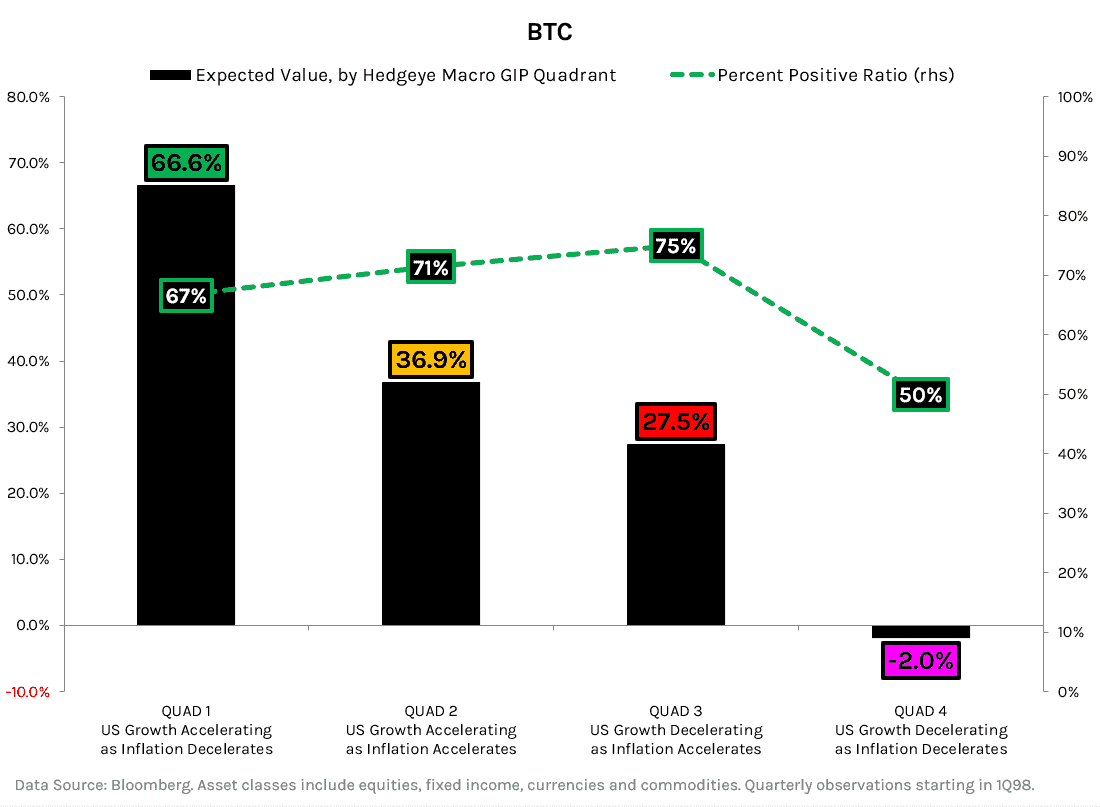
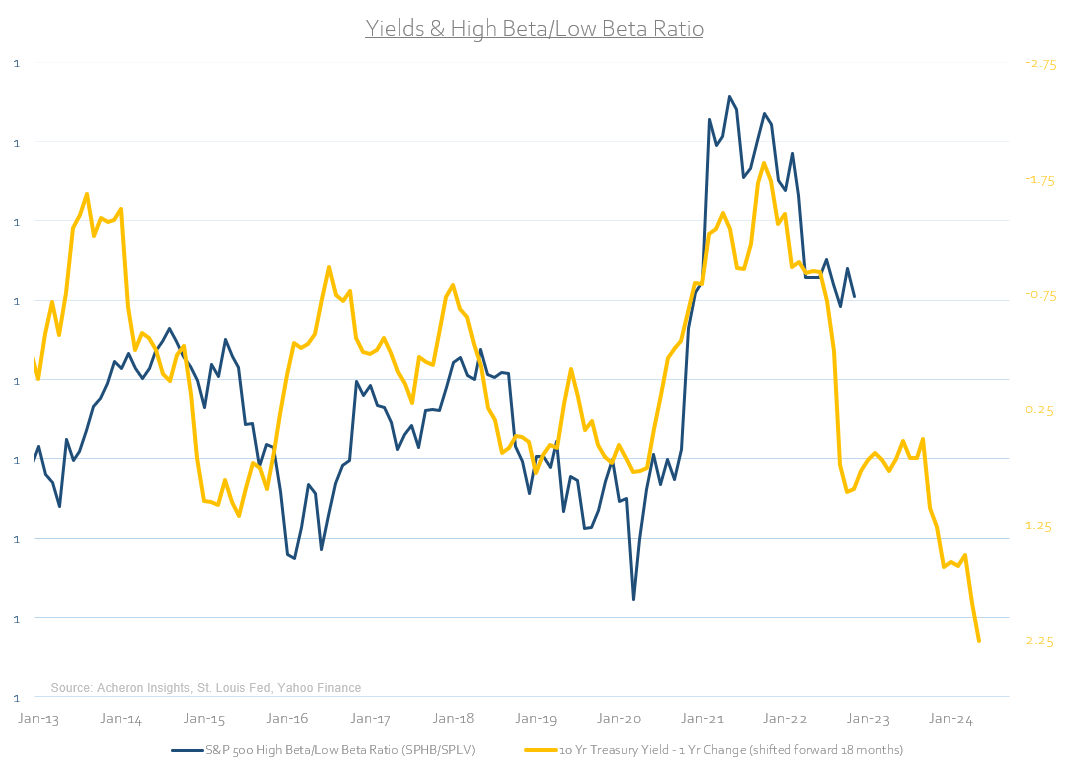
Especially given how digital assets continue to trade in-line with the high-beta/low-beta ratio. High-beta assets do not outperform during growth and liquidity slowdowns.
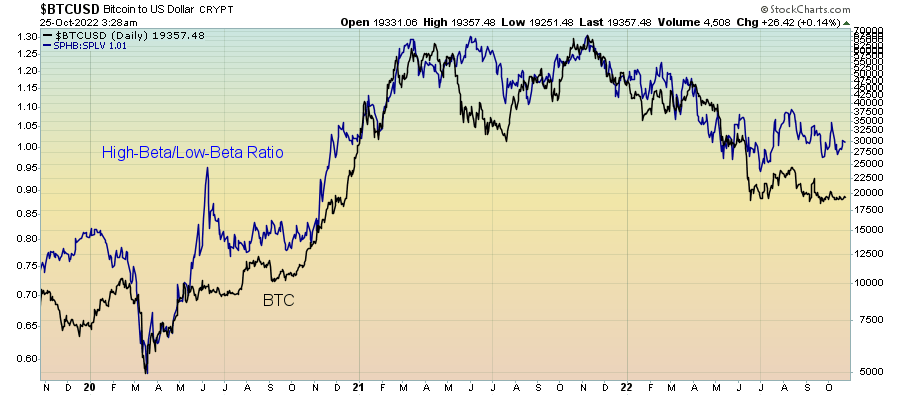
Indeed, given the recent extreme tightening of financial conditions the outlook for the high-beta/low-beta ratio and thus crypto over the next six months is unfavorable to say the least.
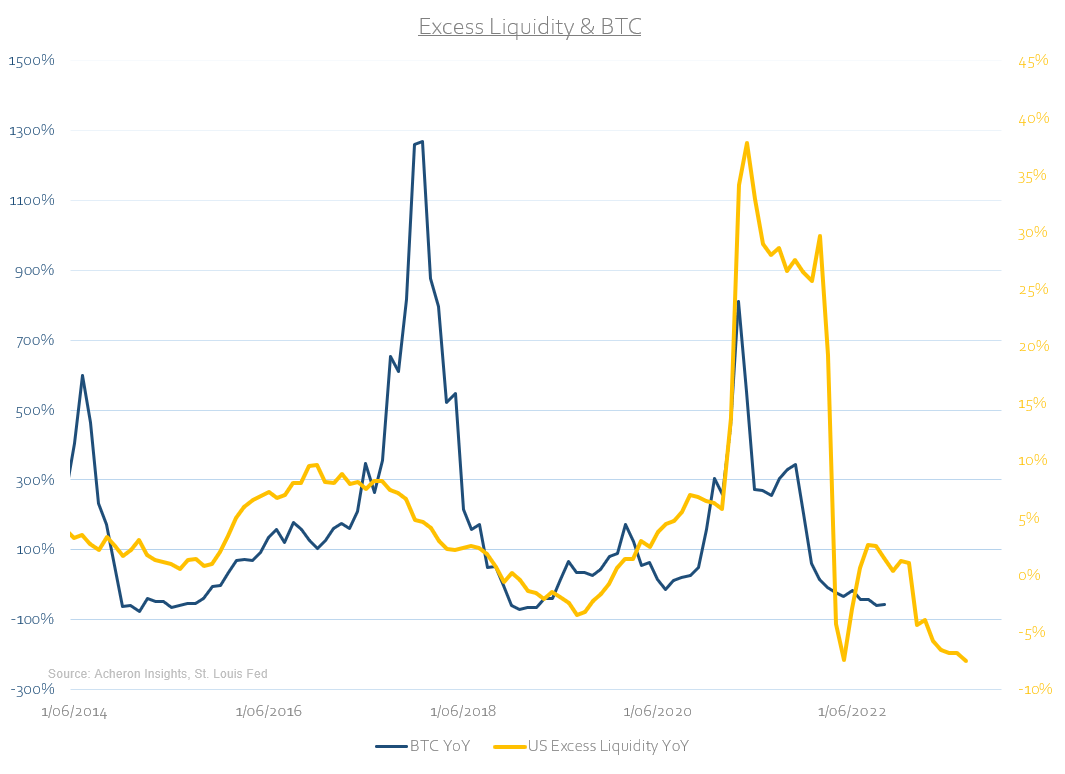
Particularly when analysed in conjunction with liquidity, which has been one of the biggest drivers of capital flows into digital assets in recent years and is yet inflect positively.
As a result, it should be of no surprise to see retail and speculative participation within the crypto space remain muted, with Active Addresses continuing to trend sideways. To me, this metric is as close to an on-chain macro indicator as can be found.
Enough with the bearishness, if we turn now to the short-term outlook for the crypto space, as I have touched one there are positive signs for the weeks ahead. Firstly, derivative open interest and leverage remains elevated relative to recent price action and such divergences offer indicate forthcoming volatility.
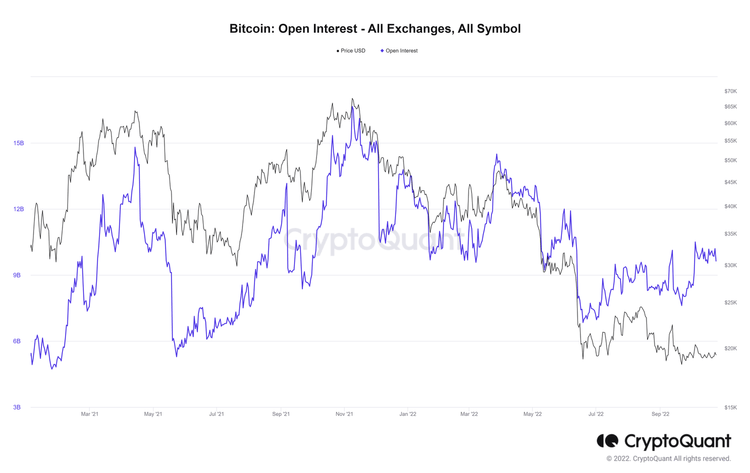
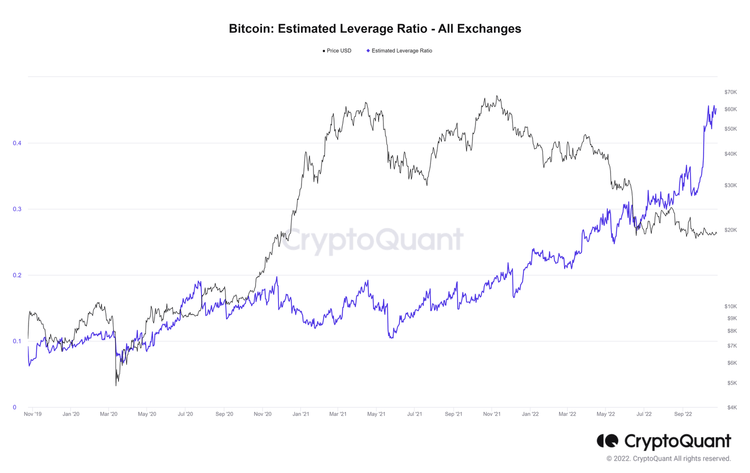
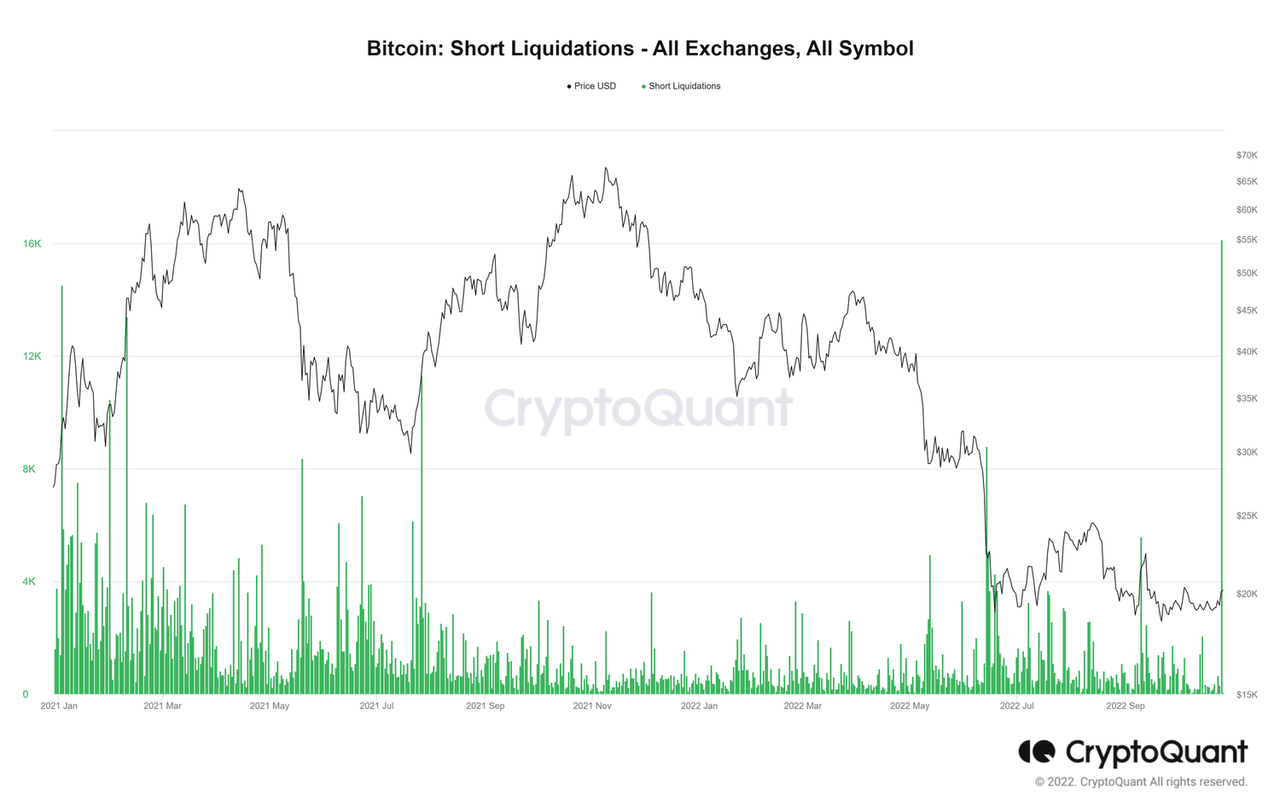
Whilst this may not necessarily preclude one to presume positive price action, it does indicate the potential for a short-squeeze over the next week or two. In fact, this dynamic appears to bear much responsibility for yesterday’s big move, coinciding with the highest level of short liquidations seen in over 18 months.
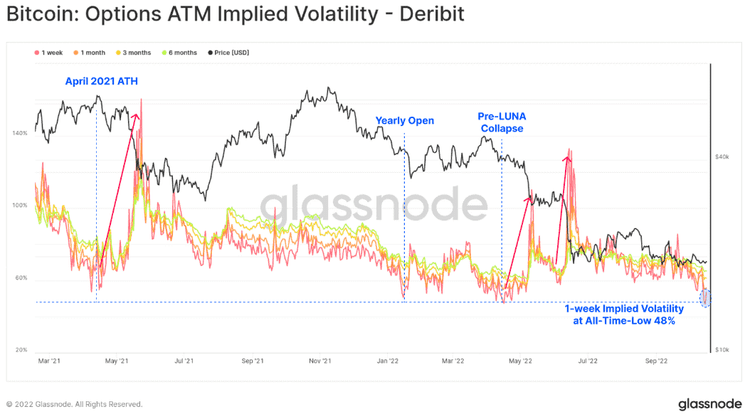
In a similar vein, another trend to be observed of late is the movements in crypto volatility, with both implied and realised volatility reaching their lows for the year in recent weeks.
Source: Hedgeye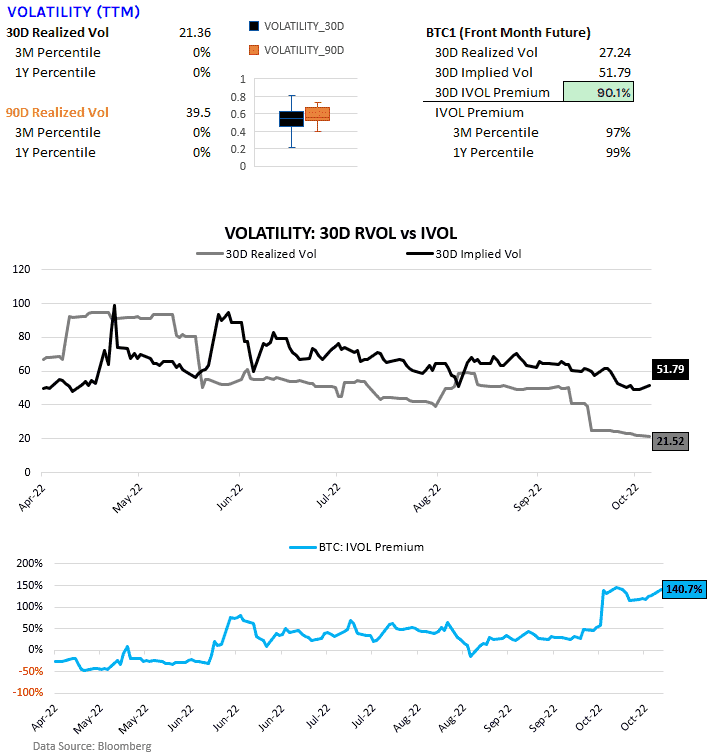
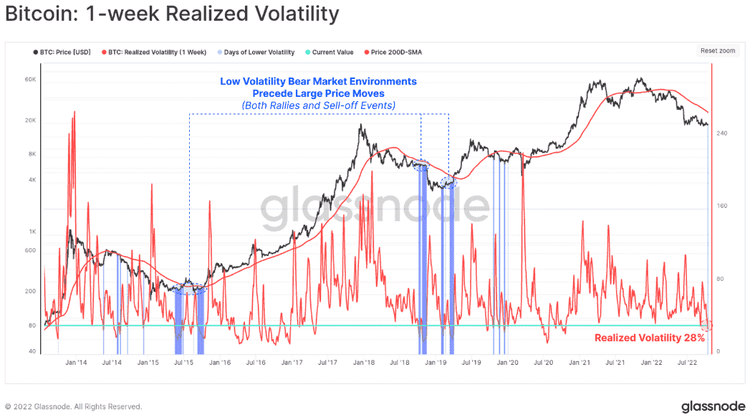
It is uncommon to see both realised and implied vol remain at such low levels for a prolonged period of time. What we can glean from this trend is that periods of low volatility often precede significant moves in price, and thus periods of high volatility, as noted below by Glassnode. Yesterday’s big move appears to confirm this thesis.
What’s more, the months of October through December have historically been the most favourable for Bitcoin, again suggesting this move may be to the upside.
Source: CoinDesk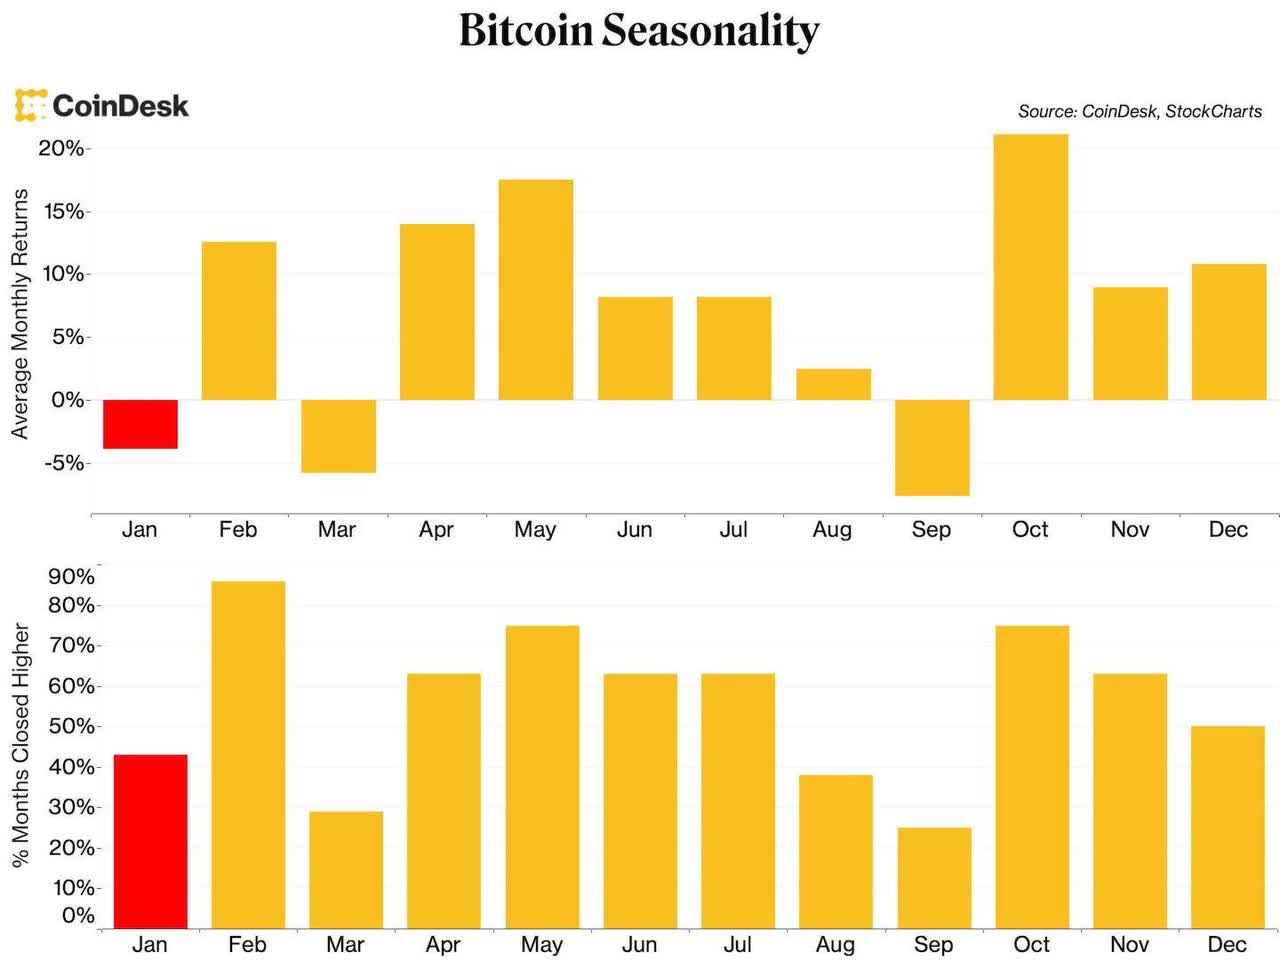
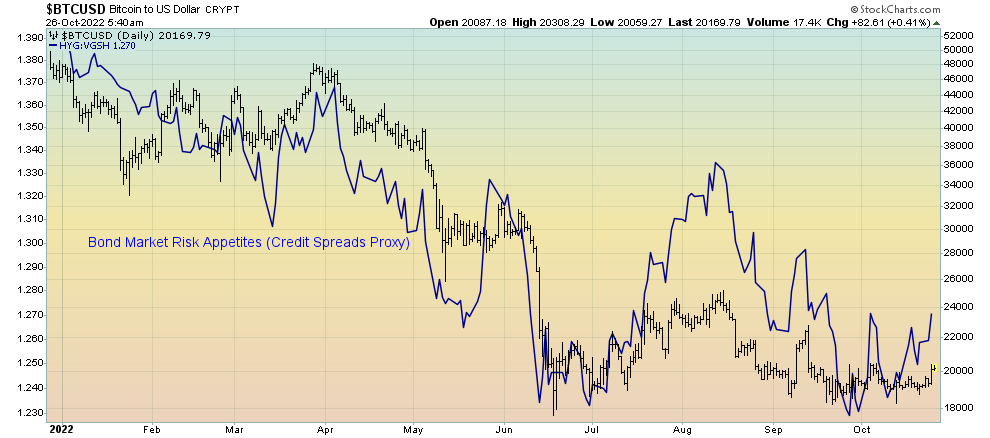
Couple this favourable seasonality with the aforementioned technical picture and positive divergence in the high-beta/low-beta ratio that can be seen in the previous chart, as well as the recent move higher in bond market risk appetites (which is a proxy measure for credit spreads, and one that crypto tends to trade in-line with), there is clearly the potential for further upside short term.
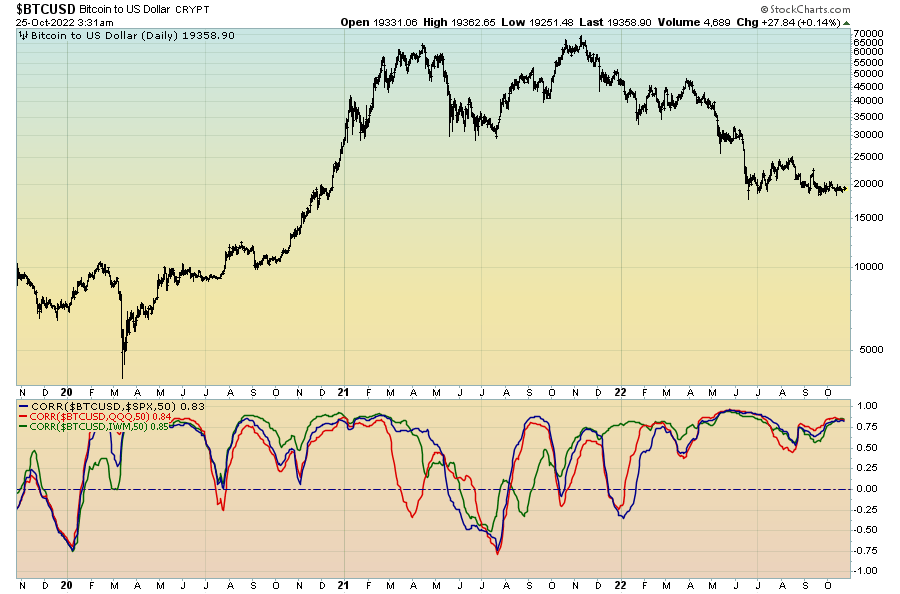
This is the very same argument I have made for the stock market in recent weeks (which you can consumer here for your viewing pleasure), and given how Bitcoin and equities have traded in lockstep of late, such an outcome in stocks would seeming presage a similar outcome in digital assets.
Although this is a possibility in the short term, it is important not to lose focus on the main drivers of crypto over the medium term. Once again, given the macro and liquidity outlook any rally may be an excellent opportunity to add to hedges or reduce overall positions. There will be a time to overweight digital assets but now is not that time. Remember, trade versus trend.
Be the first to comment