

Crude Oil Price Talking Points
The price of oil stages a four-day rally as it extends the series of higher highs and lows from last week, and crude may continue to retrace the decline from the yearly high ($130.50) as it clears the opening range for May.
Crude Oil Price Forecast: Crude Price Clears Opening Range for May
The price of oil climbs to a fresh monthly high ($114.69) even as the Organization of Petroleum Exporting Countries (OPEC) warn of a slowdown in global demand, and signs of limited supply may keep crude prices afloat throughout the year as the group plans to “adjust upward the monthly overall production by 0.432 mb/d for the month of June 2022.”
It seems as though OPEC will retain the current production schedule over the coming months as the Monthly Oil Market Report (MOMR) now states that “in 2022, oil demand growth was revised down by 0.3 mb/d to average 3.4 mb/d y-o-y, accounting for potential declines in global GDP and the resurgence of the Omicron variant of COVID-19 in China.”
In turn, the MOMR warns that “world oil demand is projected to average 100.3 mb/d, which is 0.2 mb/d lower than the previous month’s estimates and approximately 0.1 mb/d higher than 2019,” and expectations for lower demand may keep OPEC on a preset course in restoring production even though “demand for OPEC crude in 2022 was revised up by 0.1 mb/d from the previous month to stand at 29.0 mb/d, which is around 0.8 mb/d higher than in 2021.”
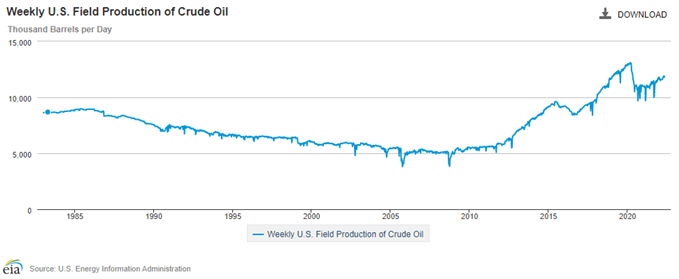
As a result, signs of limited supply may generate higher oil prices as US output narrows for the first time since January, with weekly field production slipping to 11,800K in the week ending May 6 from 11,900K the week prior.
With that said, the price of oil may continue to exhibit a bullish trend as it largely tracks the positive slope in the 50-Day SMA ($105.00), and crude may attempt to retrace the decline from the yearly high ($130.50) as it clears the opening range for May.
Crude Oil Price Daily Chart
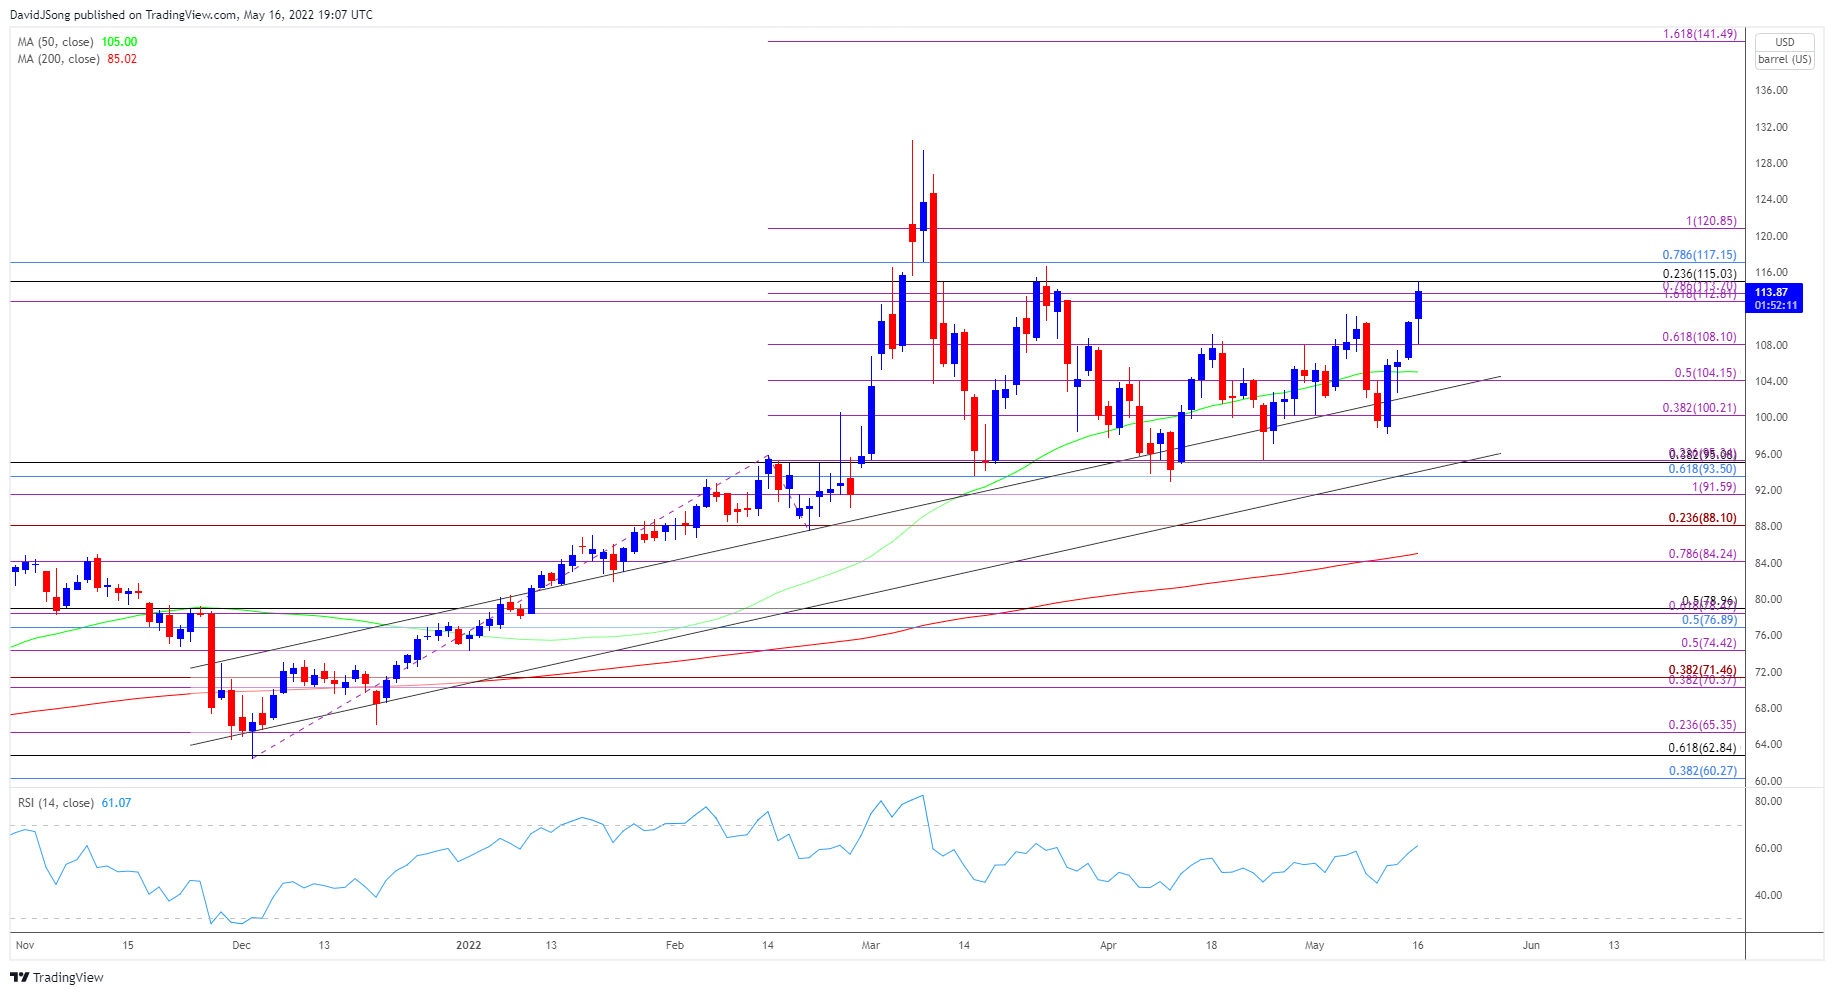
Source: Trading View
- The price of oil clears the monthly opening range as it extends the series of higher highs and lows from last week, with the break/close above the $112.80 (161.8% expansion) to $113.70 (78.6% expansion) region pushing crude towards the $115.00 (23.6% retracement) handle.
- The price of oil may attempt to retrace the decline from the yearly high ($130.50) as it appears to be tracking the positive slope in the 50-Day SMA ($105.00), but need a break/close above the $115.00 (23.6% retracement) handle to open up the $117.20 (78.6% retracement) area.
- Next area of interest comes in around $120.90 (100% expansion), with a break above the yearly high ($130.50) bringing the $141.50 (161.8% expansion) region on the radar.
- However, failure to break/close above the $115.00 (23.6% retracement) handle may push the price of oil back towards the $108.10 (61.8% expansion) area, with a move below the 50-Day SMA ($105.00) bringing the $104.20 (50% expansion) region back on the radar.
— Written by David Song, Currency Strategist
Follow me on Twitter at @DavidJSong
Be the first to comment