CRUDE OIL & GOLD TALKING POINTS:
- Crude oil prices edge up as risk appetite steadies, US stimulus plan eyed
- OPEC monthly report, US CPI might pass without much market impact
- Gold prices may fall if fiscal fillip pushes back on Fed rate cut outlook
Crude oil prices drifted cautiously higher in a move that seemed corrective as markets digest the breakneck selloff at the start of the week. The advance tracked alongside a rebound in the bellwether S&P 500 stock index – a proxy for market-wide risk appetite.
US fiscal stimulus plans are now in focus. President Donald Trump skipped a press conference meant to unveil a “major” economic package to counter the coronavirus outbreak yesterday. Markets will watch closely for any details from here. A payroll tax holiday is among the steps rumored under discussion.
For their part, financial markets are palpably uneasy with the delay. Asia Pacific stock exchanges are in the red and futures tracking key European and US equity benchmarks are pointing convincingly lower, hinting that a risk-off tilt is emerging across global markets once again.
OPEC MONTHLY REPORT MAY PASS QUIETLY, EIA INVENTORY DATA DUE
Scanning the event calendar, the OPEC monthly report seems unlikely to offer much novelty to investors, limiting its market-moving potential. Concerns about demand headwinds from the coronavirus outbreak and the collapse of the output cap scheme will probably take center stage.
EIA inventories data is also on tap. It is expected to show that US stockpiles added 2.11 million barrels last week. An estimate from API pointed to a more dramatic 6.41-million-barrel build yesterday, which might set the stage for a downbeat surprise on official figures. This could help reanimate sellers.
CRUDE OIL TECHNICAL ANALYSIS
WTI crude oil is testing support-turned resistance at 34.86, the 61.8% Fibonacci expansion. A handful of minor levels follow but prices probably need to close back above support-turned-resistance in the 42.05-43.39 area to defuse immediate selling pressure. A break of $50/bbl may offset the bearish bias altogether.
Crude oil price chart created using TradingView
Starts in:
Live now:
Mar 18
( 09:03 GMT )

Recommended by Ilya Spivak
Indices and Commodities for the Active Trader
GOLD PRICES EYE US FISCAL STIMULUS, CPI DATA MAY GO UNNOTICED
Gold prices edged lower as cautious stabilization buoyed yields and undermined the appeal of non-interest-bearing assets. The yellow metal struggled to capitalize on market turmoil at the beginning of the week however and the subsequent pullback was equally staid, leaving it firmly within its near-term range.
If the announcement of a substantial US fiscal stimulus effort moderates the dramatically dovish shift in Fed monetary policy bets of recent weeks, that may tarnish gold’s appeal and send it lower. February’s US CPI report might pass without much a response, all else considered.
GOLD TECHNICAL ANALYSIS
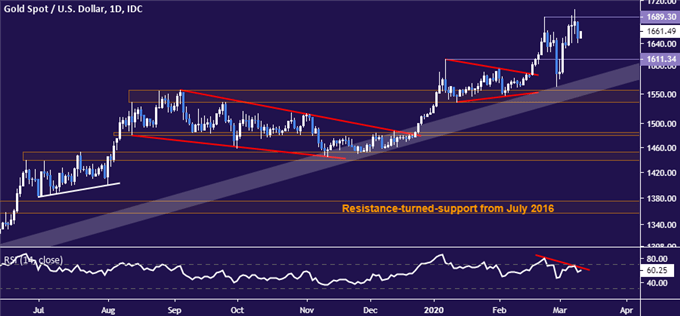
Prices are pulling back from resistance at 1689.30 as expected. Initial support is at 1611.34, with a daily close below that setting the stage for a test of rising trend support in the 1535.03-57.10 area. Securing a foothold under this would suggest gold’s 11-month uptrend has been breached.
Gold price chart created using TradingView


Recommended by Ilya Spivak
Traits of Successful Traders
COMMODITY TRADING RESOURCES
— Written by Ilya Spivak, Currency Strategist for DailyFX.com
To contact Ilya, use the comments section below or @IlyaSpivak on Twitter


Be the first to comment