

CRUDE OIL PRICE OUTLOOK:
- Crude oil prices hovered near key resistance as Chinese data disappointed
- US-Iran nuclear talks remain in focus, and an OPEC+ meeting will be closely eyed by oil traders
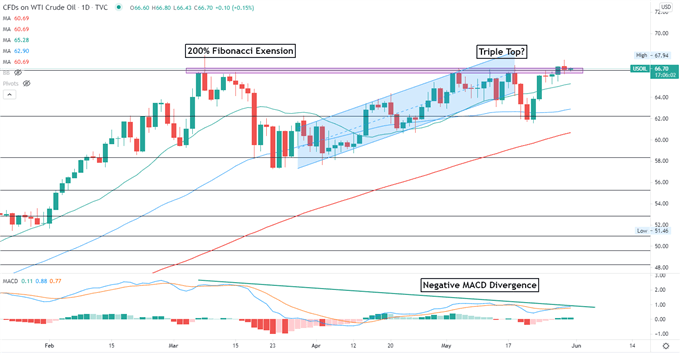
- WTI is challenging $66.50 for a third time, potentially forming a “Triple Top” chart pattern
Crude oil prices traded slightly higher during the Asia-Pacific mid-day session after registering a 4.3% gain last week. Market participants are trying to strike a balance between rising demand from the world’s largest economies and potentially higher output from Iran as well as new Covid-19 outbreaks in the Asia-Pacific region.
China’s NBS manufacturing PMI came in at 51.0, compared to a consensus forecast of 51.1. The disappointing figure dented risk sentiment in Asia-Pacific trade. In addition, a 7.4% YoY decline in Chinese oil products consumption in April further weighed on energy prices. Both the US and UK markets are shut for holidays on Monday, rendering oil prices vulnerable to heightened volatility if unexpected news hit the newswires amid poor liquidity conditions.
Traders are holding their breath for the 17th OPEC and non-OPEC ministerial meeting to be held on June 1st. The oil cartel is widely expected to stick with a decision to gradually boost output during May to July to meet rising global demand. Now they might need to take a potential rise in Iranian production into consideration. Ongoing nuclear talks between Iran and world powers are paving the way to remove some economic sanctions, including oil exports, on the Middle Eastern country. This may unleash as much as 2 million bpd of additional supply on the global market, weighing on oil prices.
Encouragingly, the number of daily new Covid-19 cases have been falling in India and Japan – the world’s third and fourth largest oil importers respectively. India has seen its 7-day average of new coronavirus infections declining from a peak of 391,232 to 194,953 on May 29th (chart below). The 7-day average case count for Japan has also fallen to 4,006 from a recent peak of 6,460. The number of new infections in mainland China has rebounded, and Malaysian cases have hit a new record however, casting a shadow over the outlook for energy demand.
New confirmed Covid-19 cases in India and Japan
Source: Google
Technically, WTI is challenging a key resistance level at 66.50 (the 200% Fibonacci extension) for a third time this month. A successful breach may open the door for further upside potential. A failed try however, may result in a “Triple Top” chart pattern, which has an inherently bearish nature. Immediate support can be found at 65.30 – the 20-day SMA line.
Negative MACD divergence suggests that upward momentum may be fading, reinforcing the case for a bearish scenario.
WTI Crude Oil Price – Daily Chart
— Written by Margaret Yang, Strategist for DailyFX.com
To contact Margaret, use the Comments section below or @margaretyjy on Twitter
Be the first to comment