

CRUDE OIL PRICE OUTLOOK:
- Crude oil prices fell for a third day after China reported disappointing retail sales and industrial production figures
- The University of Michigan consumer sentiment index plummeted to a decade low of 70.3, weighing on demand outlook
- WTI is testing trendline support, with sentiment tilting to the downside
Crude oil prices extended lower during Monday’s APAC mid-day session, marking a three-day decline of 2.35%. The release of poorer-than-expected Chinese industrial production and retail sales figures weighed on energy prices, showing that the world’s second-largest economy is struggling to maintain growth momentum amid viral resurgence. Meanwhile, the University of Michigan said its preliminary consumer sentiment index plunged to 70.2 in early August, marking a sharp pullback from 81.2 in July. This is also the lowest reading observed in a decade, pointing to a slowing recovery and dampening the energy demand outlook.
In China, the growth rate of industrial production moderated to 6.4% YoY in July, marking a 4th consecutive monthly decline (chart below). This also missed market expectations of a 7.8% rise. Retail sales growth declined to 8.5% from 12.1% a month ago, falling sharply below a baseline forecast of 11.5%. This suggests that measures to curb the Delta variant and a flood in Henan province have had greater-than-expected impacts on consumer spending and production. As a result, crude oil prices declined, and haven-linked assets climbed.
China continued to adopt tight travel restrictions and impose lockdowns in areas where Covid-19 infections were found. The National Health Commission (NHC) reported 30 new locally transmitted coronavirus cases on Saturday, the lowest daily total in two weeks. This presented a silver lining for putting the pandemic under control, yet the authorities may continue to adopt tight measures to prevent resurgence.
China Industrial Production – Past 12 Months
Source: Bloomberg, DailyFX
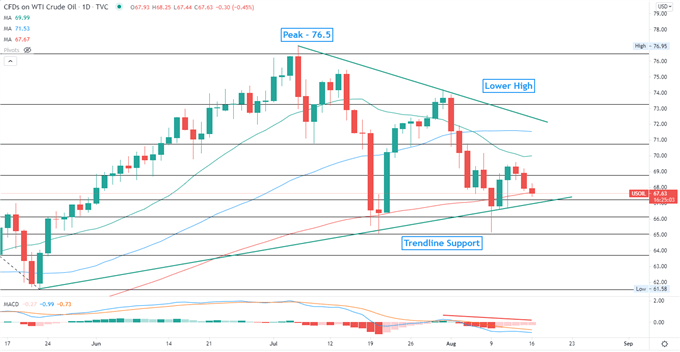
Technically, WTI is oscillating within a “Wedge” as highlighted on the chart below. The upper and lower bound of the “Wedge” may be viewed as immediate resistance and support levels respectively. The trio of short-, medium- and longer-term SMA lines are sloping downwards, underscoring a downward trajectory. The MACD indicator is trending lower, underscoring bearish momentum.
WTI Crude Oil Price – Daily Chart
— Written by Margaret Yang, Strategist for DailyFX.com
To contact Margaret, use the Comments section below or @margaretyjy on Twitter
Be the first to comment