

Gold Prices, Crude Oil, OPEC+, US PPI, Commodities Briefing – Talking Points:
- Crude oil prices vulnerable to near-term pullback after OPEC trim demand estimates.
- Rebounding yields place downward pressure on gold prices.
- Gold could gain on soft US PPI figures .
Crude oil prices have regained lost ground in recent days, as the gradual increase in road usage suggests that a broad recovery in overall fuel consumption is picking up speed. Apple mobility data shows that the number of people driving in Europe, the UK, and the US, has continued to rise since the start of the year, as the rollout of coronavirus vaccinations and falling rate of infections allows several developed economies to begin returning to a level of normality.
Supply constraints have also underpinned the growth-sensitive commodity, as OPEC+ shocked market participants by opting to keep its current output settings steady, despite previously contemplating introducing an additional 1.5 million barrel a day of output in April. However, the cartel cut its demand estimates for the second quarter of 2021, citing the impact that “ongoing lockdown measures, voluntary social distancing and other pandemic-related developments” are having on economic activity.
Data Source – Apple
This rather dim outlook could take some wind out of the sails of crude oil prices and lead to a short-term pullback towards the $64 mark. Gold prices, on the other hand, are looking to extend recent gains after softer-than-expected core CPI data out of the US cooled underlying inflation expectations and directed capital back into longer-term Treasury bonds. The resulting turn lower in yields relieved some of the downward pressure on the anti-fiat metal.
That being said, the signing of President Joe Biden’s $1.9 trillion coronavirus-relief package in to law, in combination with a Federal Reserve that seems rather unfazed by the recent rise in longer-term rates, may limit Bullion’s potential upside in the near term.
Nevertheless, a softer-than-expected US PPI print for February could pave the way for gold prices to continue rebounding higher ahead of the FOMC monetary policy meeting next week.
Crude Oil Daily Chart – RSI Divergence Hints at Uptrend Exhaustion
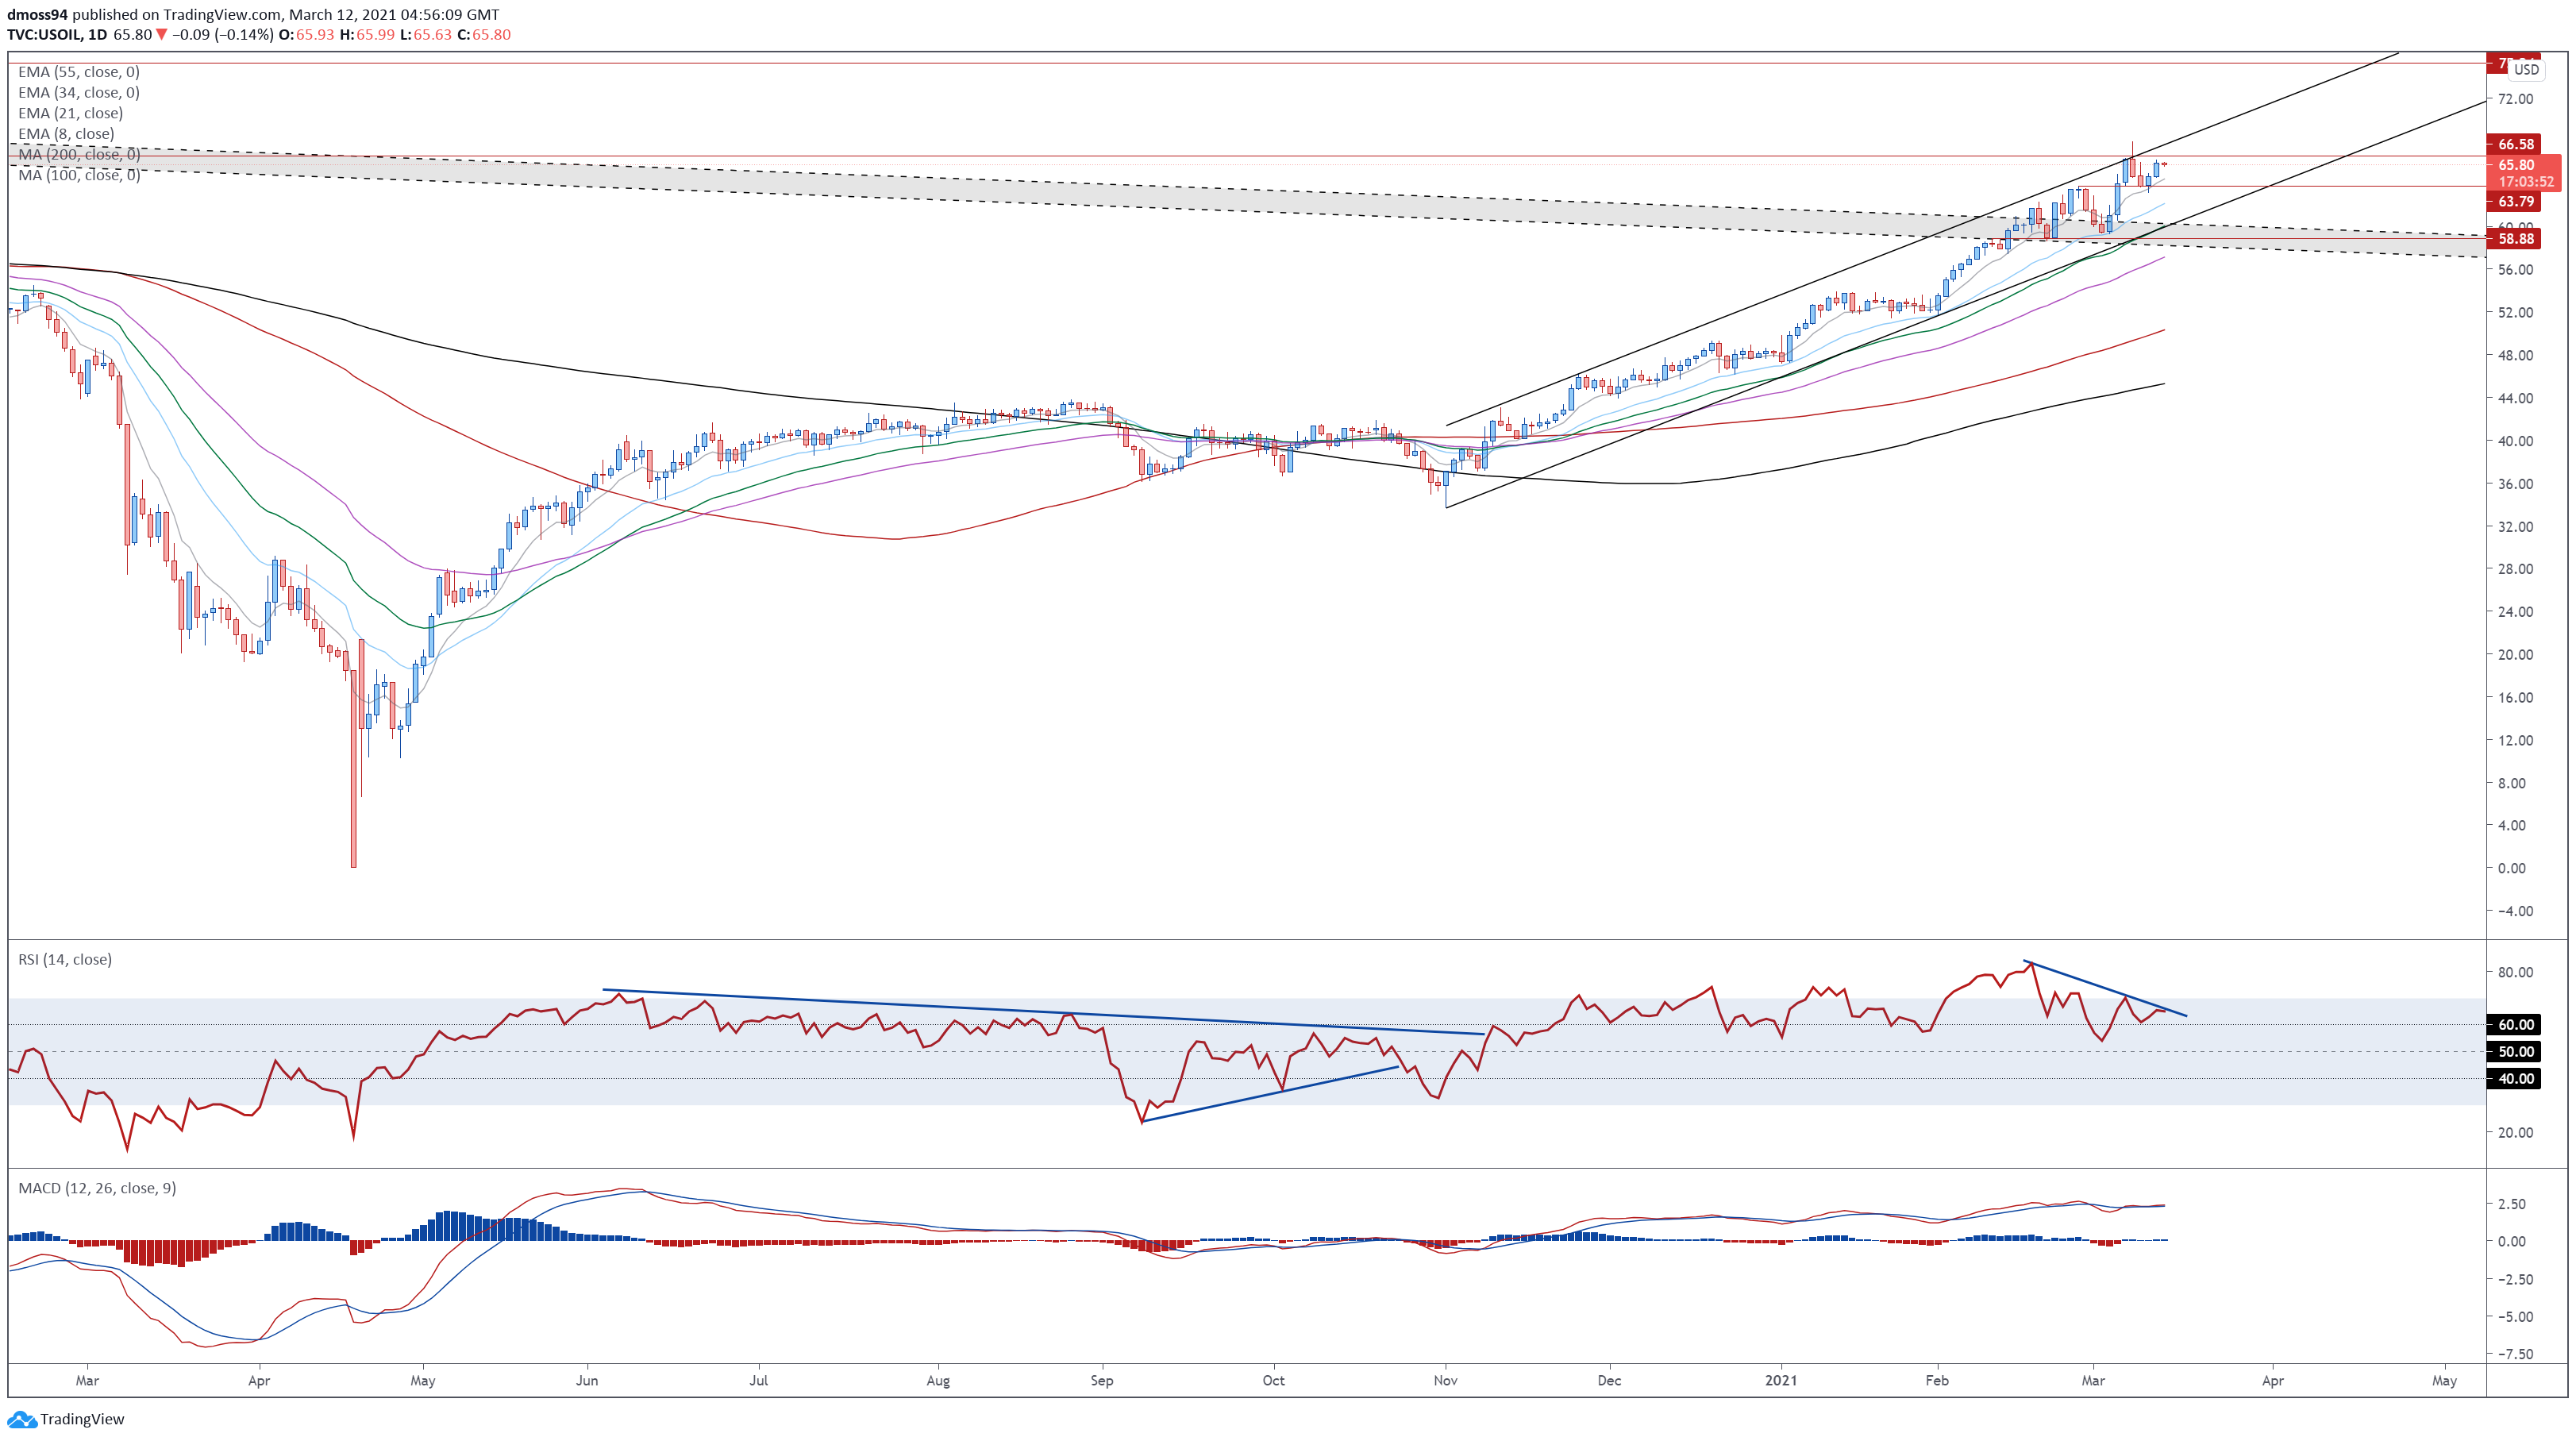
Crude oil futures daily chart created using Tradingview
The technical outlook for crude oil remains overtly bullish, as price continues to track within the confines of an Ascending Channel after slicing through the downtrend extending from the 2008 highs.
However, bearish RSI divergence suggests that the recent push to fresh yearly highs may be running out of steam, as price attempts to hurdle psychological resistance at 66.00.
Failing to gain a firm foothold above this level on a daily close basis may precipitate a pullback to former resistance-turned-support at the February high (63.79).
Alternatively, a daily close above the March 8 open (66.26) could signal the resumption of the primary uptrend and bring the imposing 70.00 mark into the crosshairs.
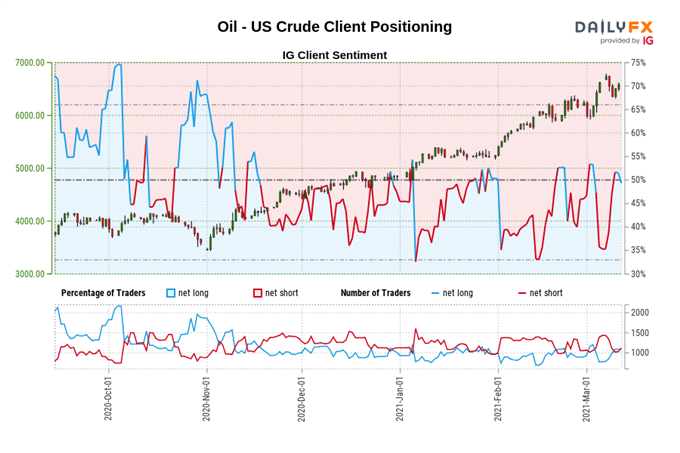
The IG Client Sentiment Reportshows 48.47% of traders are net-long with the ratio of traders short to long at 1.06 to 1. The number of traders net-long is 3.41% lower than yesterday and 36.51% higher from last week, while the number of traders net-short is 11.41% higher than yesterday and 18.88% lower from last week.
We typically take a contrarian view to crowd sentiment, and the fact traders are net-short suggests Oil – US Crude prices may continue to rise.
Positioning is more net-short than yesterday but less net-short from last week. The combination of current sentiment and recent changes gives us a further mixed Oil – US Crude trading bias.
Gold Price Daily Chart – Break Above 8-EMA Could Lead to Further Gains

Gold price daily chart created using Tradingview
Gold prices have rebounded sharply in recent days, after collapsing below the 1700 mark for the first time since June of 2020.
The recent break back above the short-term 8-EMA (1720), in tandem with a bullish crossover on the MACD indicator, suggests that a more extended rebound could be at hand.
Having said that, the formation of a Shooting Star candle on March 11 could inspire would-be sellers and result in push back towards the monthly low (1677).
However, if price can remain constructively positioned above 1700, a upside move to challenge former support-turned-resistance at the 50% Fibonacci (1763) may be in the offing.
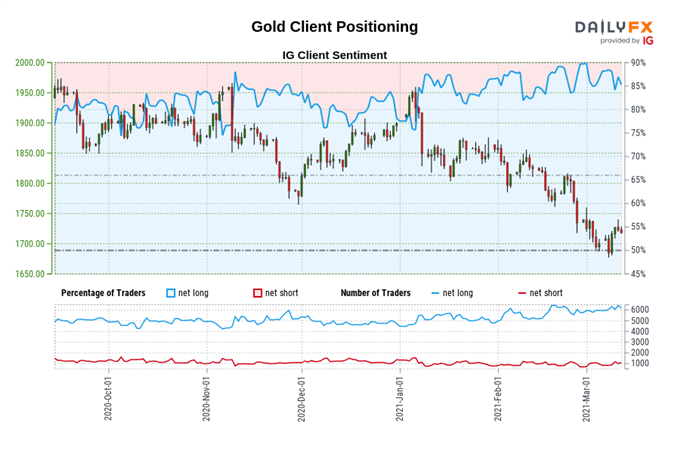
The IG Client Sentiment Report shows 85.02% of traders are net-long with the ratio of traders long to short at 5.68 to 1. The number of traders net-long is 4.13% lower than yesterday and 3.74% higher from last week, while the number of traders net-short is 20.25% higher than yesterday and 17.23% higher from last week.
We typically take a contrarian view to crowd sentiment, and the fact traders are net-long suggests Gold prices may continue to fall.
Yet traders are less net-long than yesterday and compared with last week. Recent changes in sentiment warn that the current Gold price trend may soon reverse higher despite the fact traders remain net-long.
— Written by Daniel Moss, Analyst for DailyFX
Follow me on Twitter @DanielGMoss
Recommended by Daniel Moss
How to Trade Oil
Be the first to comment