

TennesseePhotographer
One of the most iconic restaurant chains in the US has got to be Cracker Barrel Old Country Store (NASDAQ:CBRL). With a unique business model that involves mixing a restaurant with a retail outlet, all operating with an old country theme, the company has done well to carve out for itself a fantastic niche for consumers to enjoy and investors to benefit from. During these difficult times though, even the best companies can face some struggles. Make no mistake. The firm continues to grow nicely, but profitability has struggled some, and management has even been forced to revise down guidance for the current fiscal year. In the near-term, upside potential for the company could be limited because of these issues. But when you look at it from a long-term perspective, the company still likely warrants some upside. Because of that, and despite the troubles the firm is dealing with, I have decided to keep the ‘buy’ Rating I had on the company’s stock previously.
A bit of pain
The last time I wrote an article about Cracker Barrel was back in May of this year. In that article, I talked about how well the company had done to return to growth following the COVID-19 pandemic. This was at a time when the company was still experiencing some weakness on its bottom line. Even so though, I felt as though the growth of the business would continue for the foreseeable future. On top of that, I was also impressed with how cheap shares were, leading me to rate it a long-term ‘buy’ to reflect my view at the time that shares should outperform the broader market moving forward. So far, the company has done just that, even though the disparity between it and the market is not what I would consider to be all that significant. While the S&P 500 is up 1.9%, shares of Cracker Barrel have generated upside of 2.6%.
Author – SEC EDGAR Data
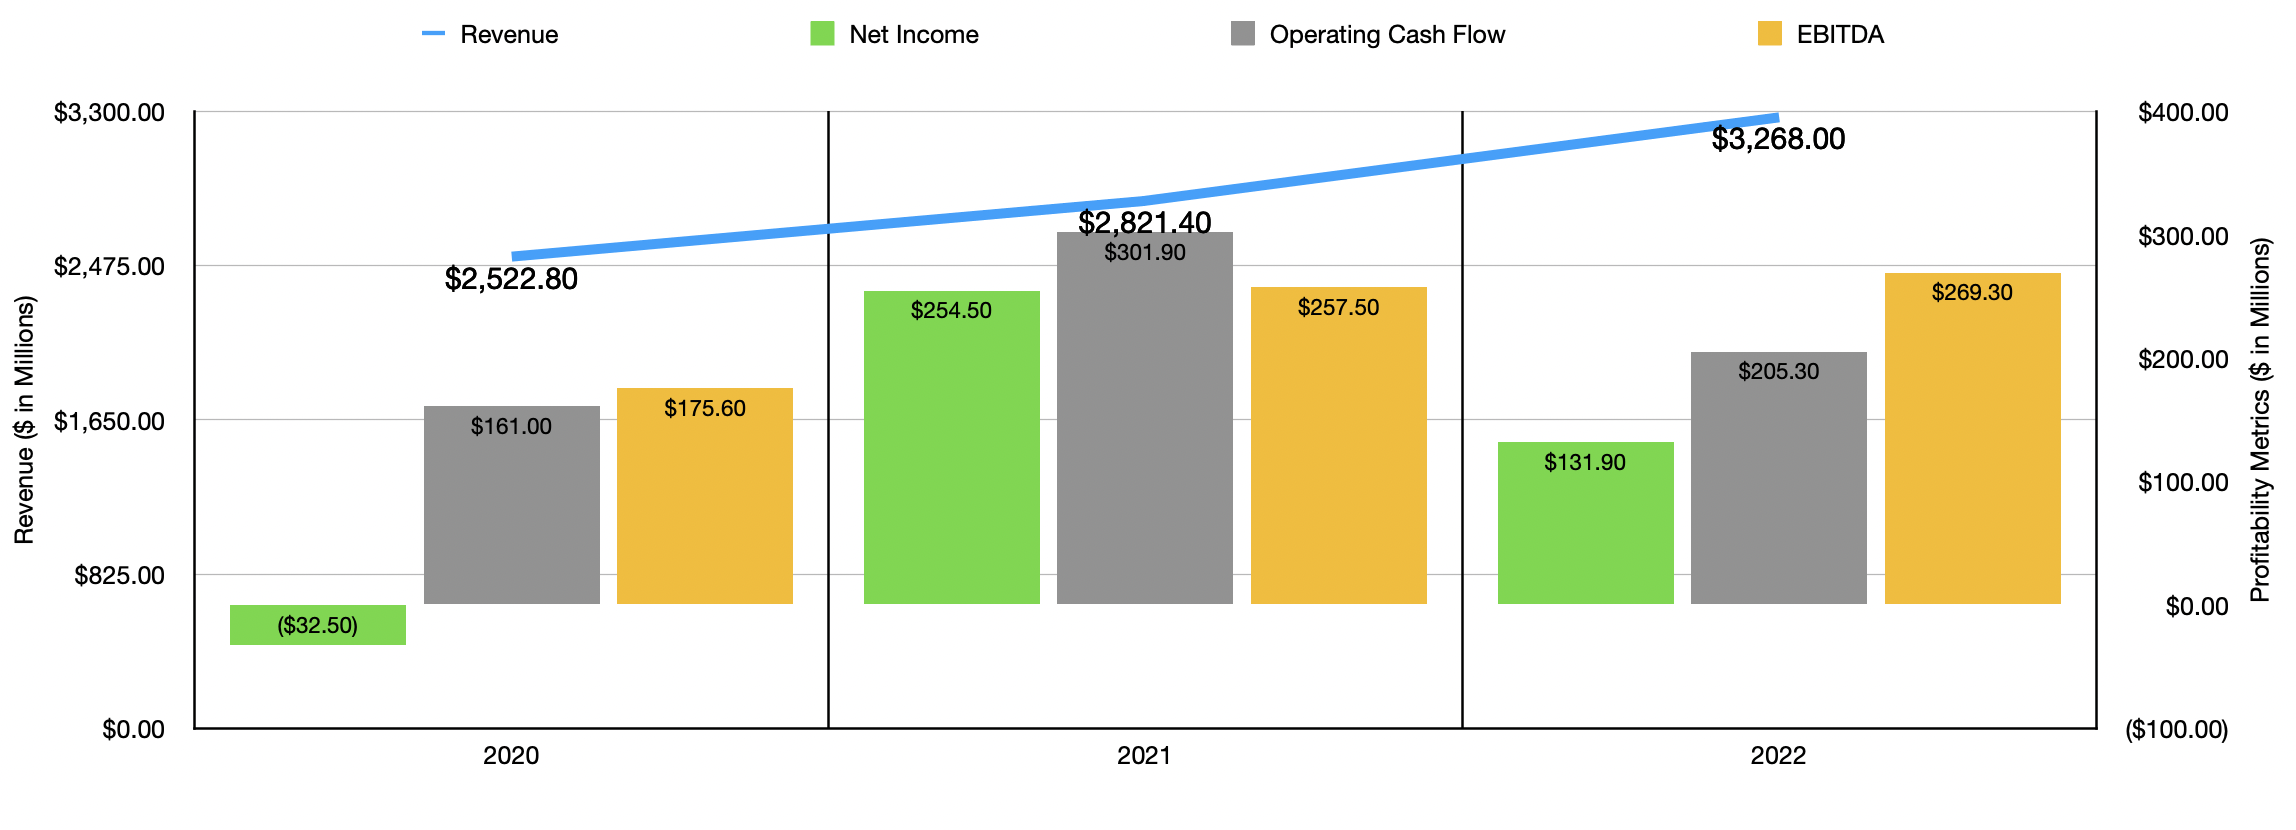
To understand why the company continues to perform well in what is a rather difficult environment, it would be helpful to discuss the company’s most recent financial performance. To start with, let’s touch on its 2022 results. During that year, sales came in at $3.27 billion. That represents an increase of 15.9% over the $2.82 billion the company generated only one year earlier. This growth was driven by a couple of different factors. For starters, the firm did benefit from a rise in store count, with the number of locations jumping from 701 to 717. The overwhelming majority of this growth came from its Maple Street Biscuit Company operations, which the company acquired 100% of back in 2019. In addition to that, the company also benefited from rising comparable store sales. The total comparable sales increase during 2022 was 15.7%. This is driven largely by an 8% increase in comparable traffic and a 7% rise in the average check size of its guests.
With sales rising, you would expect profitability to improve. But the firm did experience some pain on that front. Net income went from $254.5 million and 2021 to $131.9 million last year. Higher costs across some of its categories were rather problematic. For instance, the company’s cost of goods sold went from 30.7% of sales in 2021 to 32.1% of sales last year. This came even as the retail cost of goods sold dropped from 50.1% to 49%. The big pain then came from the restaurant side of the equation, with costs rising from 25.5% of sales to 27.5%. According to management, this was largely driven by a 13.1% rise in commodity expenses resulting from inflationary pressures. In addition to this, the company also saw its labor and other related expenses rise from 34.8% of sales to 35.2%. Management attributed this to wage inflation that exceeded many price increases and to lower productivity resulting from fewer guests being served per labor hours incurred. Because of these cost increases, we also saw other profitability metrics suffer. Operating cash flow, for instance, went from $301.9 million in 2020 to $205.3 million in 2022. Meanwhile, EBITDA shrank from $275.4 million to $269.3 million.
Author – SEC EDGAR Data
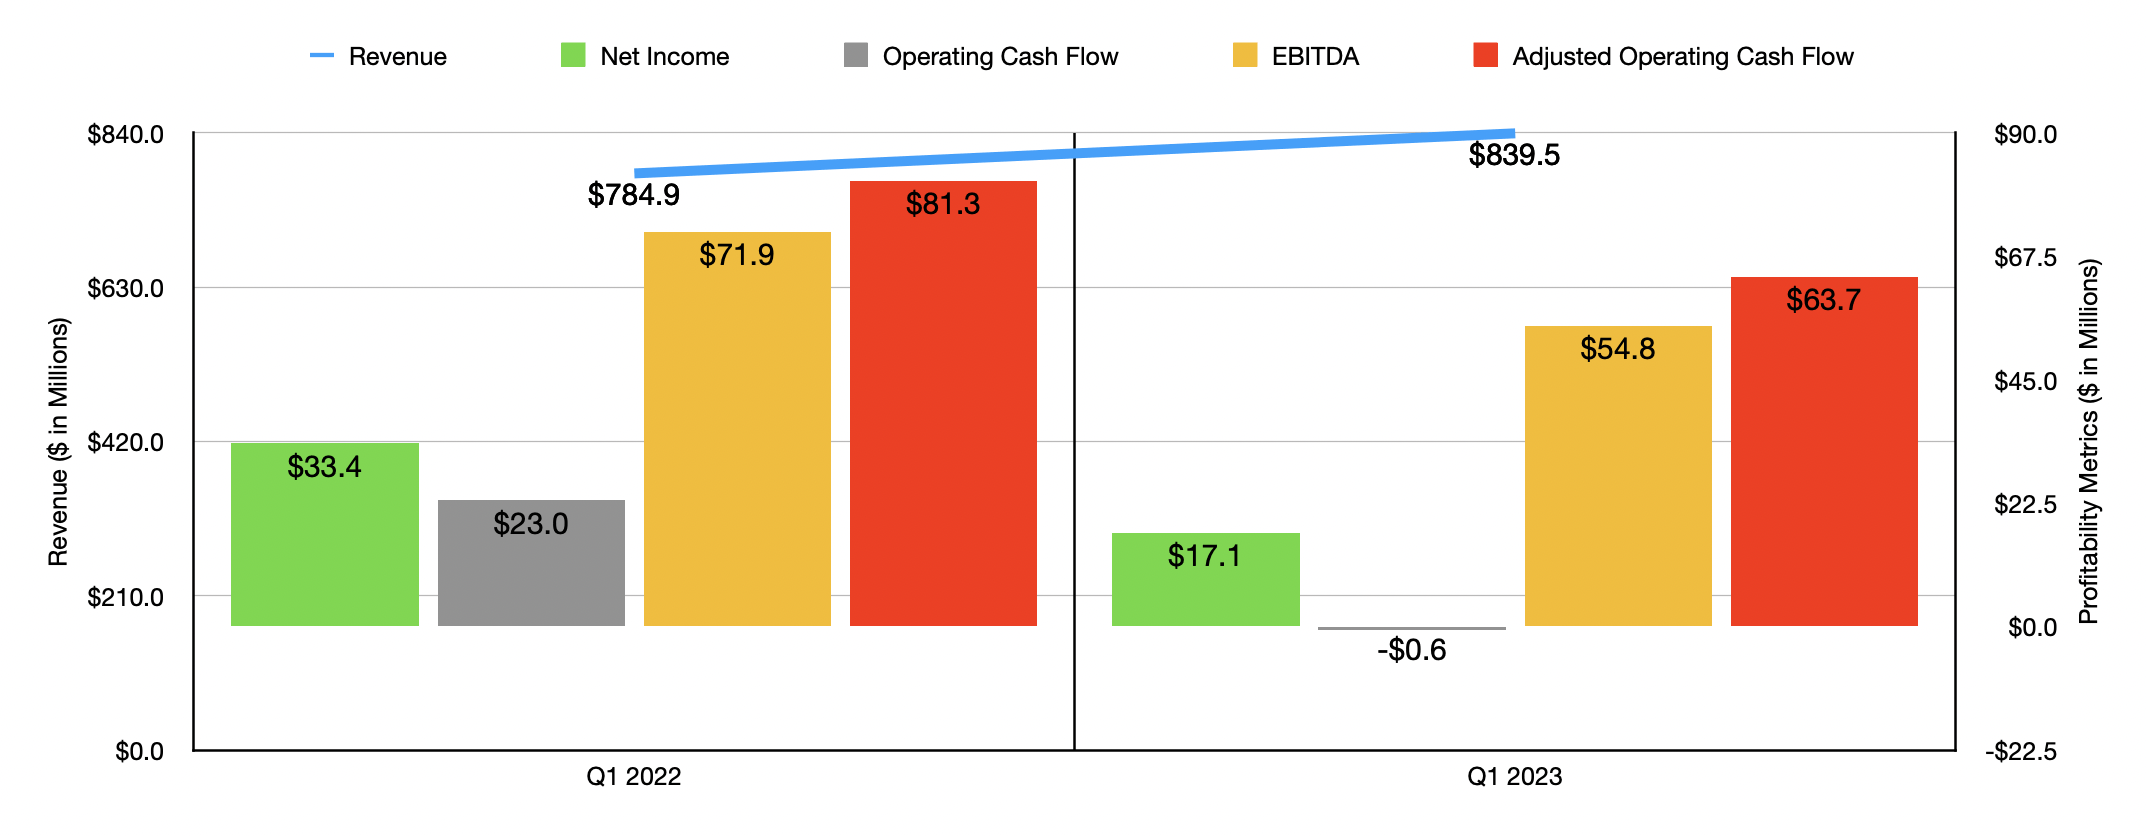
On December 2nd, the management team at the company reported financial results covering the first quarter of its 2023 fiscal year. This quarter saw similar trends to what the firm experienced during its 2022 fiscal year. Revenue, for instance, rose nicely, climbing from $784.9 million last year to $839.5 million this year. A rise in store count from 701 locations to 718 was helpful in this regard. But the company also benefited from a 6.5% rise in comparable store sales. In this case, comparable traffic was actually down year over year, falling 1.8%. But at the same time, this was more than made up for by an 8.9% rise in average check size. In addition to growing nicely year over year, the sales figures reported by the company actually beat expectations set by analysts to the tune of roughly $2.6 million. Even though that was the case, it did not change the fact that management had to downgrade their guidance expectations for the current fiscal year. Previously, management forecasted sales growth of between 7% and 9%. That has now been revised down to between 6% and 8%. Although comparable sales growth is certain to take place, the company should also benefit from between 18 and 24 new locations, with between 15 and 20 of those being under the Maple Street Biscuit Company brand.
On the bottom line, management reported a good deal of pain. Net income came in at only $17.1 million. That’s down from the $33.4 million reported the same time last year. On a per-share basis, the company reported profits of $0.77, which missed expectations by $0.36 per share. Despite revenue rising nicely, margin pressure significantly affected the company and that trend is expected to continue. For 2023 as a whole, the firm is forecasting commodity inflation of between 8% and 9%, with wage inflation of between 5% and 6%. Naturally, other profitability metrics also suffered. Operating cash flow dropped from $23 million to -$0.6 million. Even if we adjust for changes in working capital, it would have declined from $81.3 million to $63.7 million. And over that same window of time, EBITDA fell from $71.9 million to $54.8 million.
Author – SEC EDGAR Data
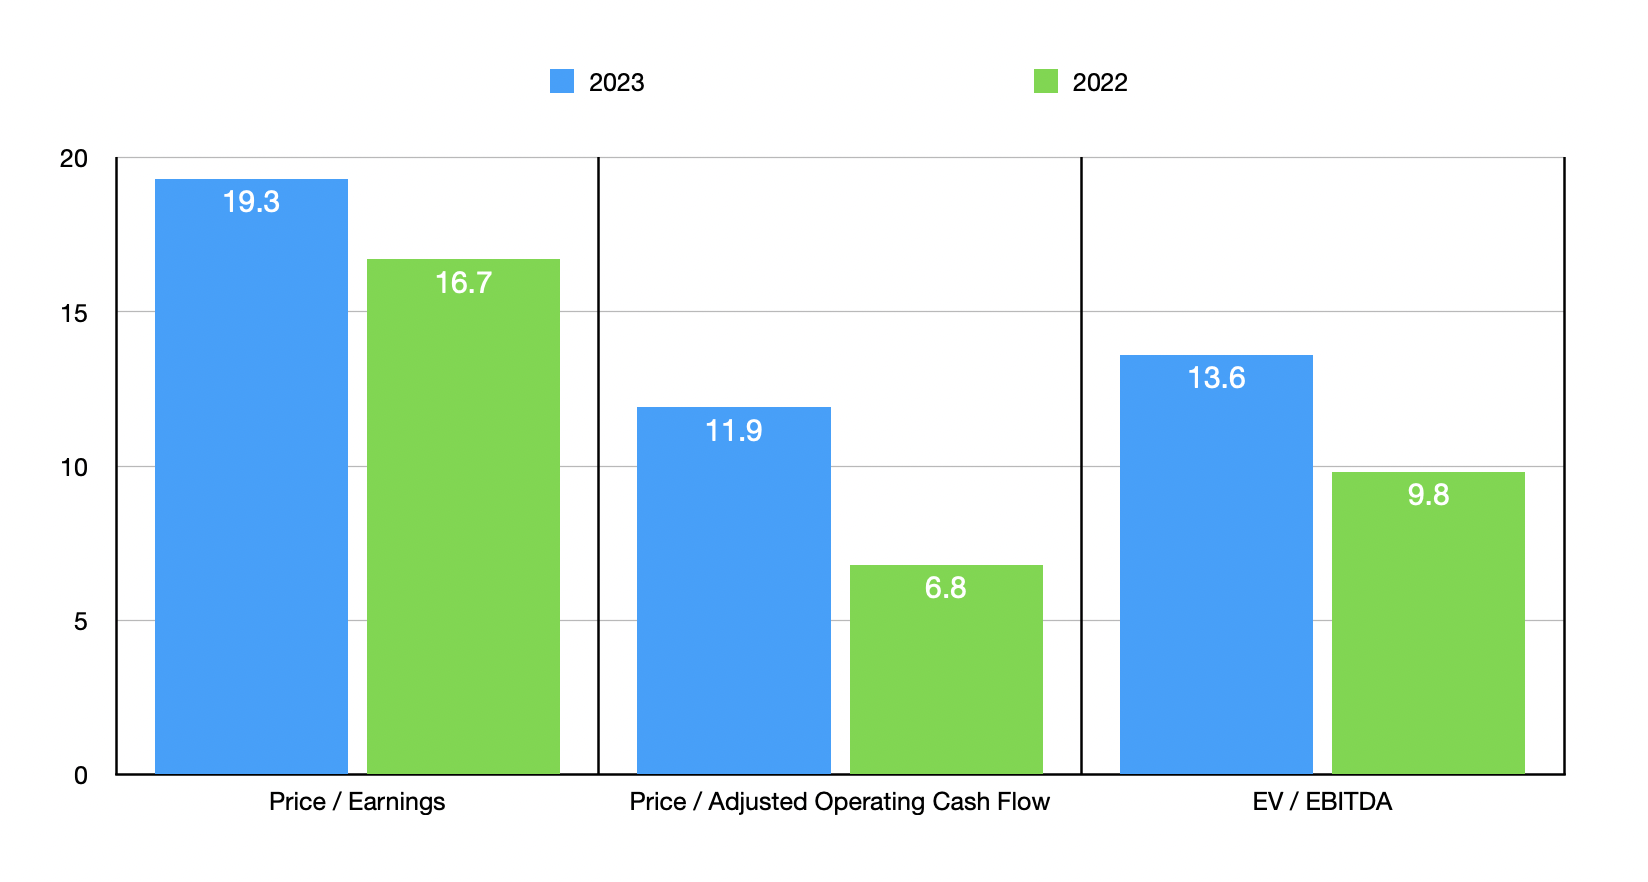
We don’t really know what to expect for the 2022 fiscal year as a whole. Management gave some guidance regarding the operating income margin of the company. If we make some reasonable assumptions regarding interest expense and factor in the 10% to 15% effective tax rate that management is forecasting, we might anticipate net income of around $114 million. This would give us adjusted operating cash flow of roughly $185 million and EBITDA of roughly $194 million. Based on these numbers, the forward price-to-earnings multiple of the company would be 19.3. The forward price to adjusted operating cash flow multiple would be 11.9, and the EV to EBITDA multiple would come in at 13.6. By comparison, if we were to use the data from the 2022 fiscal year, we would get multiples of 16.7, 6.8, and 9.8, respectively.
If we compare the company to similar firms, we see that shares are not unreasonably priced. On a price-to-earnings basis, the five firms I compared it to trade at multiples of between 14 and 34.1. In this case, relative to the 2022 fiscal year data, Cracker Barrel is the cheapest of the group. Using the price to operating cash flow approach, the range would be from 5.2 to 12.9, while using the EV to EBITDA approach would give us a range of between 7.2 and 14.4. In both of these cases, two of the five companies were cheaper than our prospect. Even if we compare these numbers to the multiples using the projected 2023 data, the price-to-earnings approach would result in one of the five being cheaper, the price to operating cash flow approach would result in two of them being cheaper, and the EV to EBITDA approach would result in three of them being cheaper.
| Company | Price / Earnings | Price / Operating Cash Flow | EV / EBITDA |
| Cracker Barrel Old Country Store | 16.7 | 6.8 | 9.8 |
| Darden Restaurants (DRI) | 19.9 | 12.1 | 12.2 |
| Dave & Buster’s Entertainment (PLAY) | 14.0 | 5.8 | 8.4 |
| Bloomin’ Brands (BLMN) | 22.0 | 5.2 | 7.2 |
| Texas Roadhouse (TXRH) | 25.2 | 12.9 | 14.4 |
| Cheesecake Factory (CAKE) | 34.1 | 8.4 | 14.1 |
Takeaway
Although investors might be disappointed in the profitability figures reported by management, Cracker Barrel as a whole seems to be doing fairly well. Yes, the company is dealing with margin issues. But that’s to be expected in this environment. Eventually, the company will adapt or inflation will reverse. When that does come to pass, shares will be looking quite attractive. I wouldn’t exactly call this the strongest prospect in the restaurant space by any means. There are other candidates that I find more appealing. But for investors who want a quality company that will likely continue to fare well in the long run, I do think that Cracker Barrel makes a lot of sense to consider.
Be the first to comment